Mohamed Aziz Chikouche
© 2021 IIETA. This article is published by IIETA and is licensed under the CC BY 4.0 license (http://creativecommons.org/licenses/by/4.0/).
OPEN ACCESS
The aim of this article is to propose a two environmental problems solution. One is the silting up of dams, despite the expensive dredging operations and the absence of a policy for the reuse of dredged sludge stored on non-agricultural land. The other represents the rate of cement used in the concrete. The dredged sludge is introduced after heating treatment at 600°C into the cement matrix of an ordinary concrete represents the proposed solution for both problems. In these eco-concretes, the cement has been replaced by treated dredged sludge at different percentages (5-10-20%) with a similar amount of water. Physical measurements and mechanical tests like shrinkage, absorption, and ultrasonic pulse velocity indicated dependence on substitution under dilution effect. Thermogravimetric analysis like the produced portlandite rate indicates a lack of reactive silica to supply the pozzolanic reaction. The results reveal that the substitution of 5% of cement by treated sludge leads to an appropriate concrete and minimizes the siltation effect.
cement, concrete, mechanical test, physical measurement, sludge, thermogravimetric analysis
Cement remains the essential ingredient for making concrete. Face of global population explosion and the need to build or rebuild, the production of cement increased from 10 million tons in 1900 to 1.6 billion tons in 1998 [1]. In 2017, the production is estimated at 4.65 billion tons [2]. To produce cement, factories continue to exploit the various natural resources, billions of tons of non-renewable clay and limestone lands are consumed every year. In addition, the cement industry is always blamed when the reports of greenhouse gas emissions are viewed. Among these gases is carbon dioxide, emitted up to 0.6 tonne per tonne of cement [3], this is equivalent to 5-7% of the global emission [4].
To reduce these numbers, producers and researchers, are constantly developing new techniques to reduce the amount of CO2 emitted by reducing clinker/cement or cement/concrete ratios. This reduction is achieved by improving the efficiency of rotary kilns, the incorporation of grinding enhancement additives and the development of hydraulic, pozzolanic and inert additions like ceramic waste for example.
In another register, water dams are invaded by sediments, about 75 billion tons of soil are eroded each year. This transport of sediment is carried out mainly by rivers. In Algeria, the 114 dams with a capacity of 5.3 billion m3, record an annual siltation rate of 32 million m3 [5]. This kinetic of siltation (fine sediment deposition) continues increasing because of the lithological soil nature, the intense and devastating rains, forest clearing, and overgrazing, etc.
To remedy these two environmental problems (siltation of dams and greenhouse gas emissions), some researches have been carried out on the use of dredged sludge in cementitious materials. Ben Allal et al. [6] replaced 20% of cement with untreated dredged sediments, they found a drop in the mortar strength because of the reactive silica deficit. Rodriguez et al. [7] reported the same finding where a fall of strength was observed at 20% substitution. Benkaddour et al. [8] have tried to awaken the pozzolanic character of the sludge when treated at 750℃ for 1 hour, but the compressive strength of mortars containing different percentages of treated sludge does not reach the control strength. In contrast, Abriak et al. [9] treated the dredged sediment at 750℃ for 2 hours, they observed an improvement of strength with a substitution of cement up to 10%.
In these few articles studied among others, we observed diverse results. This difference comes from upstream because after the erosion process the sludge is transported and deposited in the dam. Each source rock has its own mineralogical composition, we can find various types of phyllosilicates which leads to different percentages of chemical elements. Following this, each author chooses his own heat or mechanical treatment, etc.
X-ray fluorescence (XRF) data of cement samples were generated on Philips PW2404 XRF spectrometer. The loss of ignition was determined according to European standard EN 196-2 [10]. The X-ray diffractograms of different samples were recorded on PANalytical X’PertPro X-ray diffractometer. The X-rays wavelength used in this work was Cu Kα radiation with λ = 1.5405 Å. The data were collected for each sample over 2θ values ranging from 4° to 60°.
The thermogravimetric analysis (TGA) and the differential scanning calorimetry (DSC) have been recorded using Netzsch STA 449F1 machine. Tests were carried out from 20℃ up to 1,000℃ under nitrogen with a constant heat rate of 10℃/min.
The density of cement samples was determined using Le Chatelier flask. The fineness of cement was measured using air permeability method according EN 196-6 standard [11].
All types of concrete have a ratio W/C equal to 0.5, the specimens were made and preserved, according to EN 12390-2 standard [12].
The hydration reactions were stopped by immersing small samples of concrete in liquid nitrogen at a temperature of -50℃. To prevent the hydration reactions starting again when the samples are reheated to room temperature, water was removed by placing the frozen samples in a low-pressure chamber (500 Pa) and by continuously pumping to remove free water. After freeze-drying, the samples are in dry solid form. Consequently, further cement hydration cannot take place. The samples were, then, stored in a dry environment for additional analysis. The samples were then stored in a climatic chamber (at a temperature of 20 ± 2℃ and a relative humidity of 35 ± 2%) to prevent any humidity which could adversely affect our results.
To study water absorption of concrete, we adopted the ASTM C1585 [13] gravimetric method. First, the concrete samples were preconditioned at 60℃ for 48h, then cooled in desiccators for 24h. The samples are stored at 20 ± 2℃ before the start of the absorption test (on day 28). Two opposite faces have been left unsealed, the others were waterproofed with an adhesive plastic tape that forces the water to adopt a uni-axial path and avoid evaporation by these same faces. Before the introduction of the specimens into the water, their initial weights were recorded. For the measurement of the penetration height, one of the unsealed surfaces with a height of 3-5 mm of the sample was in contact with water (this level is monitored throughout the experiment). The mass of water absorbed was determined by successive weighing of samples.
The sludge was dredged from the K’sob dam, located at M’sila town. This dam recorded a siltation rate of 60%, the amount of deposited annually sludge is about 8×10⁵ m3. Natural dredged sludge (NDS) was taken from the discharge zone, then properly prepared, homogenized, dried at 80℃ and grinded separately with a laboratory ball mill. The mineralogical and chemical compositions of NDS are summarized in Table 1 and Table 2.
NDS is mainly composed from silica (40.66%) and calcium oxide (20.63%) and some minor oxides elements like MgO and SO3. The loss on ignition (LOI) of 21.71% indicates the presence of moisture and organic matter.
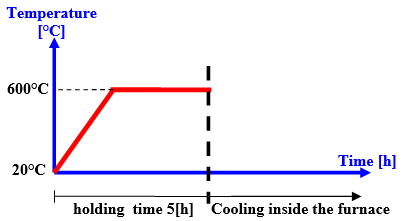
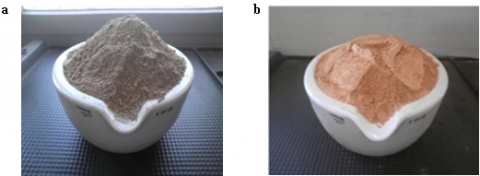
Before the elaboration of modified cements, NDS was subjected to heat treatment at 600℃ for 5 hours with a rise of 20℃/min (Figure 1) [14]. This treatment resulted in a color change from light green to a bright red color (Figure 2), a decrease in LOI from 21.71% to 16.72%, and an increase in silica, alumina and lime as shown in Table 2. The Blaine specific surface of treated dredged sludge (TDS) was 7,000 cm2/g.
The used CEMI 42.5 provided by the LafargeHolcim group established in M’sila – Algeria responds perfectly to chemical criteria of standard (Table 2), with a fineness of 3,510 cm2/g.
CEMI is substituted by TDS (by mass) at different percentages (5-10-20%). The new cements called modified cements (MC), as shown in Table 3. The chemical composition of these modified cements is represented in Table 4.
Table 1. Mineralogical composition of NDS
|
Minerals |
Percentage |
|
Quartz |
24 |
|
Calcite |
27 |
|
Ferruginous minerals |
04 |
|
Kaolin |
13 |
|
Illite/Muscovite |
22 |
|
Chlorite |
10 |
Table 2. Chemical composition [%] of CEMI, NDS and TDS
|
|
CEM I |
NDS |
TDS |
|
SiO2 |
20.86 |
40.66 |
42.89 |
|
Al2O3 |
4.71 |
8.91 |
9.61 |
|
Fe2O3 |
3.89 |
3.83 |
4.11 |
|
CaO |
63.29 |
20.63 |
22.24 |
|
MgO |
1.56 |
1.96 |
1.98 |
|
SO3 |
2.41 |
0.21 |
0.23 |
|
K2O |
0.53 |
1.12 |
1.22 |
|
Na2O |
0.18 |
0.46 |
0.53 |
|
LOI |
- |
21.71 |
16.72 |
|
Density |
3.03 |
2.63 |
2.60 |
Table 3. Different modified cements
|
Cements |
TDS |
CEMІ |
|
CEMI |
0% |
100% |
|
MC5 |
5% |
95% |
|
MC10 |
10% |
90% |
|
MC20 |
20% |
80% |
Table 4. Chemical and mineralogical composition of different cements
|
Chemical composition [%] |
||||
|
|
CEM I |
MC5 |
MC10 |
MC20 |
|
SiO2 |
20.86 |
20.98 |
21.11 |
21.45 |
|
Al2O3 |
4.71 |
4.95 |
5.15 |
5.40 |
|
Fe2O3 |
3.89 |
4.56 |
4.48 |
4.40 |
|
CaO |
63.29 |
62.42 |
62.07 |
61.89 |
|
MgO |
1.56 |
1.53 |
1.55 |
1.52 |
|
SO3 |
2.41 |
2.09 |
1.98 |
1.74 |
|
K2O |
0.53 |
0.55 |
0.56 |
0.58 |
|
Na2O |
0.18 |
0.15 |
0.16 |
0.18 |
|
FL |
1.28 |
1.18 |
1.15 |
1.06 |
|
LOI |
1.26 |
1.42 |
1.65 |
1.74 |
|
Fineness [cm²/g] |
3510 |
3614.5 |
3800 |
4183 |
Figure 1. Heat treatment protocol of the dredged sludge
Figure 2. (a) Natural sludge; (b) Treated sludge
Four concretes were made in this work: a reference one (Cr0) based on CEMI and three other concretes (Cr5, Cr10 and Cr20) based on the modified cements (MC5, MC10 and MC20) respectively. All variants were made without adjuvant and/or excessive vibration, the same amounts of water and aggregates were retained.
4.1 Physical measurements
4.1.1 Slump test
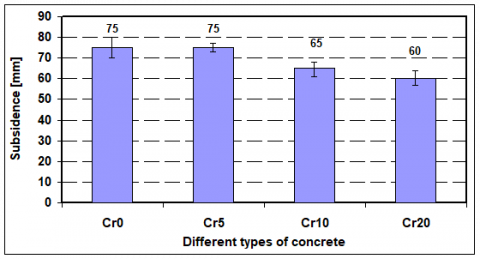
Figure 3, illustrates the subsidence of different concretes made from modified cements according to EN 12350-2 standard [15]. The reference concrete (Cr0), as well as the concrete (Cr5) recorded the same rate of subsidence with 75 [mm]. This value decreases with the introduction of TDS to reach 60 [mm] for the concrete Cr20.
This decrease is assigned to the presence of TDS in modified cement mixtures and its absorption potency, which deflect some water intended for cement hydration. This water does not participate in the fluidity, which affects the workability of concrete and hydration reactions.
In this test, all concretes have a plastic consistency with a subsidence between 50-100 [mm] according to the standard.
Figure 3. Subsidence of different concrete types
4.1.2 Density
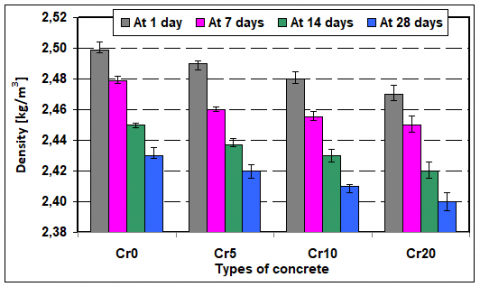
According to EN 12390-7 standard [16], the density values of different concretes are recorded in Figure 4. It was found that this characteristic decreases with curing time (1, 7, 14, 28 days), but it remains in a tight interval [2.4-2.5 kg/m3] which indicates a concrete with medium density. The (Cr0), registered a maximum value of 2.43 kg/m3 at 28 days, the lowest value recorded in the concrete with (MC) is attributed to (Cr20) with a density of 2.40 kg/m3 at 28 days, which means a decrease of only 2%.
This gradual decrease is due to the difference in specific density between cement CEMI [3.03 g/cm3] and the TDS [2.6 g/cm3]. As the substitution increases, the concrete density decreases.
Figure 4. The density of different concretes
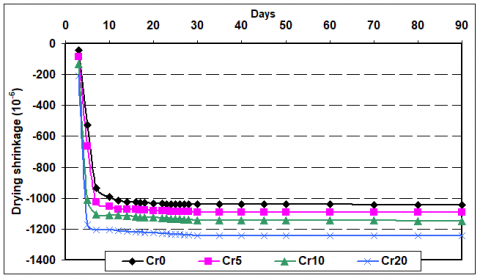
4.1.3 Shrinkage
In concrete structures, cracks can occur in the first hours. Figure 5, illustrates the follow-up of concrete shrinkage until 90 days according to NF P15-433 standard [17]. With the incorporation of TDS into the concrete cement matrix, the shrinkage at 90 days increased to 105% in the case of Cr5, 110% in the case of Cr10 and Cr20 records the greatest shrinkage compared to Cr0 with 119%.
This increase of shrinkage in modified cement concretes compared to CEMI one, is due to the reduction of cement paste, and also to the water-lack for cement hydration. These two factors slow-down the development of hydration reactions leading to increase shrinkage and porosity.
Figure 5. Drying shrinkage of different concretes
4.1.4 Capillary absorption
The pores in cementitious materials have various sizes and kinds. There are capillary pores with a diameter varies from 10μm to 10nm and gel pores (d <10nm). Capillary pores are responsible for the permeability of hardened concrete and are vulnerable to freeze-thaw cycles because water molecules can penetrate.
According to Figure 6, the increase in capillary absorption is observed up to 17th day in Cr0, up to 18th day in Cr5, up to 20 days in Cr10 and up to the 22nd day in Cr20, beyond these periods, the absorption stabilizes. This difference suggests a difference in speed of the capillary rise through the pores. Moreover, we note an increase of capillary absorption of concretes with the addition of TDS to more than 0.35 [g/cm2] for Cr5, 0.37 [g/cm2] for Cr10 and 0.40 [g/cm2] for Cr20. This difference in absorption clearly indicates a different capillary pore size.
Figure 6. Evaluation of capillary absorption according to curing days
The addition of TDS (which is finer than cement) separates the grains of cement between them, thus decreases cement hydration, leading to a larger pore size than that of Cr0. This remark is in agreement with other research findings [18, 19]. Moreover, during the study of thermal measurements, it can be observed in Figure 11 that the rate of produced portlandite (CH) in Cr5, Cr10 and Cr20 concretes, is lower than the reference concrete Cr0.
4.2 Mechanical measurements
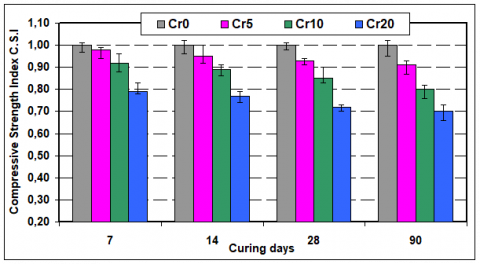
4.2.1 Compressive strength
The follow-up of the compressive strength index (C.S.I) of concretes for 90 days, is shown in Figure 7 according to EN 12390-3 standard [20]. This index represents the ratio between the strength of modified cement concrete (Cr5, Cr10, Cr20) and that of the reference concrete (Cr0). The values of (Cr0) compressive strengths are given in Table 5. It can be noted that the C.S.I of the various concretes increases with the curing period. In short-term (7 days), the best C.S.I is attributed to Cr5 with 0.98, and the weakest one is recorded for the Cr20 with 0.79. In long-term (90 days) the same observation is found with 0.91 of C.S.I for the Cr5, 0.80 for the Cr10 and 0.70 for the Cr20.
Table 5. Compressive strength of Cr0 concrete [Mpa]
|
At 7 days |
At 14 days |
At 28 days |
At 90 days |
|
32.68±0.65 |
37.77±1.13 |
41.1±0.62 |
46.47±1.63 |
At 7 days of hydration, the C.S.I of Cr5 and Cr10 are close to Cr0, because the fineness of MC5 and MC10 increase to 3,600 cm2/g and 3,800 cm2/g respectively. The TDS fine grains fill the gaps between particles of cement and try to develop a compact structure under the filler effect, like reported by Jaturapitakkul et al. [21] who found the filler effect is responsible for early age strength when fineness increases.
At long-term and because of water-lack diverted by the TDS to hydrate, the modified cement concretes are not completely compact, which leads to the decrease of C.S.I. The filler effect of TDS is remarkable in the short-term, but at long-term this effect diminishes to make way for other properties like the chemical or pozzolanic effects. Khan et al. [22] and Isaia et al. [23] also observed this remark. They specified a high rate of cement replacement by finer grains contributes to the strength decreases.
After 90 days, the CSI of the modified cement concretes are lower than the reference ones. At 600 °C heat treatment, only kaolin turns into metakaolin. This TDS does not develop a high pozzolanic character because of its low percentage of kaolin (only 13%) synonymous with a low-level of reactive silica and alumina. At the long term, the pozzolanic reaction does not take over from the filler effect due to the low percentage of kaolin. Nevertheless, the Cr5 and Cr10 concretes remain in contact with the Cr0 concrete in terms of compressive strength.
Figure 7. The compressive strength index (C.S.I) of concretes
4.2.2 Ultra pulse velocity
Another test can be established to appreciate the good quality of concrete and improve the reliability of destructive results according to EN 12504-4 standard [24]. The method consists in measuring the propagation speed of an ultrasonic pulse crossing the concrete.
It can be observed from Figure 8 that the curve of ultrasonic pulse velocity (UPV) is the same for all concretes; a rapid increase during the first 14th days, then a stabilization beyond 28 days.
During the aging of concrete, its structure becomes denser because of the hydration reaction development. In first days, the UPV increases rapidly because of the pores filling in Cr0 by hydration products and the change of voids/solid ratio. Modified cement concretes (Cr5, Cr10, Cr20) develop another characteristic in the first days to compensate the loss of hydrate production, it is the filler effect of TDS grains.
In the CEMI, the cement particles are close to each other, which facilitates hydration and reduces voids in a short time. In modified cements, the cement particles are more distant therefore, the hydration products must fill more pores which leads to a higher void/solid ratio.
Figure 8. Ultrasonic pulse velocity of concretes
4.3 Thermogravimetric analysis
When concrete is subjected to heat treatment, it undergoes chemical and mineralogical changes. Endothermic and exothermic peaks reflect these changes, they are produced by the loss or gain of mass (except the case of quartz which does not record any change of mass) (Figure 9).
The first changes are recorded by a water departure up to 300°C. This temperature range records different hydration products peaks: between 110-160℃ ettringite and CSH, between 175-190℃ hydrated calcium monocarboaluminate, between 230-240℃ hydrated calcium aluminate, and between 250-270℃ hydrated gehlenite [25, 26].
The second peak between 300-400℃, is assigned to the brucite Mg(OH)2. It illustrates the degradation of brucite to magnesium oxide, according to the reaction Mg(OH)2 → MgO + H2O.
The third peak is attributed to the dehydroxylation of portlandite (CH) between 450-550°C [27]. In Figure 8, it decomposes at 493℃ in free lime, according to the reaction Ca(OH)2 → CaO + H2O.
The fourth peak appears between 573-579℃, when there are siliceous aggregates in cementitious material. In our case it is the quartz grains transformation, according to the reaction αSiO2 → βSiO2 at 577℃, this peak does not record any change of mass.
The last peak represents the aggregates decomposition between 750-900℃ [28]. In our case (Figure 9) we record the decomposition of calcite at 875°C, accompanied by the emission of CO2 gas according to the reaction CaCO3 → CaO + CO2.
Figure 9. DSC/TG curve of Cr5 at 7 days
4.3.1 Non evaporable water of hydrates
It is known that CSH, CAH’s, Aft and Afm are in charge of strength and occupy the temperature range between 105℃ and 450℃. The cement to generate the products mentioned above retains the non-evaporable water (NEW). To determine the amount of NEW included in hydrates, we can use Eq. (1) [29]:
$NEW[\%]=[({{W}_{105{}^\circ C}}-{{W}_{450{}^\circ C}})/{{W}_{450{}^\circ C}}]\times 100$ (1)
W105°C, W450°C: The weight loss at 105℃, 450℃ respectively expressed as a percentage.
In Figure 10, we observe that the NEW values of Cr0 are superior to other concretes at any age. In addition, the NEW values decrease when the amount of TDS increases.
The replacement of cement by TDS induces a decrease of the hydration products, so a drop of strength, that is what is known as dilution effect. In addition, kaolin transformed into metakaolin, is the most reactive among the three clay minerals, but its percentage is insufficient to produce long-term pozzolanic reaction following its reaction with portlandite.
Figure 10. Quantity of non-evaporable water of hydrates (NEW)
4.3.2 Produced portlandite rate
Using the (TG) test, concrete samples used in compressive strength test were ground to determine the rate of produced portlandite Ca(OH)2. It is expressed by Eq. (2) [30]:
$\begin{align} & Ca{{(OH)}_{2}}=\frac{\frac{74{{D}_{{{m}_{1}}}}}{18}+\frac{74{{D}_{{{m}_{2}}}}}{44}}{{{P}_{m}}({{M}_{e}}+{{D}_{m}})}\quad \\ & [Gram\ of\ portlandite/Gram\ of\ cement] \\\end{align}$ (2)
Dm1: portlandite mass loss; Dm2: calcite mass loss; Dm: global mass loss between 20 and 1000℃; Me: sample weight; Pm: cement mass in the mixture [%]; 44: CO2 molar mass [g]; 18: H2O molar mass [g]; 74: Ca(OH)2 molar mass [g].
We notice from Figure 11 that the produced portlandite amount of CEMI is higher than that one of the modified cements at any age. For example, in 14 days of hydration, this quantity equals 0.11g per gram of cement in Cr0 concrete (110 mg of portlandite in 1 gram of hydrated cement), 0.09 in Cr5, 0.08 in Cr10 and 0.06 in Cr20. This rate decreases when TDS percentage increase, with a rapid evolution in the first 14 days.
Figure 11. Produced portlandite rate in concretes
During this work, we tried to find a way out to a dredged sludge by incorporating it into the cement matrix of ordinary concrete. Based on obtained experimental results, the following conclusions can be drawn:
Following these observations, we can say Cr5 is the closest concrete to Cr0 (CEMI concrete). However, in order of eliminating more sludge we can use the Cr10 concrete with admixtures.
[1] Aı̈tcin, P.C. (2000). Cements of yesterday and today: Concrete of tomorrow. Cement and Concrete research, 30(9): 1349-1359. https://doi.org/10.1016/S0008-8846(00)00365-3
[2] Cembureau Activity Report. (2018). The European Cement Association, Brussels, 48. Available at: https://cembureau.eu/media/sn3fohjd/actvity-report-2018.pdf, accessed on 17 December 2020.
[3] Stafford, F.N., Dias, A.C., Arroja, L., Labrincha, J.A., Hotza, D. (2016). Life cycle assessment of the production of Portland cement: A Southern Europe case study. Journal of Cleaner Production, 126: 159-165. http://dx.doi.org/10.1016/j.jclepro.2016.02.110
[4] Chen, C., Habert, G., Bouzidi, Y., Jullien, A. (2010). Environmental impact of cement production: detail of the different processes and cement plant variability evaluation. Journal of Cleaner Production, 18: 478-485. https://doi.org/10.1016/j.jclepro.2009.12.014
[5] Remini, W., Remini, B. (2003). La sédimentation dans les barrages de l’Afrique du nord. LARHYSS Journal, 2.
[6] Ben Allal, L., Ammari, M., Frar, I., Azmani, A., Belmokhtar, N. (2011). Characterization and valorisation of dredged harbours sediments from Tangier and Larache (Morocco). Revue Paralia, 4: 1-13. http://dx.doi.org/10.5150/revue-paralia.2011.005
[7] Rodríguez, O., Kacimi, L., López-Delgado, A., Frías, M., Guerrero, A. (2013). Characterization of Algerian reservoir sludges for use as active additions in cement: New pozzolans for eco-cement manufacture. Construction and Building Materials, 40: 275-279. http://dx.doi.org/10.1016/j.conbuildmat.2012.10.016
[8] Benkaddour, M., Aoual, F.K., Semcha, A. (2009). Durabilité des mortiers à base de pouzzolane naturelle et de pouzzolane artificielle. Nature & Technology, 1: 63.
[9] Abriak, N.E., Amar, M., Benzerzour, M. (2018). Formulation of mortars with marine sediments. International Journal of Civil and Environmental Engineering, 12(1): 36-41. http://dx.doi.org/10.5281/zenodo.1315559
[10] EN 196-2 Standard. (2013). Methods of Testing Cement, Part 2, Chemical Analysis of Cement. https://standards.iteh.ai/catalog/standards/cen/47283941-90a2-43dc-8b2c-dea6208712a6/en-196-2-2013, accessed on January 17, 2020.
[11] EN 196-6 Standard. (2012). Methods of Testing Cements, Part 6, Determination of Fineness. https://standards.iteh.ai/catalog/standards/cen/9feaed91-485e-4e0b-93c6-36357e1580ec/en-196-6-2012, accessed on January 17, 2020.
[12] EN 12390-2 Standard. (2012). Testing hardened concrete, Part 2, Making and curing specimens for strength tests. https://standards.iteh.ai/catalog/standards/cen/ae7e6a86-1cbc-455e-8b2a-8964be9087f9/en-12390-2-2019, accessed on February 12, 2020.
[13] ASTM C1585 (2004). Test method for measurement of rate of absorption of water by hydraulic-cement concretes. https://www.astm.org/Standards/C1585, accessed on February 23, 2020.
[14] Chikouche, M.A., Ghorbel, E., Bibi, M. (2016). The possibility of using dredging sludge in manufacturing cements: Optimization of heat treatment cycle and ratio replacement. Construction and Building Materials, 106: 330-341. http://dx.doi.org/10.1016/j.conbuildmat.2015.12.128
[15] EN 12350-2 Standard. (2012). Testing fresh concrete. Part 2. Slump test. https://standards.iteh.ai/catalog/standards/cen/cf0e0511-2176-454c-948d-9e515f3a03f1/en-12350-2-2019, accessed on February 12, 2020.
[16] EN 12390-7 Standard. (2012). Testing hardened concrete, Part 7, Density of hardened concrete. https://standards.iteh.ai/catalog/standards/cen/811a0cf3-55e3-495a-b06e-5c302d5f2806/en-12390-7-2012, accessed on February 12, 2020.
[17] NF P15-433 Standard. (1994). Methods of testing cement, Determination of shrinkage and swelling. https://www.boutique.afnor.org/standard/nf-p15-433/methods-of-testing-cement-determination-of-shrinkage-and-swelling/article/732473/fa029726, accessed on February 23, 2020.
[18] Tasdemir, C. (2003) Combined effects of mineral admixtures and curing conditions on the sorptivity coefficient of concrete. Cement and Concrete Research, 33(10): 1637-1642. http://dx.doi.org/10.1016/S0008-8846(03)00112-1
[19] Bozkurt, N., Yazicioglu, S. (2010). Strength and capillary water absorption of lightweight concrete under different curing conditions. Indian Journal of Engineering and Materials Sciences, 17: 145-151. http://hdl.handle.net/123456789/8618
[20] EN 12390-3 Standard (2012). Testing hardened concrete, Part 3, Compressive strength of test specimens.
[21] Jaturapitakkul, C., Tangpagasit, J., Songmue, S., Kiattikomol, K. (2011). Filler effect and pozzolanic reaction of ground palm oil fuel ash. Construction and Building Materials, 25: 4287-4293. http://dx.doi.org/10.1016/j.conbuildmat.2011.04.073
[22] Khan, M.N.N., Jamil, M., Karim, M.R., Zain, M.F.M., Kaish, A.B.M.A. (2017). Filler effect of pozzolanic materials on the strength and microstructure development of mortar. KSCE Journal of Civil Engineering, 21: 274-284. https://doi.org/10.1007/s12205-016-0737-5
[23] Isaia, G.C., Gastaldini, A.L.G., Morases, R. (2003). Physical and pozzolanic action of mineral additions on the mechanical strength of high performance concrete. Cement and Concrete Composites, 25(1): 69-76. http://dx.doi.org/10.1016/S0958-9465(01)00057-9
[24] EN 12504-4 Standard. (2005). Testing concrete, Part 4, Determination of ultrasonic pulse velocity. https://standards.iteh.ai/catalog/standards/cen/203a1a36-d5df-4f4c-9ab8-f6700e74e02c/en-12504-4-2004, accessed on February 12, 2020.
[25] Khoury, G.A. (1992). Compressive strength of concrete at high temperatures: A reassessment. Magazine of Concrete Research, 44(161): 291-309. https://doi.org/10.1680/macr.1992.44.161.291
[26] Sha, W., O’Neill, E.A., Guo, Z. (1999). Differential scanning calorimetry study of ordinary Portland cement. Cement and Concrete Composites, 29: 1487-1489. https://doi.org/10.1016/S0008-8846(99)00128-3
[27] Bhatty, J.I. (1991). A review of the application of thermal analysis to cement-admixture systems. Thermochimica Acta, 189(2): 313-350. https://doi.org/10.1016/0040-6031(91)87128-J
[28] Elkacemi, S., Abahlous, L., Ait-Amar, S., Boukbir, L., El-Alem, N. (2014). Heat treatment of concrete and its influence on the mechanical properties. MATEC Web of Conference, 11: 01011. https://doi.org/10.1051/matecconf/20141101011
[29] Bougara, A., Lynsdale, C., Milestone, N.B. (2010). Reactivity and performance of blastfurnace slags of differing origin. Cement and Concrete Composites, 32(4): 319-324. https://doi.org/10.1016/j.cemconcomp.2009.12.002
[30] Garcia-Diaz, E. (1995). Réactivité pouzzolanique des métakaolinites: corrélations avec les caractéristiques minéralo-gitologiques des kaolinites (Doctoral dissertation, Ecole Nationale Supérieure des Mines de Saint-Etienne). https://tel.archives-ouvertes.fr/tel-00843099/document, accessed on January 17, 2020.