Fenglin Meng | Danying Gao | Faqi Chen | Chunshui Huang*
© 2020 IIETA. This article is published by IIETA and is licensed under the CC BY 4.0 license (http://creativecommons.org/licenses/by/4.0/).
OPEN ACCESS
This paper aims to accurately measure the fatigue performance and calculate the fatigue life of fiber-reinforced asphalt concrete (FRAC). Firstly, splitting fatigue tests were conducted under the stress control mode. Through the tests, the attenuation features of the FRAC stiffness modulus were analyzed with different fiber contents and length-to-diameter ratios. Drawing on damage mechanics theory, a fatigue failure criterion was put forward for the FRAC. Based on stress ratio- fatigue life (S-N) equation, the authors established a calculation model for fatigue life of the FRAC, in the light of the characteristic parameter of fiber content (FCCP). The results show that, the FCCP can reflect the combined effect of fiber content and length-to-diameter ratio on the fatigue performance of the FRAC; With the growth of the FCCP, the FRAC fatigue life always increased first and then decreased; The FRAC realized the longest fatigue life, and achieved the best fatigue performance at the FCCP of 1.13; For AC-13 polyester FRAC (PFAC), the fiber content, length-to-diameter ratio, and the FCCP were optimized as 0.35%, 324, and 1.13, respectively. The research results provide new insights to the fatigue performance of the FRAC.
fiber-reinforced asphalt concrete (FRAC), fatigue performance, splitting fatigue test, characteristic parameter of fiber content (FCCP)
Fatigue failure is one of the main failure modes of asphalt concrete pavement. The fatigue performance of asphalt concrete has been mainly studied by phenomenological method, mechanical approximation, or damage mechanics method. Specifically, different models (e.g. viscoelastic model, damage mechanics model, and energy dissipation model) are established through fatigue test on actual pavement under real car load, fatigue test on full-scale pavement model under simulated car load, or small indoor fatigue test. These models characterize the fatigue performance of asphalt concrete, and help to disclose the effects of multiple factors (e.g. stress, frequency, temperature, and loading method on the fatigue performance of asphalt concrete [1-3].
With the growing popularity of fiber reinforced asphalt concrete (FRAC) in engineering [4-6], it is highly necessary to deeply explore the fatigue performance and fatigue damage mechanism of the FARC. Currently, most scholars rely on fatigue tests under stress or strain control mode to examine how fiber content, fiber type, and fiber length on the fatigue performance of the FRAC [7-15]. Despite the previous studies, there are still questions waiting to be answered: What are the effects of fatigue test methods and fatigue failure criteria on the fatigue life of the FRAC? How to unify the fatigue failure standards for the FRAC? How to measure the combined effect of fiber content and fiber length on the fatigue performance of the FRAC? How do soft fibers enhance the fatigue performance of the FRAC?
To answer these questions, this paper takes the fiber content Vf (the volume ratio of fiber to asphalt mixture) and length-to-diameter ratio Ra (the ratio of average fiber length to average fiber diameter) as the key parameters, carries out splitting fatigue tests on the FRAC under stress control mode, and then analyzes the attenuation law of the stiffness modulus of the FRAC. Drawing on damage mechanics theory, a fatigue failure criterion was put forward for the FRAC, which unifies the phenomenological method and damage mechanics method. Next, the effects of Vf and Ra on fatigue damage of the FRAC were examined systematically. On this basis, a calculation model was constructed for the fatigue life of the FRAC, in the light of the characteristic parameter of fiber content (FCCP).
The test materials include minerals produced in Zhengzhou, No. 70 road asphalt, and polyester fiber. The properties of polyester fiber are listed in Table 1.
The aggregate was sieved, cleaned, and dried, and then mixed with limestone powder, producing AC-13F mixtures with medium gradation. Next, standard Marshall tests [16] were conducted to identify the optimal asphalt contents (OACs) of ordinary asphalt mixture and fiber-reinforced asphalt mixture under different combinations of Vf and Ra (Table 2). To disclose the effects of Vf and Ra on the fatigue performance of the FRAC, Ra was set to 162, 486, and 649, while Vf was fixed at 0.35%, and Vf was set to 0.17%, 0.35%, 0.52%, and 0.69%, while Ra is 324.
Table 1. Properties of polyester fiber
|
Average length/mm |
Average diameter/μm |
Ra |
Density/(g·cm-3) |
Color |
Melting point/℃ |
Tensile strength/MPa |
|
3 |
18.5 |
162 |
1.38 |
White |
255-260 |
≥500 |
|
6 |
324 |
|||||
|
9 |
486 |
|||||
|
12 |
649 |
|
Mixture type |
Ra |
Vf /% |
OAC/% |
||
|
OACMin |
OACMax |
OAC |
|||
|
AC-13F |
0 |
0 |
4.75 |
5.58 |
5.32 |
|
PFAC-13F |
162 |
0.35 |
5.88 |
6.56 |
6.21 |
|
324 |
0.17 |
5.19 |
5.75 |
5.41 |
|
|
0.35 |
6.30 |
6.50 |
6.37 |
||
|
0.52 |
5.88 |
6.48 |
6.25 |
||
|
0.69 |
5.33 |
6.12 |
5.93 |
||
|
486 |
0.35 |
5.38 |
6.06 |
5.89 |
|
|
649 |
0.35 |
5.42 |
6.06 |
5.87 |
|
Under the OACs, the fiber-reinforced asphalt mixture was compacted and molded into FRAC specimens with a diameter of 101.6±0.25mm and a height of 63.5±1.3mm. The specimens were relocated to a fatigue testing machine for splitting fatigue tests at the temperature of 15℃ and the loading frequency of 10Hz. The fatigue tests adopt half-sine wave continuous loading and stress control mode. The split failure load was taken as the fatigue load under the same conditions. The stress ratio S was set to 20% and 40%. The vertical loads F corresponding to the peak of the sine wave were 4.20kN and 5.24kN.
During the tests, the total vertical deformation of each FRAC specimen under dynamic loading conditions was measured by a displacement sensor. Taking the peak load under dynamic loading as instantaneous static load, the total horizontal deformation XT and stiffness modulus Es of each FRAC specimen can be respectively calculated by [16]:
$X_{T}=\frac{Y_{T} \times(0.135+0.5 \mu)}{1.794-0.0314 \mu}$ (1)
$E_{S}=\frac{F \times 1000 \times(0.27+\mu)}{h \times X_{T}}$ (2)
where, YT is the total vertical deformation of the specimen corresponding to the peak load (mm); μ is Poisson’s ratio; h is specimen height (mm).
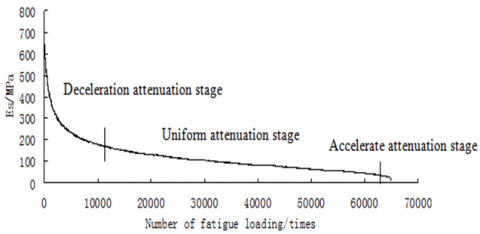
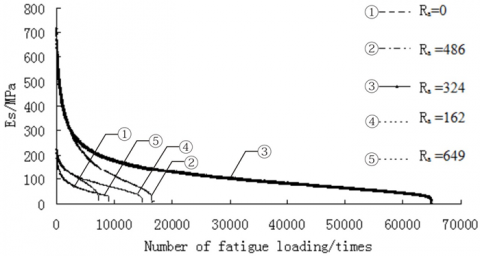
Figure 1 shows the relationship between stiffness modulus of the FRAC specimen and the load cycle, which is obtained through the splitting fatigue test at Vf=0.35% and Ra=324. During the loading process, the attenuation of stiffness modulus of the FRAC could be divided into three phases:
(1) The stiffness modulus attenuated at a decreasing rate in the first 12,000 load cycles.
The FRAC naturally has internal microdefects, due to its nonuniformity and inner voids. Under fatigue load, the specimen was compacted, and the stress concentrated at local defects. Because of the stress concentration, microcracks appeared in the FRAC, and gradually expanded into small local fatigue damages. As a result, the stiffness modulus of the FRAC continued to attenuate, but the attenuation rate gradually fell with the growth of load cycles: the decelerated attenuation phase, the constant attenuation phase, and the accelerated attenuation phase.
(2) The stiffness modulus attenuated at a constant rate between 12,000-th and 64,000-th load cycles.
The crack propagation releases and transfers the high-density energy accumulated in the local defects, reducing the phenomenon of stress concentration. Through accumulation and diffusion, the energy inside the FRAC specimen became relatively stable again. In this case, the stiffness modulus gradually decreased with the growth of load cycles. In each load cycle, the attenuation of the stiffness modulus tended to be stable. Overall, the stiffness modulus attenuated almost linearly with the growth of load cycle.
(3) The stiffness modulus attenuated at a growing rate after the 64,000-th load cycle.
In this phase, the internal energy gradually accumulated in the FRAC specimen. The microcracks gradually expanded until the penetration of the specimen. Due to the growing internal damage, the FRAC performance deteriorated rapidly; the stiffness modulus of the specimen attenuated at a growing rate until the specimen was completely cracked and suffered from buckling failure.
Figure 1. The relationship between stiffness modulus and load cycle (Vf=0.35% and Ra=324)
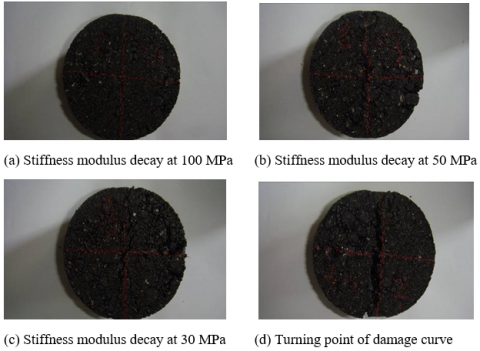
Figure 2 shows the typical failure modes of the FRAC specimens in different phases of stiffness modulus attenuation. During the splitting fatigue tests, when the stiffness modulus attenuated to 100MPa, there was no clearly visible cracks on any specimen, except for minor deformations in directly compressed areas; when the stiffness modulus attenuated to 50MPa, visible cracks appeared in most specimens; when the stiffness modulus attenuated to 30MPa, almost all specimens were about to be penetrated by wide cracks; with further loading, the cracks penetrated the specimens along the load center, and widened rapidly; meanwhile, the specimens became unstable due to fatigue, losing the bearing capacity.
Figure 2. Typical failure modes in different phases of stiffness modulus attenuation
From the angle of phenomenology, the critical point between crack penetration and buckling failure correspond to the inflection point between the constant attenuation phase and the accelerated attenuation phase.
During the fatigue process, the FRAC damage causes its stiffness modulus to attenuate. The attenuation could be measured by the amount of damage D [9, 17]. Here, the amount of damage D is defined as the ratio of FRAC stiffness modulus Esn at the n-th load cycle to the initial stiffness modulus Es0. Under stress control mode, the cumulative damage D of the FRAC in the splitting fatigue loading can be expressed as:
$D=1-\frac{E_{s n}}{E_{s 0}}$ (3)
According to Lemaitre damage theory [3], the damage $\Delta D$ in a single load cycle to the FRAC can be calculated by:
$\Delta D=1-\frac{E_{s(n+1)}}{E_{s n}}$ (4)
where, Es(n+1) is the FRAC stiffness modulus at the n+1-th load cycle.
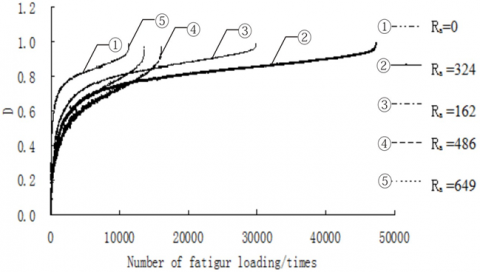
According to formulas (3) and (4), the stiffness moduli of the FRAC specimens were converted into the cumulative damages D and the single load cycle damages ΔD under Vf=0.35% and Ra=324. Then, the variations of D and ΔD with load cycles are displayed in Figure 3. With the growth of load cycles, the FRAC fatigue damage also evolved in three phases, as those of stiffness modulus attenuation.
(1) The fatigue damage worsened at a decreasing rate in the first 12,000 load cycles.
In this phase, with the growth of load cycles, the value of D increased at a decreasing rate, while the value of ΔD gradually decreased.
(2) The fatigue damage worsened at a constant rate between 12,000-th and 64,000-th load cycles.
In this phase, with the growth of load cycles, the value of D increased stably in an almost linear fashion, while the value of ΔD basically remained stable as a horizontal line.
(3) The fatigue damage worsened at an increasing rate after the 64,000-th load cycle.
In this phase, with the growth of load cycles, the value of D increased rapidly, while the value of ΔD deviated from the horizontal line and increased quickly. Meanwhile, the FRAC quickly cracked and suffered from buckling failure.
(a) Cumulative damage
(b) Single load damage
Figure 3. The variations of D and ΔD with load cycles
Table 3. Results on fatigue life of the FRAC
|
Type of mixture |
Ra |
Vf /% |
F/kN |
S/% |
Nf /times |
|
PFAC-13F |
0 |
0 |
3.84 |
20 |
11,027 |
|
4.20 |
22 |
9711 |
|||
|
5.24 |
27 |
3,134 |
|||
|
7.68 |
40 |
644 |
|||
|
162 |
0.35 |
2.82 |
20 |
29,698 |
|
|
4.20 |
30 |
12,621 |
|||
|
5.24 |
37 |
4,349 |
|||
|
5.64 |
40 |
4,090 |
|||
|
324 |
0.17 |
3.78 |
20 |
16,121 |
|
|
4.20 |
22 |
13,985 |
|||
|
5.24 |
28 |
5,783 |
|||
|
7.56 |
40 |
1,800 |
|||
|
0.35 |
4.37 |
20 |
46,440 |
||
|
4.20 |
19 |
64,264 |
|||
|
5.24 |
24 |
31,175 |
|||
|
8.74 |
40 |
6,870 |
|||
|
0.52 |
5.17 |
20 |
4,784 |
||
|
4.20 |
16 |
12,384 |
|||
|
5.24 |
21 |
4,317 |
|||
|
10.34 |
40 |
193 |
|||
|
0.69 |
5.39 |
20 |
2,811 |
||
|
4.20 |
16 |
10,058 |
|||
|
5.24 |
19 |
4,147 |
|||
|
10.78 |
40 |
118 |
|||
|
486 |
0.35 |
3.84 |
20 |
17,864 |
|
|
4.20 |
22 |
13,284 |
|||
|
5.24 |
27 |
6,697 |
|||
|
7.68 |
40 |
2,008 |
|||
|
649 |
0.35 |
2.76 |
20 |
13,304 |
|
|
4.20 |
30 |
6,742 |
|||
|
5.24 |
38 |
1,870 |
|||
|
5.52 |
40 |
1,719 |
To sum up, the splitting fatigue tests show a correspondence between the following items: the inflection point between the constant attenuation phase and the accelerated attenuation phase in the attenuation curve of the FRAC stiffness modulus; the critical point between crack penetration and buckling failure in terms of specimen failure mode; the inflection point between constant damage phase and accelerated damage phase in the cumulative damage curve; the inflection point between constant damage phase and accelerated damage phase of single cycle damage curve. Hence, this point is the critical point of fatigue damage of the FRAC specimens.
Here, the inflection point in the attenuation curve of the stiffness modulus is taken as the fatigue failure criterion of the FRAC, which unifies the phenomenological method and damage mechanics method for FRAC fatigue performance. It is suitable to take the load cycle corresponding to this point as the fatigue life of the FRAC.
As a result, the fatigue life Nf of the FRAC was defined as the load cycle corresponding to the inflection point between the constant attenuation phase and the accelerated attenuation phase in the attenuation curve of the FRAC stiffness modulus. The fatigue life of the FRAC was tested using polyester fibers with different Vf and Ra. The test results are listed in Table 3 below.
3.1 Influencing factors of FRAC fatigue damage
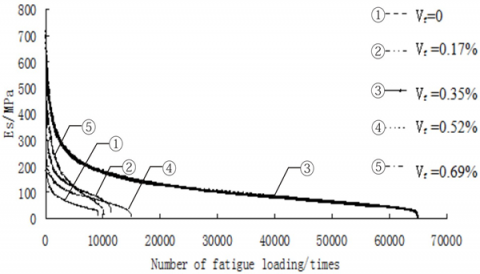
Figure 4 presents the attenuation curve of the FRAC stiffness modulus obtained through splitting fatigue tests. It can be seen that, under the same stress and fatigue load, the fatigue life of the FRAC first increased to the peak at Vf=0.35%, and then decreased, as the Vf continued to grow. The reason of this trend is as follows:
(a) S=20%, Ra=324
(b) F=4.20 kN, Ra=324
Figure 4. The attenuation curve of the FRAC stiffness modulus
The FRAC is a composite composed of asphalt, aggregate, and filler [9]. There are many inherent initial defects in the FRAC, owing to the nonuniformity and the inner voids of the FRAC, as well as the weak bonding interface formed by the aggregate crushed during specimen compaction. Under fatigue load, the stress concentrates in the initial defects, inducing microcracks in these places. The rapid propagation of these microcracks causes damages to the FRAC and suppresses its performance. With the accumulation of the damages, the cracks will eventually penetrate the FRAC, resulting in fatigue buckling failure.
The fibers added to the asphalt concrete form uniformly distributed three-dimensional (3D) grids [9-11], which improves the overall strength of the concrete. Meanwhile, the bridging effect of fiber grids effectively curbs the crack development in defected areas, and thus optimize the fatigue performance of the concrete.
How the fibers enhance the fatigue performance depends on Vf. Under a constant Ra and a suitable Vf, the fiber grids grew denser with the increase of Vf. The higher the Vf value, the stronger the ability of the fibers to prevent crack development, and the better the FRAC fatigue performance. If Vf is too large, however, the fiber grids will become so dense as to reduce the dispersibility of fibers. The undispersed fibers are likely to clump together. In the meantime, the fibers may aggregate in local areas, due to the excessively dense fiber grids. The clumping and aggregation are detrimental to the fatigue performance of concrete.
(a) S=20%, Ra =324
(b) F=4.20 kN, Ra =324
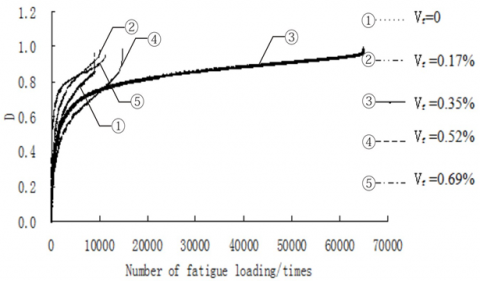
Figure 5. The variation of cumulative damage with load cycles at different Vf values
Figure 5 shows how the cumulative damage of the FRAC varied with load cycles at different Vf values. When Vf=0.35%, the FRAC cumulative damage curve was relatively flat, with a long period of constant damage. In this period, the fibers fully exerted their enhancement and crack resistance effects. Thus, the FRAC exhibited a good fatigue performance.
When the Vf value was too large, new defects were formed in the concrete, due to the clumping of undispersed fibers and the local aggregation of dense fiber girds. Under fatigue load, cracks appeared at the places of these new defects, and expanded rapidly. The crack propagation intensified the fatigue damage and performance deterioration of the concrete. Taking Vf=0.69% for example, the cumulative damage of the FRAC surged up, and the fatigue life of the FRAC was shorter than ordinary asphalt concrete.
Therefore, there must be an optimal fiber content for asphalt concrete, when Ra is kept constant. Under our test conditions, the optimal Vf is 0.35%.
Figure 6 presents the attenuation curves of FRAC stiffness modulus under fatigue load at different Ra values. Under the same fiber content, stress ratio, and fatigue load, the fatigue life of the FRAC first increased to the peak at Ra =324, and then decreased, with the continuous growth of Ra. The main reasons for the trend of fatigue life are as follows:
Under the same fiber content and fiber diameter, a small value of Ra means lots of fibers are contained in unit volume of asphalt concrete, and the fiber grids are extremely dense. The excess number of fibers tend to clump together, due to the reduction in dispersibility. Besides, a large length-to-diameter ratio means each fiber is long and soft, with poor directionality. Then, the curled fibers are easy to clump into a bundle, making fiber grids less dense. Hence, new defects will form in the FRAC, which intensify the fatigue damage and performance deterioration of the concrete.
(a) S=20%, Vf=0.35%
(b) F=4.20 kN, Vf=0.35%
Figure 6. The attenuation curves of FRAC stiffness modulus under fatigue load at different Ra values
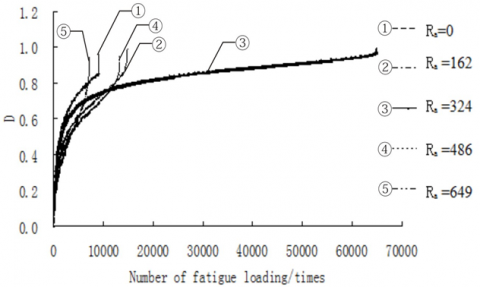
Figure 7 displays the FRAC fatigue damage curves at different Ra values. When Ra was 324, the FRAC cumulative damage curve was relatively gentle in the constant damage phase. Each load cycle had a limited damage on the FRAC, and the cumulative damage grew at a slow rate. Overall, the FRAC showed good resistance to fatigue damage.
When Ra was below 324, as the fiber content remained constant, new defects appeared inside the concrete, for some fibers became less dispersible and clumped together, and some fibers aggregated under the excess density of fiber grids. These new defects aggravated material damage, and reduced the FRAC fatigue performance.
Meanwhile, the excessively short fibers easily slipped and fail in the splitting process, hurting the enhancement effect of the fibers. For example, when Ra was 162 but the stress ratio was variable, the FRAC cumulative damage curve was relatively steep in the constant damage phase. In this phase, the cumulative damage increased rapidly, and the fatigue life of the concrete was relatively short. When Ra was greater than 324, the soft fibers tended to curl and clump together, due to the weakening directionality. The clumping reduces the density of fiber grids, and increases the defects of the concrete.
In addition, the fibers were easily broken when a single fiber was excessively long, which reduces the enhancement effect. For example, under the same fatigue load, the FRAC with Ra =649 had a relatively steep cumulative damage curve, i.e. the cumulative damage grew rather fast. In this case, the fatigue load of the FRAC was shorter than that of ordinary asphalt concrete.
Therefore, there must be an optimal length-to-diameter ratio for asphalt concrete, when fiber content is kept constant. Under our test conditions, the optimal Ra is 324.
(a) S=20%, Vf=0.35%
(b) F=4.20 kN, Vf=0.35%
Figure 7. The FRAC fatigue damage curves at different Ra values
Referring to the expression of splitting fatigue life of asphalt concrete [18], the fatigue life Nfof the FRAC under the stress control mode can be expressed as:
$N_{f}=k\left(\frac{1}{S}\right)^{n}$ (5)
where, n and k are two constants dependent on the composition and properties of the FRAC, respectively.
According to formula (5), double logarithmic regression was performed on the Nf and S values obtained from our tests, producing a linear functional relationship. Note that k and n are the intercept and slope of the straight line, respectively. The greater the k value, the better the FRAC fatigue performance; the greater the n value, the steeper the fatigue curve, and the more sensitive Nf is to the variation of S. The test results show that fiber content and length-to-diameter ratio had great impacts on the fatigue performance of asphalt concrete. Here, the FCCP λf=Vf×Ra is introduced to reflect the combined effect of fiber content and length-to-diameter ratio.
Under different fiber contents and length-to-diameter ratios, lgk always increased first and then decreased, and the n value always decreased first and then increased, with the growth of the FCCP. By nonlinear fitting of the test results, the correlations of lgk and n with the FCCP can be respectively expressed as:
$\lg k=1.26+2.1 \lambda_{f}-0.83 \lambda_{f}^{2}$ (6)
$n=4.11-1.84 \lambda_{f}+0.66 \lambda_{f}^{2}$ (7)
Substituting formulas (6) and (7) into formula (5), the FCCP-based calculation model for FRAC fatigue life can be established as:
$N_{f}=10^{\left(1.26+2.1 \lambda_{f}-0.83 \lambda_{f}^{2}\right)}\left(\frac{1}{S}\right)^{\left(4.11-1.84 \lambda_{f}+0.66 \lambda_{f}^{2}\right)}$ (8)
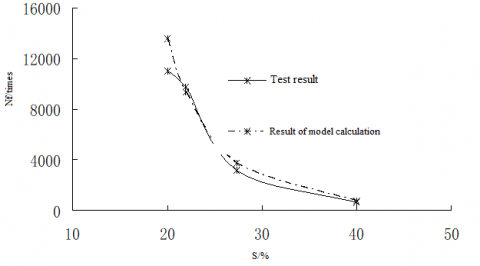
By formula (8), the fatigue lives of ordinary asphalt concrete (λf =0) and FRAC (λf =1.13: Vf = 0.35%; Ra=324) were obtained. The comparison in Figure 8 shows that the fatigue lives of the two concretes had good a correlation.
(a) λf =0
(b) λf =1.13
Figure 8. Comparison between ordinary asphalt concrete and FRAC in fatigue life
The relationship (Figure 9) between Nf and λf of FRAC at different stress ratios was also obtained by formula (8). Obviously, the FRAC fatigue lives at different stress ratios always increased first and then decreased with the growth in λf. When λf was 1.13, the FRAC had the longest fatigue life. At this moment, the FRAC boasts the best fatigue performance.
Figure 9. Relationship between Nf and λf of FRAC at different stress ratios
(1) There is a correspondence between the following items: the inflection point between the constant attenuation phase and the accelerated attenuation phase in the attenuation curve of the FRAC stiffness modulus; the critical point between crack penetration and buckling failure in terms of specimen failure mode; the inflection point between constant damage phase and accelerated damage phase in the cumulative damage curve; the inflection point between constant damage phase and accelerated damage phase of single cycle damage curve. It is suitable to take the load cycle corresponding to this point as the fatigue life of the FRAC.
(2) The fatigue life of the FRAC increased first and then decreased, with the growth in fiber content and length-to-diameter ratio. The FRAC exhibited relatively good fatigue performance at the fiber content of 0.35% and the length-to-diameter ratio of 324.
(3) Both fiber content and length-to-diameter ratio greatly affect the fatigue performance of the FRAC. Here, the FCCP is introduced to reflect the combined effect of the two factors. The FRAC fatigue life obtained by the FCCP-based calculation model agreed well with the test results. The FRAC boasts the best fatigue performance at the FCCP of 1.13.
This work was supported by Key Scientific Research Projects of Colleges and Universities in Henan Province (Grant No.: 20A580006) and the Horizontal Research Project of Xuchang University (Grant No.: 2019HX005).
[1] Alae, M., Zhao, Y., Zarei, S., Fu, G., Cao, D. (2020). Effects of layer interface conditions on top-down fatigue cracking of asphalt pavements. International Journal of Pavement Engineering, 21(3): 280-288. https://doi.org/10.1080/10298436.2018.1461870
[2] Zhu, H.Z., Gao, S., Tang, B.M. (2009). Fatigue properties of asphalt mixtures by controlled-strain testing. Journal of Huazhong University of Science and Technology (Urban Science Edition), 29(2): 5-8. https://doi.org/10.3969/j.issn.2095-0985.2009.02.002
[3] Lamothe, S., Perraton, D., Di Benedetto, H. (2020). Fatigue behaviour of dry or partially saturated hot mix asphalt (HMA). Fatigue & Fracture of Engineering Materials & Structures, 43(6): 1100-1114. https://doi.org/10.1111/ffe.13176
[4] Kocak, S., Kutay, M.E. (2020). Fatigue performance assessment of recycled tire rubber modified asphalt mixtures using viscoelastic continuum damage analysis and AASHTOWare pavement ME design. Construction and Building Materials, 248: 118658. https://doi.org/10.1016/j.conbuildmat.2020.118658
[5] Azarhoosh, A.R., Zojaji, Z., Moghadas Nejad, F. (2020). Nonlinear genetic-base models for prediction of fatigue life of modified asphalt mixtures by precipitated calcium carbonate. Road Materials and Pavement Design, 21(3): 850-866. https://doi.org/10.1080/14680629.2018.1513372
[6] Barra, B., Momm, L., Guerrero, Y., Bernucci, L. (2012). Fatigue behavior of dense asphalt mixes in dry and environmental-conditioning states. Construction and Building Materials, 29, 128-134. https://doi.org/10.1016/j.conbuildmat.2011.10.003
[7] Brovelli, C., Crispino, M., Pais, J.C., Pereira, P.A. (2014). Assessment of fatigue resistance of additivated asphalt concrete incorporating fibers and polymers. Journal of Materials in Civil Engineering, 26(3): 554-558. https://doi.org/10.1061/(ASCE)MT.1943-5533.0000837
[8] Badroodi, S.K., Keymanesh, M.R., Shafabakhsh, G. (2020). Experimental investigation of the fatigue phenomenon in nano silica-modified warm mix asphalt containing recycled asphalt considering self-healing behavior. Construction and Building Materials, 246(4): 794-797. https://doi.org/10.1016/j.conbuildmat.2019.117558
[9] Feng, J.L. (2006). Studies of performance and mechanism of fiber reinforced asphalt mixtures. Nanjing: Dongnan University, pp. U414.75 U416.217. https://doi.org/10.7666/d.y1040654
[10] Guo, N.S. (2007). Static and Dynamic Performance of Polyester Fiber Reinforced Asphalt Concrete. Dalian: Dalian Maritime University. https://doi.org/10.7666/d.y1037988
[11] Ye, Q.S.,Yue, H.B., Li, L., Li, Wu, S.P. (2007). Dynamic modulus and fatigue property of polyester fiber reinforced asphalt concrete. Journal of Wuhan University of Technology, 29(9): 5-8. https://doi.org/10.3963/j.issn.1671-4431.2007.09.002
[12] Ye, Q., Wu, S., Li, N. (2009). Investigation of the dynamic and fatigue properties of fiber-modified asphalt mixtures. International Journal of Fatigue, 31(10): 1598-1602. https://doi.org/ 10.1016/j.ijfatigue.2009.04.008
[13] Yang, X.W. (2007). Indoor test research on the road performance of different fiber asphalt mixture. Highway, (9): 188-194. https://doi.org/CNKI:SUN:GLGL.0.2007-09-044
[14] Tang, W., Sheng, X.J., Sun, L.J. (2008). Pavement performance of fiber reinforced asphalt mixture. Journal of Building Materials, 11(5): 612-615. https://doi.org/CNKI:SUN:JZCX.0.2008-05-022
[15] Xie, J. (2008). Influence of different fiber on the fatigue performance of SMA. Highway, (10): 214-217. https://doi.org/CNKI:SUN:ZNGL.0.2008-05-035
[16] Li, F.P., Li, C.M. (2011). Standard Test Methods of Bitumen and Bituminous Mixtures for Highway Engineering. People’s Communication Press, JTG E20-2011. ISBN: 978-7-114-09502-3.
[17] Gao, S. (2009). Analysis on fatigue damage of asphalt mixture based on normal stress test. Petroleum Asphalt, 23(1): 28-30. https://doi.org/CNKI:SUN:OILE.0.2009-01-017
[18] Sonsino, C.M. (2007). Course of SN-curves especially in the high-cycle fatigue regime with regard to component design and safety. International Journal of Fatigue, 29(12): 2246-2258. https://doi.org/10.1016/j.ijfatigue.2006.11.015