Xi Chen* | Erya Xia | Tao He
© 2020 IIETA. This article is published by IIETA and is licensed under the CC BY 4.0 license (http://creativecommons.org/licenses/by/4.0/).
OPEN ACCESS
This paper aims to disclose how the willingness to travel is affected by the risk perception and travellers‘ familiarity with the destination in a major epidemic. First, a questionnaire was prepared with the commonly used dimensions of traveller risk perception and verified through a preliminary survey. Then, a formal online questionnaire survey was carried out, receiving 860 valid questionnaires. The survey data were subject to analysis based on structural equation model (SEM). The results show that, under COVID-19, the traveller risk perception is negatively correlated with the willingness to travel, and the traveller familiarity with the destination regulated the negative correlation. It also unveils the traveller risk perception is enhanced by the number of changes of transport vehicles, the length of travel time, and the degree of epidemic impact on the destination, but suppressed by the risk tolerance of potential travellers. The main contribution of this research is to introduce risk perception of the particular situation of COVID-19. The research results enrich traveller decision-making mechanism and offer countermeasures to revitalise tourism industry after a major epidemic.
major epidemic, COVID-19, risk perception, traveller familiarity, willingness to travel
Ever since the year-end of 2019, the novel coronavirus pneumonia (COVID-19) has triggered an enormous impact on the world. In today's globalised environment, the spread of infectious diseases is much faster than ever before; industries that rely on population movement have become more sensitive and vulnerable [1]. China's data shows that the impact of COVID-19 epidemic on the Chinese tourism market is more significant than that of SARS. As of April 19, 2020, a total of 2,557 companies with 'travel agency' in their registered names had been cancelled.
In previous studies, scholars have given some analysis on the relationship between the risk perception of travellers and their willingness to travel, but there are still a few research blanks.
For example, first, few scholars have analysed the relationship between traveller risk perception and their willingness to travel in the context of significant epidemics. Second, it is not clear how destination familiarity affects the desire to travel. Third, no research has considered traveller risk perception from the perspectives of the complexity of the means of transportation during a journey or the travel time spent in tourism.
Starting from the relationships among traveller risk perception, willingness to travel, and destination familiarity, this paper attempts to explain people's law of travel by analysing their travel decision-making mechanism in the post-COVID-19 epidemic era. In the hopes of forming a countermeasure paradigm that could reduce tourism economic losses under the outbreak of a major epidemic, this paper provides practical suggestions for the overall recovery of the tourism economy. In the second part, this paper puts forward a theoretical model and several relationship hypotheses according to previous research results. It then conducts an empirical analysis based on the research conclusions. In the last part, it proposes specific suggestions and looks into future research.
2.1 Risk perception and willingness to travel
Travelling is a dynamic decision-making process, and the willingness to travel is a travel's desire to participate in certain travel activities [2]. According to the hypothesis of rational man, people's desire to travel depends on the comparison between the utility of travel and the corresponding cost. Travel risk is an essential part of travel cost, and it refers to the potential negative consequences of travel behaviour perceived by travellers [3], including the severity of consequences and the size of loopholes. Due to the uncertainty feature of tourism products [4], the risk perception of travellers plays a key role in their decision-making process [5].
Risk perception refers to an individual's judgment on the uncertain travel process and results [6]; it is the individual's ability to determine, describe and quantify risks. In terms of the research on the formation of risk perception, Slovic [7] believes that people's risk perception and degree of acceptance are rooted in their society and culture; the research of Fischhoff et al. [8] on the risk perception of nuclear energy supports the conclusion that the public decision-making is more perceptual than the government decision-making, and they believe that this is because public decision-making depends more on the perception of risks rather than objective risk measurement. In terms of the tourism research, Cater's [9] study on risk perception in expeditionary tourism supports similar conclusions, and he believes that although the impact of objective risk on the risk judgment process does exist, the role of subjective perception is more pronounced.
Therefore, the asymmetry between travel safety information and the subjective perception of travellers [4] determines that potential travellers are extremely sensitive to travel risks [10].
Discussions on people's risk perception and willingness to travel after major crises mainly focus on the impact of terrorist activities, and most of these studies are based on the consideration of safety requirements and the assessment of risks [11, 12].
Studies show that although a small number of people would choose areas under terrorist attacks to show their uncompromising stance against terrorism, for most people, their travel needs are likely to decrease as the perceived risks increase [13].
Based on this, hypothesis 1 is proposed as follows:
H1: Under major epidemics, the risk perception level of travellers has an impact on their willingness to travel, and the two have a negative correlation.
2.2 Destimation familarity and travel decision-making
The research on the influence of familiarity on consumption was initiated in the field of marketing. Familiarity is a process of information evaluation [14]. In terms of its essence, Manthiou et al. [15] believe that familiarity can alleviate people's anxiety, and anxiety is a prominent factor affecting their risk perception [16].
Familiarity with the destination is a travel's visual or psychological impression of the destination [17]. The role of familiarity in promoting consumption seems to be equally applicable in the tourism market. The more familiar the traveller is with the destination, the higher the willingness to travel [18], this is because the traveller can adjust the perceived risks based on the information they have acquired [19]. The measurement dimensions of destination familiarity include traveller's travel experience and information acquisition [17]. In terms of travel experience, the studies of Qu et al. [20] and Pearce [21] both show that potential tourists without travel experience in the destination place have higher risk perception and more safety concerns about the destination. In terms of information acquisition, personal past travel experience and information provided by family members or friends are the most significant sources of information [22]. However, destination familiarity is not enough to become an absolute driving force for travel decisions.
Based on this, hypothesis 2 is proposed as follows:
H2: Under major epidemics, potential travellers' familiarity with the destination plays a regulatory role between risk perception and willingness to travel. The more comprehensive the information the traveller has about the destination, the lower the impact of risk perception on the desire to travel.
2.3 Risk perception and transport factors
Travel means changes in the physical space of travellers; therefore, it is an important content in tourism products. In the past, the risks related to transport factors are usually regarded as equipment risks, meaning the risks caused by the failure of equipment or the traffic accidents happened during the journey [4, 23]. Major epidemics have added new factors to travel risks, due to the highly contagious and latent nature of the novel coronavirus, under normal circumstances, more contact person, longer contact time, and shorter contact distance mean a greater probability of infection.
Based on this, hypotheses 3 and 4 are proposed as follows:
H3: There is a positive correlation between the number of changes of transport vehicles on the route and the risk perception of travellers.
H4: There is a positive correlation between the length of travel time required on the route and the risk perception of travellers.
2.4 Risk perception and epidemic image of destination
The image of a travel destination is usually regarded as a key factor in the selection of travel destinations [24]. Some studies show that risk perception and risk types associated with the travel destination are usually integrated into the overall image of the destination [20]. Safety issues would affect the risk perception and travel decisions of travellers [25]; usually, they tend to avoid areas with higher risk perception [25] and replace destinations that seem unsafe [26]. Therefore, under epidemics, the real-time epidemic situation released by authoritative media has a great impact on travellers' decision-making, and potential travellers will pay special attention to areas with higher risks and try to avoid these places [27]. In the post-epidemic era, people's travel decisions will take into account the infection situation of the destination. This is because once a destination's epidemic image has formed, even if the epidemic subsides, people will not quickly accept new evidence that is contrary to the judgements that have already existed in their mind [28].
Based on this, hypothesis 5 is proposed as follows:
H5: Under a major epidemic, there is a positive correlation between a destination's epidemic image and people's risk perception..
2.5 Risk perception and traveller risk tolerance
Risk tolerance refers to people's psychological state of taking risks [29]; it is an important determinant of their attitudes and behaviours [30]. In special situations such as natural disasters, public health incidents, and terrorist attacks, risk tolerance has an important impact on travel decisions [30]. Under normal circumstances, the uncertainty brought about by risks will affect travellers' choice of destination and their travel behaviours. When the travel risk exceeds a threshold, they may try to control the risk by reducing the willingness to travel [31]. For the same risk, individuals have different perception paths [32], and the risk in one's eyes might be an adventure in the eyes of others [33]. For example, backpackers are willing to take risks avoided by others and travel to particular destinations [34]. It can be seen that the risk tolerance of potential travellers will directly affect their destination selections and travel decisions. Compared with people with higher risk tolerance, individuals with lower risk tolerance will experience greater insecurity and anxiety when travelling [35].
Based on this, hypothesis 6 is proposed as follows:
H6: After a major epidemic, the risk tolerance of travellers has a negative impact on their risk perception.
Based on above content, the theoretical model and relationship hypotheses proposed in this paper are shown in Figure 1.
Figure 1. Theoretical model and relationship hypotheses
This paper took the risk perception of potential travellers after the COVID-19 epidemic as the starting point of the research and selected a few potential tourists after 6 months since the onset of COVID-19 epidemic in China as the research objects.
3.1 Scale design
A self-compiled questionnaire was adopted as the measurement scale for the research, with the travel risk perception dimensions commonly used by scholars as to the framework [36, 37]. Through interviews with subjects, risk points that people mainly pay attention to when travelling after the COVID-19 epidemic were preliminarily determined, including economic risks, health risks, psychological risks, social risks, medical risks, and financial risks. Each risk point was reflected by 3-5 specific questions. The scale also used some of the content of the Psychological Tension Questionnaire compiled by Shi et al. [38] during the SARS period. The questionnaire adopted the Likert’s Scale for the measurement. In terms of risk perception, it ranged from 1(Very low risk) to 7(Very high risk); in terms of willingness to travel, it ranged from 1 (Unwilling to travel very much) to 5 (Willing to travel very much).
3.2 Data analysis
The pre-survey questionnaires were distributed online. The survey time was from May 15, 2020, to May 22, 2020. A total of 338 questionnaires were returned, including 278 valid questionnaires, with a recovery rate of 82.25%. On the whole, the sample data was consistent with the research. After that, SPSS 25.0 was used to test the reliability of the pre-survey questionnaires, and the results showed that the Cronbach's alpha value was 0.891, indicating high reliability of the results.
In addition, the questionnaire data were subject to the Exploratory Factor Analysis (EFA), and the KMO (Kaiser-Meyer-Olkin) value was obtained to be 0.863.
The formal survey also adopted the form of an online questionnaire, and the survey time was from May 27, 2020, to June 11, 2020. A total of 1160 questionnaires were returned, including 860 valid questionnaires, with a recovery rate of 74.14%.
The overall situation of the survey and the distribution of demographic indicators are as follows in Table 1.
Table 1. Frequency of variables
|
Variables |
|
Frequency |
Percent (Valid) |
|
Gender |
|
860 |
100% |
|
|
|
402 |
46.74% |
|
|
|
458 |
53.26% |
|
Age |
|
|
|
|
|
17 or younger |
86 |
10% |
|
|
18-25 |
209 |
26.30% |
|
|
26-30 |
243 |
28.26% |
|
|
31-40 |
156 |
18.14% |
|
|
41-50 |
110 |
12.79% |
|
|
51-60 |
48 |
5.58% |
|
|
61 or older |
8 |
0.93% |
|
Monthly income |
|
|
|
|
|
CNY 1,999 or less |
225 |
26.16% |
|
|
CNY 2,000-CNY 4, 999 |
324 |
37.67% |
|
|
CNY 5,000-CNY 9, 999 |
180 |
20.93% |
|
|
CNY 1,000-CNY 19, 999 |
99 |
11.51% |
|
|
CNY 2,000 or more |
32 |
3.72% |
In the sample data, the proportions of male and female respondents were relatively balanced, accounting for 46.74% and 53.26% respectively. The age group of the respondents mainly ranged from 18 to 50 years old, accounting for 93.49%, which was in line with the reality that people in this age group generally pay more attention to tourism activities. The sample data was suitable for this study.
SPSS25.0 and Amos26.0 were adopted for data analysis on the acquired data, and the applied methods included correlation analysis, regression analysis, and tests on the intermediary effects and regulatory variables.
For the convenience of research, 6 groups of independent variables and dependent variables were set as follows: the number of changes of transport vehicles/risk perception, length of travel time required on the route/risk perception, the epidemic image of destination/risk perception, risk tolerance/risk perception, risk perception/willingness to travel, and traveller familiarity/willingness to travel; and corresponding model numbers were 1-6 respectively.
4.1 Regression test
Table 2. Model summary
|
Model |
R |
R2 |
Adjusted R2 |
S.E. |
Durbin-Watson |
|
1 |
.970 |
0.94 |
0.94 |
0.314 |
0.114 |
|
2 |
.969 |
0.939 |
0.939 |
0.397 |
0.087 |
|
3 |
.969 |
0.939 |
0.939 |
0.455 |
0.194 |
|
4 |
.966 |
0.933 |
0.933 |
0.482 |
0.136 |
|
5 |
.981 |
0.963 |
0.963 |
0.294 |
0.075 |
|
6 |
.957 |
0.916 |
0.916 |
0.427 |
0.181 |
Table 3. Coefficient
|
Model |
|
Unstandardised coefficient |
Standardised coefficient |
t |
Significance |
|
|
B |
S.E. |
Beta |
||||
|
1 |
(constant) V1 |
0.601 |
0.034 |
0.97 |
17.942 |
0.000 |
|
0.246 |
0.003 |
82.911 20.026 |
0.000 |
|||
|
2 |
(constant) V3 |
0.768 |
0.038 |
0.969 |
81.35 |
0.000 |
|
0.097 |
0.001 |
13.617 |
0.000 |
|||
|
3 |
(constant) V5 |
0.575 |
0.042 |
0.969 |
80.969 |
0.000 |
|
0.927 |
0.011 |
14.784 |
0.000 |
|||
|
4 |
(constant) V7 |
0.764 |
0.052 |
0.966 |
77.247 |
0.000 |
|
0.959 |
0.012 |
-0.886 |
0.376 |
|||
|
5 |
(constant) V9 |
-0.027 |
0.03 |
0.981 |
105.146 |
0.000 |
|
0.716 |
0.007 |
6.78 |
0.000 |
|||
|
6 |
(constant) V11 |
0.324 |
0.048 |
0.957 |
68.229 |
0.000 |
|
0.685 |
0.01 |
|||||
From the Tables 2 and 3 above, we can know that The values of R2 indicate that the degree of fitting was very high, which means that the regression model can well explain the changes of the dependent variable Y; therefore, further regression model analysis could be conducted.
The regression model is as follows:
4.2 Structural modeling and testing
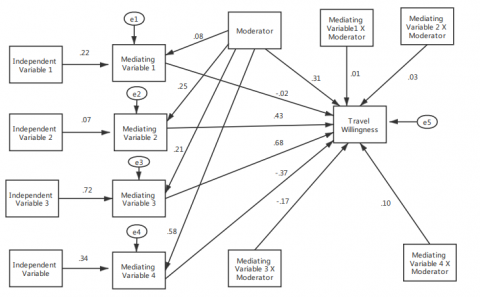
Based on the theoretical model, AMOS 26.0 software was adopted to construct the structural equation model, and the maximum likelihood estimation method was selected for the iteration of estimated parameters; the test results of action paths are shown in the figure below.
Independent variables 1-4 respectively represent the number of changes of transport vehicles on the route, the length of travel time required on the route, the epidemic image of the destination, and the risk tolerance; and the intermediate variable represents the risk perception affected by the above four factors. The theoretical model and relationship hypotheses proposed in this paper are shown in Figures 2 and 3.
The intermediary test needs to take into account the significance between the paths. Table 4 shows the estimation of the Unstandardised regression coefficients and their significance test results. From left to right, the values are the Unstandardised estimated value (namely the parts indicated by single arrows in the Unstandardised path model diagram), the standard error of estimated parameters, the critical ratio value (equivalent to the t value, when it is greater than 1.96, the significance level reaches 0.05), and the P-value, it can be seen from the P-value that each path was significant.
The intermediary test and the regulatory variable test need to take into account the significance of each path. Table 5 shows the estimation of the Unstandardised regression coefficients and their significance test. From left to right, the values are the estimated value, standard error, CR value and significance; it can be seen from the P-value that each path is significant.
Accroding to the Table 6 and Table 8 we can know that theThe estimated values of Standardised regression coefficients were all between -1 and 1, and there’s no error with the model; therefore, it has research value.
4.2.1 Test on intermediary effect
According to the test method of intermediary effect, AMOS21.0 and SEM were adopted for the research. With the number of changes of transport vehicles on the route, the length of travel time required on the route, the epidemic image of the destination, and the risk tolerance of potential traveller as independent variables, and the willingness to travel as the dependent variable, the intermediary effect of risk perception corresponding to different independent variables was tested. The path coefficient of the number of changes of transport vehicles on the route to the risk perception (β=0.97, p<0.001), the path coefficient of the length of travel time required on the route to the risk perception (β=0.97, p<0.001), the path coefficient of the epidemic image of destination to the risk perception (β=0.97, p<0.001), the path coefficient of the risk tolerance of potential traveller to the risk perception (β=0.97, p<0.001), were all significant.
The path coefficient of the risk perception corresponding to the number of changes of transport vehicles on the route to the willingness to travel (β=-0.14, p<0.001), the path coefficient of the risk perception corresponding to the length of travel time required on the route to the willingness to travel (β=0.80, p<0.001), the path coefficient of the risk perception corresponding to the epidemic image of destination to the willingness to travel (β=-0.14, p<0.001), and the path coefficient of the risk perception corresponding to the risk tolerance of potential traveller to the willingness to travel (β=0.48, p<0.001), were all significant. The test results of the percentile Bootstrap method for deviation correction are shown in Table 7.
To sum up, risk perception plays an intermediary role between the number of changes of transport vehicles on the route, the length of travel time required on the route, the epidemic image of the destination, the risk tolerance of potential traveller and the willingness to travel.
4.2.2 Test on the regulatory effect of traveller familiarity
This paper took the number of changes of transport vehicles on the route, the length of travel time required on the route, the epidemic image of the destination, and the risk tolerance of potential traveller as independent variables; while the willingness to travel as the dependent variable. The risk perceptions corresponding to different independent variables were taken as the intermediary variables to investigate whether the prediction of the interaction terms of risk perceptions corresponding to different independent variables and tourist familiarity on the willingness to travel is significant. Therefore, examine the regulatory effect of traveller familiarity in the intermediary model with the regulatory variable. The results showed that traveller familiarity has a significant regulatory effect on risk perceptions corresponding to different independent variables and the willingness to travel (β=0.03, p<0.001; β=0.14, p<0.001; β=-0.77, p<0.001; β =048, p<0.001).
Table 4. Regression weights: (Group number 1-Default model)
|
Estimate |
S.E. |
C.R. |
P |
Label |
|||
|
Risk perception 1 |
<--- |
Number of changes of transport vehicles on the route |
.245 |
.003 |
80.353 |
*** |
|
|
Risk perception 2 |
<--- |
The length of travel time required on the route |
.097 |
.001 |
81.445 |
*** |
|
|
Risk perception 3 |
<--- |
The epidemic image of destination |
.927 |
.011 |
81.063 |
*** |
|
|
Risk perception 4 |
<--- |
Risk tolerance of potential traveller |
.959 |
.012 |
77.337 |
*** |
|
|
Willingness to travel |
<--- |
Risk perception 1 |
-.155 |
.017 |
-9.256 |
*** |
|
|
Willingness to travel |
<--- |
Risk perception 2 |
.688 |
.013 |
52.394 |
*** |
|
|
Willingness to travel |
<--- |
Risk perception 3 |
-.104 |
.012 |
-9.049 |
*** |
|
|
Willingness to travel |
<--- |
Risk perception 4 |
.360 |
.011 |
31.702 |
*** |
Table 5. Regression weights: (Group number 1 - Default model)
|
Estimate |
S.E. |
C.R. |
P |
Label |
|||
|
Risk perception 1 |
<--- |
Number of changes of transport vehicles on the route back and forth |
.216 |
.003 |
73.272 |
*** |
|
|
Risk perception 2 |
<--- |
The length of travel time required on the route back and forth |
.067 |
.001 |
62.881 |
*** |
|
|
Risk perception 3 |
<--- |
The epidemic image of destination |
.719 |
.011 |
66.417 |
*** |
|
|
Risk perception 4 |
<--- |
Risk tolerance of potential traveller |
.338 |
.010 |
33.436 |
*** |
|
|
Risk perception 1 |
<--- |
Traveller familiarity |
.082 |
.007 |
11.510 |
*** |
|
|
Risk perception 2 |
<--- |
Traveller familiarity |
.251 |
.008 |
30.053 |
*** |
|
|
Risk perception 3 |
<--- |
Traveller familiarity |
.207 |
.010 |
20.469 |
*** |
|
|
Risk perception 4 |
<--- |
Traveller familiarity |
.584 |
.009 |
63.151 |
*** |
|
|
Willingness to travel |
<--- |
Risk perception 1 |
-.024 |
.014 |
-1.691 |
.091 |
|
|
Willingness to travel |
<--- |
Risk perception 2 |
.434 |
.014 |
30.719 |
*** |
|
|
Willingness to travel |
<--- |
Risk perception 3 |
.675 |
.011 |
60.775 |
*** |
|
|
Willingness to travel |
<--- |
Risk perception 4 |
-.372 |
.022 |
-17.298 |
*** |
|
|
Willingness to travel |
<--- |
Traveller familiarity |
.305 |
.015 |
19.769 |
*** |
|
|
Willingness to travel |
<--- |
Risk 1×Familiarity |
.008 |
.001 |
6.342 |
*** |
|
|
Willingness to travel |
<--- |
Risk 2×Familiarity |
.034 |
.001 |
29.728 |
*** |
|
|
Willingness to travel |
<--- |
Risk 3×Familiarity |
-.174 |
.001 |
-167.857 |
*** |
|
|
Willingness to travel |
<--- |
Risk 4×Familiarity |
.100 |
.001 |
104.227 |
*** |
Table 6. Standardised regression weights: (Group number 1 - Default model)
|
<--- |
Estimate |
E.968 |
|
|
Risk perception 1 Risk perception 2 |
<--- <--- |
Number of changes of transport vehicles on the route back and forth The length of travel time required on the route back and forth |
.968 .969 |
|
Risk perception 3 |
<--- |
The epidemic image of destination |
.969 |
|
Risk perception 4 |
<--- |
Risk tolerance of potential traveller |
.966 |
|
Willingness to travel |
<--- |
Risk perception 1 |
-.140 |
|
Willingness to travel |
<--- |
Risk perception 2 |
.795 |
|
Willingness to travel |
<--- |
Risk perception 3 |
-.137 |
|
Willingness to travel |
<--- |
Risk perception 4 |
.481 |
Table 7. Bootstrap effect of intermediary paths
|
Intermediary paths |
Estimated value of intermediary effect point |
Bootstrap interval of intermediary effect |
Significance (p) |
|
|
Lower limit |
Upper limit |
|||
|
The number of changes of transport vehicles on the route à Risk perception à Willingness to travel |
0.770 |
0.660 |
0.844 |
0.004 |
|
The length of travel time required on the route à Risk perceptionà Willingness to travel |
-0.136 |
-0.215 |
-0.053 |
0.001 |
|
Epidemic image of destination à Risk perceptionà Willingness to travel |
-0.133 |
-0.231 |
-0.025 |
0.020 |
|
Risk tolerance of potential traveller à Risk perceptionà Willingness to travel |
0.464 |
0.331 |
0.606 |
0.001 |
Table 8. Test on the regulatory effect of traveller familiarity
|
|
Standardised regression coefficient |
SE |
P |
|
Willingness to travel ß Risk perception corresponding to the number of changes of transport vehicles on the route × Traveller familiarity |
0.03 |
0.001 |
<0.001 |
|
Willingness to travel ß Risk perception corresponding to the length of travel time required on the route × Traveller familiarity |
0.14 |
0.001 |
<0.001 |
|
Willingness to travelß Risk perception corresponding to the epidemic image of destination × Traveller familiarity |
0.48 |
0.001 |
<0.001 |
|
Willingness to travelß Risk tolerance of potential traveller × Traveller familiarity |
-0.77 |
0.001 |
<0.001 |
5.1 Findings
This study adopted the empirical method to analyse the influence mechanism of the risk perception of travellers on their willingness to travel under the COVID-19 epidemic. In the context of major public health events, this research supports the conclusion drawn by Sonmez and Grafe [13] that risk perception plays a key role in travel decision-making.
The results showed that the greater the number of changes of transport vehicles, the longer the travel time required, the deeper the image of the destination affected by the epidemic, the lower the risk tolerance of potential travellers, the higher the risk perception level of people, the lower their willingness to travel. This study confirmed that in a major epidemic, individuals’ familiarity with travel destinations could reduce the negative impact of risk perception on the willingness to travel.
5.2 Contributions
The broad impact range of COVID-19 epidemic and its massive impact on the economy are rare in history. Based on previous studies, this paper discussed the decision-making mechanism of travel willingness under the COVID-19 epidemic and expanded the related theories.
The innovations of this study are: first, it took transport factors as independent variables that affect people's risk perception, providing a new entry point for observing people's travel decisions under major public health events. In previous studies, although some scholars paid attention to the risk of transport factors, they mainly interpreted it as a dimension of risk perception. In this study, the number of changes of transport vehicles and the travel time required was taken as variables to represent the risk of transport factors, which can be better understood by people under major public health incidents. Second, the paper emphasised the regulatory effect of traveller's familiarity with the destination between risk perception and travel decisions, which provided theoretical support for revitalising tourism industry in the post-epidemic era.
5.3 Enlightments
In order to deal with the tourism industry crisis caused by COVID-19 epidemic, this paper proposes the following countermeasures:
First, flexibly design tourism products according to people's travel preferences during the epidemic. Considering that in the post-epidemic era, shorter travel time and fewer transport vehicles can improve people's willingness to travel, it is suggested that the related department should further develop short-distance and self-driving tourism products. In addition, most people are unwilling to either travel to areas that are deeply affected by the epidemic or change their inherent views; therefore, it is suggested that the designed tourism products should avoid areas that are deeply affected by the epidemic as much as possible. However, after the epidemic is over, the anti-epidemic image of the destination may become a good point for tourism promotion.
Second, considering the highly infectious feature of COVID-19 and there are asymptomatic carriers, it suggests to maintain public health safety management systems by the relevant regulations of the World Health Organisation and the country in the post-epidemic era. This is because communication and management of risks can reduce the impact of the disease on the economy to a certain extent [5].
Finally, relevant departments should encourage people to share their travel experiences on social media to increase potential travellers' familiarity with the destination[39]. Potential travellers usually use a variety of information sources to assist their travel decisions [40]. The information people share on social networks will affect the return expectation of individuals, and the travel recommendations given by friends and family members are far more effective than advertisements [41].
5.4 Future research
Risks arise in social and cultural progress [42]. In social science research, people usually understand risks through "social constructivist approaches" [5]. Therefore, in the future, it is necessary to observe further the travel decision-making mechanism of people under different cultural backgrounds based on this research.
The contributions of the three authors are equal in this paper.
[1] Kim, H., Schroeder, A., Pennington-Gray, L. (2016). Does culture influence risk perceptions? Tourism Review International, 20(1): 11-28. https://doi.org/10.3727/154427216X14581596798942
[2] Kozak, M. (2001). Repeaters' behavior at two distinct destinations. Annals of Tourism Research, 28(3): 784-807. https://doi.org/10.1016/S0160-7383(00)00078-5
[3] Chen, N., Qiao, G.H., Liu, L. (2009) Tourism association studies risk perception and outbound tourists travel preferences-tourists in Beijing. Geography, 6: 97-102.
[4] Tsaur, SH., Tzeng, G.H., Wang, K.C. (1997). Evaluating tourist risks from fuzzy perspectives. Annals of Tourism Research, 24(4): 796-812. https://doi.org/10.1016/S0160-7383(97)00059-5
[5] Smith, R. (2006). Responding to global infectious disease outbreaks: Lessons from SARS on the role of risk perception, communication and management. Social Science & Medicine, 63(12): 3113-3123. https://doi.org/10.1016/j.socscimed.2006.08.004
[6] Liu, J., Gao, J. (2008). Based tourism risk perception conceptual model—A case study of Shanghai residents. Tourism Science, 22(5): 37-43.
[7] Slovic, P. (1987). Perception of risk. Science, 236(4799): 280-285. https://doi.org/10.1126/science.3563507
[8] Fischhoff, B., Slovic, P., Lichtenstein, S. (1983). The ‘‘public’’ vs. the ‘‘experts’’: Perceived vs. actual disagreement about the risks of nuclear power. In V. Covello, G. Flamm, J. Rodericks, & R. Tardiff (Eds.), Analysis of Actual vs. Perceived Risks, 1: 235-249. https://doi.org/10.1007/978-1-4613-3760-7_16
[9] Cater, C.I. (2006). Playing with risk? participant perceptions of risk and management implications in adventure tourism. Tourism Management, 27(2): 317-325. https://doi.org/10.1016/j.tourman.2004.10.005
[10] Cui, F., Liu, Y., Chang, Y., Duan, J., Li, J. (2016). An overview of tourism risk perception. Natural Hazards, 82(1): 643-658. https://doi.org/10.1007/s11069-016-2208-1
[11] Money, R.B., Crotts, J.C. (2003). The effect of uncertainty avoidance on information search, planning, and purchases of international travel vacations. Tourism Management, 24(2): 191-202. https://doi.org/10.1016/S0261-5177(02)00057-2
[12] Beirman, D. (2003). Restoring tourism destinations in crisis: A strategic marketing approach. Tourism Management, 26(3): 475-476.
[13] Sonmez, S.F., Graefe, A.R. (1998). Determining future travel behavior from past travel experience and perceptions of risk and safety. Journal of Travel Research, 37(2): 171-177. https://doi.org/10.1177/004728759803700209
[14] Maestro, R.M.H., Gallego, P.A.M., Requejo, L.S. (2007). The moderating role of familiarity in rural tourism in Spain. Tourism Management, 28(4): 951-964. https://doi.org/10.1016/j.tourman.2006.08.009
[15] Manthiou, A., Kang, J., Chiang, L. (2016). Investigating the effects of memorable experiences: An extended model of script theory. Journal of Travel & Tourism Marketing, 33(3): 362-379. https://doi.org/10.1080/10548408.2015.1064055
[16] Breakwell, G.M. (2014). The psychology of risk (2nd ed.), Cambridge, United Kingdom: Cambridge University Press.
[17] Milman, A., Pizam, A. (1995). The role of awareness and familiarity with a destination: The central Florida case. Journal of Travel Research, 33(3): 21-27.
[18] Chen, C., Lin, Y. (2012). Segmenting mainland chinese tourists to Taiwan by destination familiarity: A factor‐cluster approach. International Journal of Tourism Research, 14(4): 339-352. https://doi.org/10.1002/jtr.864
[19] Wong, J., Yeh, C. (2009). Tourist hesitation in destination decision making. Annals of Tourism Research, 36(1): 6-23. https://doi.org/10.1016/j.annals.2008.09.005
[20] Qu, H., Kim, L.H., Im, H.H. (2011). A model of destination branding: Integrating the concepts of the branding and destination image. Tourism Management, 32(3): 465-476. https://doi.org/10.1016/j.tourman.2010.03.014
[21] Pearce, P.L. (1993). Fundamentals of tourism motivation.In D. Pearce & R. Butler (Eds.), Tourism research: Critiquesand Challenges, 85-105. London: Routledge and Kegan Paul.
[22] Loda, M.D. (2003). The communicative effect of message presentation and sequencing on tourist destination selection (Published doctoral dissertation). Clemson University, Clemson, SC.
[23] Jog, D., Mekoth, N. (2019). Risk perception and tourist types: A study among international tourists. International Journal of Tourism and Hospitality Management in the Digital Age (IJTHMDA), 3(2): 22-43. https://doi.org/10.4018/IJTHMDA.2019070102
[24] Beerli, A., Martin, J.D. (2004). Factors influencing destination image. Annals of Tourism Research, 31(3): 657-681. https://doi.org/10.1016/j.annals.2004.01.010
[25] Adeloye, D., Brown, L. (2018). Terrorism and domestic tourist risk perceptions. Journal of Tourism and Cultural Change, 16(3): 217-233. https://doi.org/10.1080/14766825.2017.1304399
[26] Baker, D.M. (2014). The effects if terrorism on the travel and tourism industry. International Journal of Religious Tourism and Pilgrimage, 2(1): 58-67. https://doi.org/10.21427/D7VX3D
[27] Pickles, H., Goodwin, R. (2006). Pandemic flu: En-couraging a positive population response. EUROHEALTH-LONDON-, 12(1): 10-12.
[28] Spitzer, M.L. (1980). Human Inference: Strtgs and Shortcomxgs of Social Judgment (Prentice-Hall, Englewood Cliffs, NJ, 1980).
[29] Hallahan, T., Faff, R.W., Mckenzie, M. (2004). An empirical investigation of personal financial risk tolerance. Financial Services Review, 13(1): 57-78.
[30] Williams, A.M., Balaž, V. (2013). Tourism, risk tolerance and competences: Travel Organisation and tourism hazards. Tourism Management, 35: 209-221. https://doi.org/10.1016/j.tourman.2012.07.006
[31] Lepp, A., Gibson, H. (2003). Tourist roles, perceived risk and international tourism. Annals of Tourism Research, 30(3): 606-624. https://doi.org/10.1016/S0160-7383(03)00024-0
[32] Reisinger, Y., Mavondo, F. (2006). Cultural differences in travel risk perception. Journal of Travel &Tourism Marketing, 20(1): 13-31. https://doi.org/10.1300/J073v20n01_02
[33] Seabra, C., Dolnicar, S., Abrantes, J.L., Kastenholz, E. (2013). Heterogeneity in risk and safety perceptions of international tourists. Tourism Management, 36(1): 502-510. https://doi.org/10.1016/j.tourman.2012.09.008
[34] Elsrud, T. (2001). Risk creation in traveling: Backpacker adventure narration. Annals of Tourism Research, 28(3): 597-617. https://doi.org/10.1016/S0160-7383(00)00061-X
[35] Reisinger, Y., Crotts, J.C. (2009). The influence of gender on travel risk perceptions, safety, and travel intentions. Tourism Analysis, 14(6): 793-807. https://doi.org/10.3727/108354210X12645141401269
[36] Cheron, E.J., Ritchie, J.B. (1982). Leisure activities and perceived risk. Journal of Lsure Research, 14(2): 139-154. https://doi.org/10.1080/00222216.1982.11969511
[37] Roehl, W.S., Fesenmaier, D.R. (1992). Risk perceptions and pleasure travel: An exploratory analysis. Journal of Travel Research, 30(4): 17-26. https://doi.org/10.1177/004728759203000403
[38] Shi, K., Fan, H.X., Li, W.D., Jia, J.M., Song, Z.L., Gao, J., Chen, X.F., Lu, J.F., Hu, W.P. (2003). The risk perceptions of sars and socio-psychological behaviors of urban people in China. ACTA PSYCHOLOGICA SINICA, 35(4): 546-554.
[39] Wang, J., Liulastres, B., Ritchie, B.W., Pan, D. (2019). Risk reduction and adventure tourism safety: An extension of the risk perception attitude framework (RPAF). Tourism Management, 74: 247-257. https://doi.org/10.1016/j.tourman.2019.03.012
[40] Chung, N., Koo, C. (2015). The use of social media in travel information search. Telematics and Informatics, 32(2): 215-229. https://doi.org/10.1016/j.tele.2014.08.005
[41] Casaló, L.V., Flavián, C., Guinalíu, M. (2011). Understanding the intention to follow the advice obtained in an online travel community. Computers in Human Behavior, 27(2): 622-633. https://doi.org/10.1016/j.chb.2010.04.013
[42] Washer, P. (2006). Representations of mad cow disease. Social Science & Medicine, 62(2): 457-466. https://doi.org/10.1016/j.socscimed.2005.06.001