Tapsatit Gooncokkord | Kittisak Makkawan* | Worachot Sribua
© 2026 The authors. This article is published by IIETA and is licensed under the CC BY 4.0 license (http://creativecommons.org/licenses/by/4.0/).
OPEN ACCESS
The aviation industry plays a vital role in economic development and global connectivity but is also a significant source of greenhouse gas emissions. As the industry moves toward low-carbon and net-zero aviation, understanding passenger acceptance of clean energy technologies is increasingly important for supporting SDG 7 (Affordable and Clean Energy) and SDG 13 (Climate Action). This study examines the factors influencing passengers’ acceptance and intention to support clean energy technologies adopted by Thai airlines. The research framework integrates the Technology Acceptance Model (TAM), Theory of Planned Behavior (TPB), and Unified Theory of Acceptance and Use of Technology (UTAUT). Six constructs were examined: Perceived Usefulness (PU), Perceived Ease of Use (PEOU), Attitude (ATT), Subjective Norms (SN), Facilitating Conditions (FC), and Acceptance and Intention to Support (AI). Data were collected from 400 airline passengers in Thailand using a structured questionnaire and analyzed using Partial Least Squares Structural Equation Modeling (PLS-SEM). The findings indicate that ATT was the strongest predictor of passenger acceptance and intention to support (β = 0.363, p < 0.001), followed by PU (β = 0.212, p < 0.001), SN (β = 0.202, p < 0.001), and PEOU (β = 0.098, p = 0.029). FC did not have a statistically significant direct effect (β = 0.091, p = 0.063). Overall, four of the five hypotheses were supported, and the model explained 76.0% of the variance in passenger acceptance and intention to support (R² = 0.760). The findings highlight the importance of positive passenger attitudes, perceived benefits, social influence, and ease of adoption in supporting clean energy technologies in Thai aviation. The study provides practical implications for airlines, policymakers, and aviation stakeholders in strengthening passenger support for sustainable aviation and facilitating the transition toward low-carbon air transport, contributing to SDG 7 and SDG 13.
clean energy technology, sustainable aviation, passenger acceptance, Technology Acceptance Model, Structural Equation Modeling, SDG 7, SDG 13
The aviation industry plays a critical role in economic development, tourism, international trade, and global connectivity. However, aviation is also a significant source of greenhouse gas emissions, particularly carbon dioxide (CO₂), contributing to climate change and increasing pressure on the industry to transition toward more sustainable forms of air transportation [1]. As a result, reducing aviation-related emissions has become an important priority for international aviation organizations, governments, and airlines. The International Civil Aviation Organization (ICAO) has established a long-term global aspirational goal of achieving net-zero carbon emissions from international aviation by 2050 [2]. This objective is also consistent with the broader sustainability agenda of the United Nations, particularly SDG 7 (Affordable and Clean Energy) and SDG 13 (Climate Action) [3].
Clean energy technologies have emerged as important pathways for reducing the environmental impacts of aviation. These technologies include Sustainable Aviation Fuel (SAF), electric aircraft, hydrogen-powered aircraft, and other renewable energy solutions [4]. Among these alternatives, SAF has received considerable attention because it can potentially reduce lifecycle greenhouse gas emissions while being compatible with existing aircraft and aviation infrastructure. In Thailand, the transition toward cleaner aviation has increasingly attracted the attention of policymakers, airlines, energy producers, and other aviation stakeholders. Initiatives related to SAF production and the use of SAF blends in commercial aviation demonstrate growing efforts to support the transition toward lower-carbon air transportation [5].
However, technological development and investment alone cannot guarantee the successful adoption of clean energy technologies in aviation. Passenger acceptance is an important demand-side factor because passengers may influence airlines’ market decisions through their travel preferences, willingness to support sustainable practices, and intention to choose airlines that demonstrate environmental responsibility [6]. Even when clean energy technologies are technically feasible, their broader implementation may be constrained if passengers perceive them as providing limited benefits, creating inconvenience, or failing to meet their expectations regarding safety, service quality, and travel experience. Understanding the factors that shape passenger acceptance is therefore essential for supporting the transition toward sustainable aviation [7].
Previous studies have identified several factors that influence technology acceptance and behavioral intention. The Technology Acceptance Model (TAM) emphasizes the importance of Perceived Usefulness (PU) and Perceived Ease of Use (PEOU) in explaining users’ acceptance of technology. The Theory of Planned Behavior (TPB) highlights the roles of attitude and Subjective Norms (SN) in shaping behavioral intention [8]. In addition, the Unified Theory of Acceptance and Use of Technology (UTAUT) identifies Facilitating Conditions (FC) as an important factor associated with technology adoption. These theoretical perspectives provide complementary explanations of how technological perceptions, individual evaluations, social influences, and enabling conditions may affect passenger acceptance of clean energy technologies [9].
Although research on sustainable aviation and environmentally responsible consumer behavior has expanded considerably, empirical evidence concerning passenger acceptance of clean energy technologies remains relatively limited in developing-country contexts. In particular, there is a lack of empirical research examining Thai airline passengers’ acceptance and intention to support clean energy technologies [10]. Furthermore, relatively few studies have integrated TAM, TPB, and UTAUT to provide a comprehensive explanation of passenger acceptance within the context of clean energy adoption in aviation. Addressing this gap is important because passenger perceptions and behavioral intentions may differ across national and institutional contexts [11].
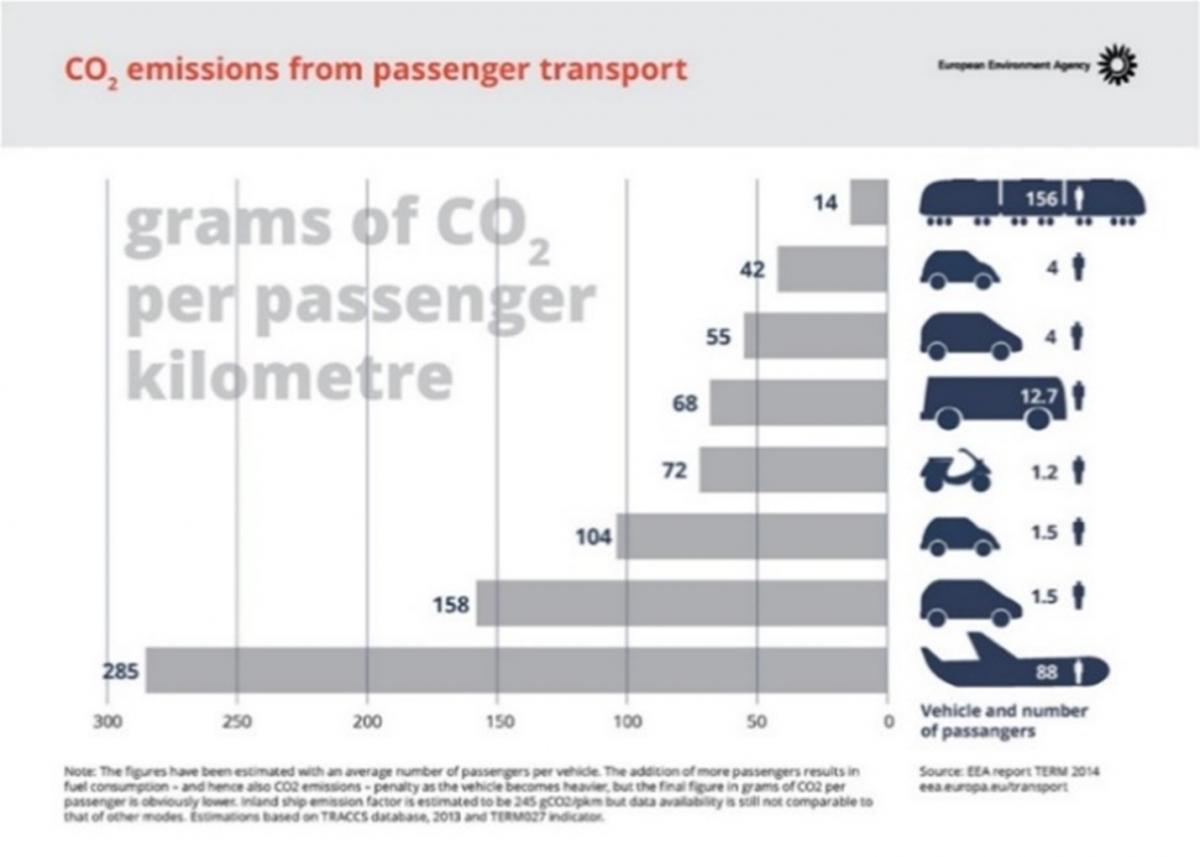
Figure 1. Comparison of CO₂ emissions per passenger among different transportation modes over a distance of one kilometer
As shown in Figure 1, CO₂ emissions per passenger vary considerably across different transportation modes, highlighting the environmental implications of transportation choices and the importance of promoting cleaner and more sustainable transportation technologies.
Therefore, this study develops an integrated conceptual framework based on TAM, TPB, and UTAUT to examine the factors influencing passenger Acceptance and Intention to Use (AI) clean energy technologies in Thai airlines. Specifically, the study examines five factors: PU, PEOU, Attitude (ATT), SN, and FC. The study also examines AI as the outcome variable [12]. By examining these relationships, the study seeks to provide empirical evidence that can contribute to a better understanding of passenger support for sustainable aviation and inform airlines, policymakers, and other aviation stakeholders in promoting the adoption of clean energy technologies and advancing SDG 7 and SDG 13 [13, 14].
The objectives of this study are:
1) To investigate the effects of PU, PEOU, ATT, SN, and FC on passengers’ AI clean energy technologies adopted by airlines in Thailand.
2) To assess the level of passengers’ acceptance and intention to support the implementation of clean energy technologies in the Thai aviation industry and their contribution to sustainable aviation in support of SDG 7 and SDG 13.
3.1 Clean energy technology and sustainable aviation
The aviation industry plays a critical role in global connectivity and economic development, but it is also an important source of greenhouse gas emissions [15]. Consequently, the transition toward more sustainable aviation has become a major priority for airlines, governments, and international aviation organizations. Clean energy technologies, including Sustainable SAF, electric aircraft, hydrogen-powered aircraft, and renewable energy systems, have been identified as important technological pathways for reducing the environmental impacts of aviation [16]. The development and implementation of such technologies are also closely associated with the achievement of SDG 7 and SDG 13.
Although technological development is essential for sustainable aviation, successful implementation also depends on the acceptance and behavioral intentions of passengers [17]. Passengers are not necessarily directly involved in the technical operation of clean energy technologies; however, their perceptions of environmental benefits, usefulness, convenience, and the sustainability practices of airlines can influence their willingness to support airlines adopting such technologies. Previous research has demonstrated that consumers tend to show stronger support for environmentally responsible products and services when they perceive clear environmental and functional benefits [18]. Similarly, research on green initiatives in aviation suggests that passengers’ knowledge, attitudes, and perceptions toward environmental practices are relevant to their willingness to support sustainable aviation initiatives.
Therefore, understanding passenger acceptance requires an integrated perspective that considers technological perceptions, individual attitudes, social influences, and the conditions that facilitate adoption [19]. To address these dimensions, the present study integrates constructs derived from the TAM, the TPB, and the UTAUT.
3.2 Theoretical foundations: Technology Acceptance Model, Theory of Planned Behavior, and Unified Theory of Acceptance and Use of Technology
The TAM developed by Davis [18] is one of the most widely used theoretical frameworks for explaining individuals’ acceptance of technology. TAM proposes that users’ technology acceptance is primarily determined by PU and PEOU [19, 20]. PU refers to the extent to which an individual believes that using a particular technology will provide meaningful benefits, whereas PEOU reflects the extent to which the technology is perceived as requiring little effort. These two constructs have been consistently applied to explain technology adoption across different contexts. Overall, perceptions of usefulness and ease of use remain important determinants of users’ acceptance and behavioral intentions.
The TPB provides a complementary behavioral perspective. It suggests that behavioral intention is influenced by attitude, Subjective Norm (SN), and perceived behavioral control [21]. Attitude represents an individual’s favorable or unfavorable evaluation of a behavior, while SN reflects perceived social pressure from important individuals or groups. TPB has been widely applied to explain environmentally responsible behaviors, including green consumption, renewable energy adoption, and sustainable transportation choices. In the context of sustainable aviation, these dimensions are particularly relevant because passengers’ decisions to support airlines adopting clean energy technologies may depend not only on technological benefits but also on their personal environmental attitudes and perceived expectations from others [22].
The UTAUT extends technology acceptance research by incorporating technological, social, and organizational conditions. Among its major constructs, FC refers to the extent to which individuals perceive that the necessary resources, infrastructure, and organizational support are available for technology use [23]. Although UTAUT was originally developed in the information technology context, its underlying logic can be applied to emerging sustainable technologies where adoption depends partly on technological availability, infrastructure readiness, institutional support, and enabling policies [24].
Accordingly, the present study combines the complementary strengths of TAM, TPB, and UTAUT. TAM contributes PU and PEOU; TPB contributes ATT and SN; and UTAUT contributes FC. Together, these constructs provide a multidimensional framework for explaining passengers’ AI clean energy technologies in the airline industry. This theoretical integration is consistent with the framework presented in the study, which examines technological, psychological, social, and facilitating factors simultaneously [25].
3.3 Perceived Usefulness and Acceptance and Intention to Use
PU refers to the extent to which individuals believe that a technology provides meaningful benefits or improves the outcomes associated with its use [26]. Within the context of clean energy technologies in aviation, PU can be understood as passengers’ perceptions that technologies such as SAF, electric aircraft, or hydrogen-powered aircraft can generate environmental and operational benefits. These benefits may include reductions in greenhouse gas emissions, improved environmental performance, and contributions to sustainable aviation.
The importance of PU is particularly evident when consumers evaluate environmentally oriented innovations. Innovations perceived to provide clear relative advantages are more likely to be adopted [27]. Perceived benefits are also important in explaining environmentally responsible consumption behavior. In the aviation sector, passengers may not possess detailed technical knowledge regarding clean energy technologies, but they can evaluate whether such technologies appear beneficial for environmental protection and the future sustainability of aviation. Previous research has also indicated that environmental and corporate social responsibility initiatives can influence customer responses toward airlines [28]. Therefore, when passengers perceive clean energy technologies as useful for reducing environmental impacts and improving the sustainability of aviation, they are expected to demonstrate stronger acceptance and intention to support airlines adopting such technologies. Based on TAM and previous empirical evidence, the following hypothesis is proposed:
H1: PU positively influences AI clean energy technologies.
3.4 Perceived Ease of Use and Acceptance and Intention to Use
PEOU refers to the extent to which individuals perceive that a technology can be used or implemented without requiring substantial effort. In the context of aviation, this construct is particularly relevant because passengers generally expect technological innovations to maintain or improve convenience, comfort, safety, and service quality. Although clean energy technologies may involve sophisticated technical systems, passengers primarily evaluate their implications from the perspective of the travel experience [29].
Venkatesh and Davis [30] emphasized that technologies perceived as easier to use are more likely to generate favorable acceptance and behavioral intentions. From the passenger perspective, the adoption of clean energy technologies should not create additional inconvenience in processes such as booking, check-in, boarding, or the provision of in-flight services. If passengers perceive that the transition toward cleaner aviation can occur without negatively affecting their travel experience, their resistance to technological change may be reduced [31].
Previous research on technology acceptance has consistently identified ease of use as an important factor influencing users’ behavioral responses. Accordingly, passengers who perceive clean energy technologies as practical, convenient, and compatible with their travel experience are expected to exhibit stronger acceptance and intention to support airlines implementing such technologies [32].
Thus, the following hypothesis is proposed:
H2: PEOU positively influences AI clean energy technologies.
3.5 Attitude and Acceptance and Intention to Use
ATT refers to an individual’s favorable or unfavorable evaluation of a particular behavior or object. Within TPB, ATT is a fundamental determinant of behavioral intention because individuals who evaluate a behavior positively are more likely to intend to perform or support that behavior. In sustainable aviation, ATT reflects passengers’ overall evaluations of airlines adopting environmentally responsible and clean energy technologies [33].
Positive attitudes toward environmental sustainability can encourage consumers to support green products, services, and organizational practices. Attitude is an important factor in explaining green consumption behavior. Environmental responsibility is also relevant to customer responses in the airline context. More specifically, passengers’ knowledge and attitudes toward green initiatives in aviation are important, as favorable passenger perceptions can contribute to stronger support for sustainable aviation practices [34]. Clean energy technologies are closely associated with environmental responsibility and climate action. When passengers believe that such technologies can reduce greenhouse gas emissions and contribute to a more sustainable aviation system, they are likely to develop more favorable evaluations toward airlines adopting them. Consequently, a positive ATT should increase passengers’ willingness to support, choose, and recommend airlines that implement such technologies [35].
Therefore, the following hypothesis is proposed:
H3: ATT positively influences AI.
3.6 Subjective Norms and Acceptance and Intention to Use
SN represents an individual’s perception of whether important people or social groups expect them to engage in a particular behavior. In the context of sustainable aviation, SN reflects the influence of family members, friends, colleagues, and wider society on passengers’ willingness to support airlines adopting clean energy technologies.
Environmental behavior is not determined solely by individual preferences. Social expectations and perceptions of what constitutes responsible behavior can also shape behavioral intentions. Social norms are relevant to environmentally responsible consumption and underscore the importance of social and psychological factors in explaining green purchase intentions through the TPB framework [36]. The role of SN may be particularly important for sustainable aviation because environmental responsibility has increasingly become a socially recognized expectation. Passengers may perceive supporting environmentally responsible airlines as socially desirable, particularly when sustainability issues are communicated through public campaigns, social media, and organizational communication. In addition, recommendations and opinions from people within passengers’ social networks may strengthen their willingness to choose or support airlines adopting clean energy technologies [37].
Consistent with TPB and UTAUT, social influence is therefore expected to contribute positively to passenger acceptance and behavioral intention. Accordingly, the following hypothesis is proposed:
H4: SN positively influences AI clean energy technologies.
3.7 Facilitating Conditions and Acceptance and Intention to Use
FC refers to the extent to which individuals believe that the necessary resources, infrastructure, technical support, and institutional arrangements are available to enable the adoption or use of a technology [38]. In sustainable aviation, FC encompasses the availability of appropriate infrastructure, technological readiness, institutional support, and government policies that enable airlines to implement clean energy technologies.
Unlike conventional consumer technologies that can often be adopted directly by individual users, clean energy technologies in aviation require substantial organizational and infrastructural support. The implementation of SAF, electric aircraft, hydrogen-powered aircraft, and related renewable energy systems depends on technological infrastructure, regulatory frameworks, investment, supply chains, and institutional coordination. Consequently, passengers’ perceptions of whether the aviation system is sufficiently prepared to implement such technologies may influence their confidence and willingness to support their adoption [39].
UTAUT identifies FC as an important component of technology adoption because users are more likely to accept technologies when they perceive that adequate resources and support are available. In the aviation context, visible evidence of infrastructure readiness, government support, and airline commitment may therefore reduce uncertainty and increase passengers’ confidence in clean energy technologies [40].
Accordingly, passengers who perceive strong FC are expected to demonstrate greater acceptance and intention to support airlines adopting clean energy technologies. Therefore, the following hypothesis is proposed:
H5: FC positively influences AI clean energy technologies.
3.8 Acceptance and Intention to Use clean energy technologies
AI represents passengers’ willingness to support, choose, and recommend airlines that utilize clean energy technologies. Behavioral intention is a central outcome in both technology acceptance and behavioral theories [41]. TAM emphasizes the role of users’ perceptions of technological benefits and ease of use in shaping acceptance, while TPB explains intention through ATT and SN. UTAUT further emphasizes the importance of social influence and FC in technology-related behavior.
In sustainable aviation, acceptance extends beyond direct use of a particular technology because passengers may not directly operate or interact with technologies such as SAF or hydrogen propulsion. Instead, acceptance can be expressed through willingness to support airlines implementing clean energy technologies, preference for airlines adopting environmentally responsible practices, and willingness to recommend such airlines. This perspective is appropriate for examining passenger responses to technological transitions that are primarily implemented by airline operators rather than individual consumers [42].
The literature therefore suggests that passenger acceptance of clean energy technologies is a multidimensional outcome influenced by technological perceptions, individual attitudes, social expectations, and enabling conditions. Integrating these perspectives provides a more comprehensive explanation of passenger behavioral intentions toward sustainable aviation [43].
3.9 Research framework and hypotheses development
Based on the reviewed literature, the present study integrates TAM, TPB, and UTAUT to explain passenger AI clean energy technologies in Thai airlines. The framework includes PU and PEOU from TAM, ATT and SN from TPB, and FC from UTAUT. The dependent construct is AI.
The integration of these theories is appropriate because passenger acceptance of clean energy technologies is unlikely to be explained by a single theoretical perspective. Technological perceptions capture the expected benefits and convenience of clean energy technologies, while ATT and SN represent psychological and social determinants of behavioral intention. FC complements these factors by addressing the infrastructure and institutional environment required for successful implementation. The resulting framework therefore provides an integrated explanation of passenger acceptance of clean energy technologies within the Thai aviation context. The proposed conceptual framework and the relationships among the study constructs are presented in Figure 2.
Figure 2. Conceptual framework
3.10 Research hypotheses
H1: PU has a significant positive effect on AI.
H2: PEOU has a significant positive effect on AI.
H3: ATT has a significant positive effect on AI.
H4: SN has a significant positive effect on AI.
H5: FC has a significant positive effect on AI.
4.1 Research design
This study employed a quantitative, cross-sectional research design to investigate the factors influencing passengers’ AI clean energy technologies adopted by airlines in Thailand. The research framework integrated three theoretical perspectives: the TAM, the TPB, and the UTAUT. TAM emphasizes PU and PEOU as key determinants of technology acceptance [30, 44]. TPB explains behavioral intention through ATT, SN, and perceived behavioral control [45], while UTAUT identifies FC as an important factor influencing technology use [46].
The proposed model consisted of five independent variables, namely PU, PEOU, ATT, SN, and FC, and one dependent variable, AI. The selection of these constructs is also supported by previous research on technology acceptance, environmental behavior, sustainable innovation, and the adoption of sustainable aviation technologies [47-50]. Structural Equation Modeling (SEM) was employed to examine the relationships among the constructs.
4.2 Population and sampling
The target population consisted of airline passengers in Thailand who had previous experience traveling by commercial airlines. Since the exact population size could not be determined, the sample size was determined based on recommendations for SEM, which indicate that sample sizes of approximately 200–400 respondents can be adequate for model estimation, depending on model complexity and analytical requirements [51]. Accordingly, the study obtained 400 valid responses using a convenience sampling technique. The sample size was considered adequate for conducting Confirmatory Factor Analysis (CFA) and SEM [51].
4.3 Data collection
Data were collected using a structured questionnaire distributed through Google Forms between January and March 2026. Participation was voluntary, and respondents were required to confirm that they had previous experience traveling by commercial airlines before completing the questionnaire. The questionnaire consisted of three sections: demographic information, measurement items concerning passenger acceptance of clean energy technologies, and additional comments or suggestions. Only responses from eligible participants were included in the analysis.
4.4 Measurement of variables
The measurement instrument was developed based on TAM, TPB, UTAUT, and previous studies related to technology acceptance, sustainable transportation, environmental behavior, and sustainable aviation technologies. PU and PEOU were based on established TAM research [30, 44]. ATT and SN were derived from the theoretical foundations of TPB [45], while FC was incorporated based on UTAUT [46].
Six latent constructs were measured. PU represented passengers’ perceptions that clean energy technologies provide environmental and operational benefits, while PEOU represented perceptions that such technologies can be implemented without reducing travel convenience. ATT represented passengers’ positive or negative evaluations of adopting clean energy technologies in aviation. SN represented perceived social influences from family members, friends, colleagues, and society. FC represented perceptions of the availability of infrastructure, policies, resources, and institutional support. AI represented passengers’ willingness to support, choose, and recommend airlines utilizing clean energy technologies.
The measurement of acceptance of sustainable aviation technologies was further informed by previous research examining passenger acceptance of SAF and environmentally oriented innovations [47, 48]. Previous studies have also demonstrated the importance of environmental concerns, innovation-related perceptions, and consumer responses in understanding the adoption of sustainable technologies [49, 50]. All measurement items were assessed using a five-point Likert scale, ranging from 1 = Strongly Disagree to 5 = Strongly Agree.
4.5 Data analysis
The collected data were analyzed using SmartPLS 4.1.1.8. Descriptive statistics, including frequency, percentage, mean, and standard deviation, were used to summarize the respondents’ demographic characteristics and the distribution of the study variables.
The measurement model was assessed using Partial Least Squares Structural Equation Modeling (PLS-SEM) to evaluate indicator reliability, internal consistency reliability, convergent validity, and discriminant validity [51]. Specifically, indicator loadings, Cronbach’s alpha, composite reliability (CR), and average variance extracted (AVE) were examined to assess indicator reliability, internal consistency reliability, and convergent validity. Discriminant validity was assessed using the Fornell–Larcker criterion and cross-loadings [51].
The structural model was subsequently evaluated using path coefficients (β), significance levels, coefficient of determination (R²), and effect sizes (f²) to examine the hypothesized relationships among PU, PEOU, ATT, SN, FC, and AI. Bootstrapping procedures were employed to assess the statistical significance of the hypothesized relationships in the PLS-SEM model [51].
4.6 Model evaluation and ethical considerations
The measurement and structural models were evaluated using established reliability, validity, and structural model assessment criteria for PLS-SEM [51]. The measurement model was assessed through indicator loadings, Cronbach’s alpha, CR, AVE, and discriminant validity. The structural model was evaluated using standardized path coefficients (β), significance levels (p-values), coefficient of determination (R²), and effect sizes (f²) [51].
The hypothesized relationships among the constructs were tested using bootstrapping procedures in SmartPLS to determine the statistical significance of the estimated path coefficients. The evaluation followed recommended procedures for PLS-SEM, with particular attention to the explanatory power and predictive relationships of the structural model [51].
In addition, the study followed established ethical principles for research involving human participants. Participation was voluntary, respondents were informed of the purpose of the study, and their responses were treated confidentially. No personally identifiable information was collected, and the data were used solely for academic purposes. The study received ethical approval from the Human Research Ethics Committee of Burapha University (No. IRB2-161/2568).
5.1 Respondent characteristics
A total of 400 valid questionnaires were retained for the final analysis after data screening and eligibility assessment. Table 1 presents the demographic characteristics of the respondents. The gender distribution was relatively balanced, with male and female respondents each accounting for 47.8% of the sample, while 4.5% identified as other genders. Regarding age, respondents aged 21–30 years represented the largest group (46.3%), followed by those below 20 years (41.0%). Thus, 87.3% of the respondents were below 31 years of age, indicating a substantial concentration of younger participants. In terms of monthly income, 72.8% reported earning less than 15,000 THB, while 13.8% earned 15,001–30,000 THB, 9.5% earned 30,001–50,000 THB, and 4.0% earned more than 50,000 THB. With respect to air travel frequency during the previous 12 months, 73.3% had traveled by air one to two times, followed by 13.0% who had traveled three to five times, 8.5% who had traveled six to ten times, and 5.3% who had traveled more than ten times. These characteristics indicate that the sample was concentrated among younger and lower-income respondents with relatively limited annual air travel frequency. Therefore, the findings should be interpreted as reflecting the perceptions of the surveyed sample rather than being generalized unconditionally to the entire population of Thai airline passengers.
Table 1. Demographic profile of respondents (N = 400)
|
Variable |
Category |
Frequency |
Percentage (%) |
|
Gender |
Male |
191 |
47.8 |
|
Female |
191 |
47.8 |
|
|
Other |
18 |
4.5 |
|
|
Age |
Below 20 years |
164 |
41.0 |
|
21–30 years |
185 |
46.3 |
|
|
31–40 years |
29 |
7.3 |
|
|
41–50 years |
20 |
5.0 |
|
|
51 years and above |
2 |
0.5 |
|
|
Monthly Income (THB) |
Less than 15,000 |
291 |
72.8 |
|
15,001–30,000 |
55 |
13.8 |
|
|
30,001–50,000 |
38 |
9.5 |
|
|
More than 50,000 |
16 |
4.0 |
|
|
Flight Frequency (Past 12 Months) |
1–2 times |
293 |
73.3 |
|
3–5 times |
52 |
13.0 |
|
|
6–10 times |
34 |
8.5 |
|
|
More than 10 times |
21 |
5.3 |
Note: Percentages may not total exactly 100% due to rounding.
5.2 Descriptive statistics
Descriptive statistics were calculated for the six latent constructs. As shown in Table 2, all constructs received relatively high mean scores, ranging from 3.999 to 4.252 on the five-point Likert scale. AI recorded the highest mean score (M = 4.252, SD = 0.599), followed by ATT (M = 4.240, SD = 0.597) and PU (M = 4.157, SD = 0.647). SN had a mean of 4.086 (SD = 0.630), while FC recorded a mean of 4.018 (SD = 0.674). PEOU had the lowest mean score (M = 3.999, SD = 0.637), although it remained above the midpoint of the measurement scale. Overall, the descriptive results indicate favorable perceptions and relatively high acceptance of clean energy technologies among the respondents.
Table 2. Descriptive statistics of the latent constructs
|
Construct |
Mean |
SD |
Interpretation |
|
Perceived Usefulness (PU) |
4.157 |
0.647 |
High |
|
Perceived Ease of Use (PEOU) |
3.999 |
0.637 |
High |
|
Attitude (ATT) |
4.240 |
0.597 |
High |
|
Subjective Norms (SN) |
4.086 |
0.630 |
High |
|
Facilitating Conditions (FC) |
4.018 |
0.674 |
High |
|
Acceptance and Intention to Use (AI) |
4.252 |
0.599 |
High |
5.3 Measurement model assessment
The measurement model was evaluated using SmartPLS 4.1.1.8 before assessing the structural relationships. The assessment examined indicator reliability, internal consistency reliability, convergent validity, discriminant validity, and collinearity. As shown in Table 3, all outer loadings ranged from 0.849 to 0.907, exceeding the commonly accepted threshold of 0.70. Cronbach’s alpha values ranged from 0.842 to 0.876, while composite reliability (rho_C) ranged from 0.905 to 0.924. The AVE values ranged from 0.760 to 0.802, exceeding the minimum criterion of 0.50. These findings demonstrate satisfactory indicator reliability, internal consistency reliability, and convergent validity for all six constructs.
Table 3. Measurement model: Outer loadings, reliability, and convergent validity
|
Construct |
Code |
Measurement Item |
Loading |
Cronbach’s α |
CR |
AVE |
|
Perceived Usefulness (PU) |
PU1 |
I believe that clean energy technologies can help airlines reduce their environmental impact. |
0.907 |
0.870 |
0.920 |
0.794 |
|
PU2 |
I believe that the use of clean energy technologies can contribute to more sustainable airline operations. |
0.886 |
||||
|
PU3 |
I believe that airlines using clean energy technologies can provide environmental benefits to passengers and society. |
0.880 |
||||
|
Perceived Ease of Use (PEOU) |
PEOU1 |
I believe that airlines can adopt clean energy technologies without reducing passenger convenience. |
0.876 |
0.842 |
0.905 |
0.760 |
|
PEOU2 |
I believe that the adoption of clean energy technologies can be implemented without making air travel more difficult for passengers. |
0.860 |
||||
|
PEOU3 |
I believe that clean energy technologies can be adopted without negatively affecting the passenger travel experience. |
0.879 |
||||
|
Attitude (ATT) |
ATT1 |
I believe that the adoption of clean energy technologies by airlines is a good idea. |
0.889 |
0.865 |
0.917 |
0.787 |
|
ATT2 |
I have a positive attitude toward airlines that adopt clean energy technologies. |
0.874 |
||||
|
ATT3 |
I support the adoption of clean energy technologies in the airline industry. |
0.899 |
||||
|
Subjective Norms (SN) |
SN1 |
People who are important to me think that airlines should adopt clean energy technologies. |
0.889 |
0.847 |
0.907 |
0.765 |
|
SN2 |
My family, friends, and colleagues would support my choice of airlines that adopt clean energy technologies. |
0.849 |
||||
|
SN3 |
People around me expect airlines to adopt environmentally responsible technologies. |
0.886 |
||||
|
Facilitating Conditions (FC) |
FC1 |
I believe that sufficient infrastructure is available to support the adoption of clean energy technologies in aviation. |
0.879 |
0.847 |
0.908 |
0.766 |
|
FC2 |
I believe that government policies and institutional support are available to facilitate the adoption of clean energy technologies by airlines. |
0.870 |
||||
|
FC3 |
I believe that airlines have sufficient resources and technological readiness to adopt clean energy technologies. |
0.876 |
||||
|
Acceptance and Intention to Use (AI) |
AI1 |
I am willing to choose an airline that uses clean energy technologies. |
0.906 |
0.876 |
0.924 |
0.802 |
|
AI2 |
I am willing to support airlines that adopt clean energy technologies. |
0.875 |
||||
|
AI3 |
I would recommend airlines that adopt clean energy technologies to others. |
0.905 |
Table 4. Discriminant validity: Fornell–Larcker criterion
|
Construct |
AI |
ATT |
FC |
PEOU |
PU |
SN |
|
AI |
0.896 |
|||||
|
ATT |
0.818 |
0.887 |
||||
|
FC |
0.722 |
0.702 |
0.875 |
|||
|
PEOU |
0.748 |
0.737 |
0.746 |
0.872 |
||
|
PU |
0.778 |
0.756 |
0.705 |
0.774 |
0.891 |
|
|
SN |
0.787 |
0.782 |
0.757 |
0.742 |
0.749 |
0.875 |
Note: Bold diagonal values represent the square root of AVE. ATT = Attitude, FC = Facilitating Conditions, PEOU = Perceived Ease of Use, PU = Perceived Usefulness, SN = Subjective Norms, AI = Acceptance and Intention to Use.
As shown in Table 4, the Fornell–Larcker criterion supports the discriminant validity of the constructs, with the square root of AVE for each construct exceeding its correlations with the other constructs. The cross-loading results presented in Table 5 further support discriminant validity. Each indicator demonstrated its highest loading on the construct to which it was theoretically assigned. For example, AI1, AI2, and AI3 loaded 0.906, 0.875, and 0.905, respectively, on AI, while their cross-loadings on the other constructs were lower. The same pattern was observed for the indicators of PU, PEOU, ATT, SN, and FC. Therefore, the indicators demonstrated satisfactory construct-specific loading patterns.
Table 5. Discriminant validity: cross-loadings
|
Indicator |
AI |
ATT |
FC |
PEOU |
PU |
SN |
|
AI1 |
0.906 |
0.744 |
0.647 |
0.680 |
0.716 |
0.728 |
|
AI2 |
0.875 |
0.716 |
0.650 |
0.647 |
0.680 |
0.672 |
|
AI3 |
0.905 |
0.737 |
0.643 |
0.682 |
0.696 |
0.712 |
|
ATT1 |
0.729 |
0.889 |
0.635 |
0.676 |
0.677 |
0.701 |
|
ATT2 |
0.707 |
0.874 |
0.614 |
0.647 |
0.647 |
0.671 |
|
ATT3 |
0.740 |
0.899 |
0.620 |
0.638 |
0.688 |
0.708 |
|
FC1 |
0.632 |
0.614 |
0.879 |
0.675 |
0.642 |
0.686 |
|
FC2 |
0.623 |
0.625 |
0.870 |
0.632 |
0.612 |
0.654 |
|
FC3 |
0.639 |
0.604 |
0.876 |
0.652 |
0.597 |
0.647 |
|
PEOU1 |
0.625 |
0.634 |
0.723 |
0.876 |
0.686 |
0.636 |
|
PEOU2 |
0.658 |
0.644 |
0.607 |
0.860 |
0.655 |
0.629 |
|
PEOU3 |
0.671 |
0.648 |
0.626 |
0.879 |
0.684 |
0.674 |
|
PU1 |
0.684 |
0.674 |
0.655 |
0.705 |
0.907 |
0.670 |
|
PU2 |
0.711 |
0.701 |
0.612 |
0.679 |
0.886 |
0.672 |
|
PU3 |
0.684 |
0.645 |
0.617 |
0.685 |
0.880 |
0.660 |
|
SN1 |
0.693 |
0.696 |
0.668 |
0.629 |
0.653 |
0.889 |
|
SN2 |
0.639 |
0.673 |
0.669 |
0.657 |
0.632 |
0.849 |
|
SN3 |
0.728 |
0.683 |
0.652 |
0.662 |
0.680 |
0.886 |
Note: Bold values represent the highest loading for each indicator. ATT = Attitude, FC = Facilitating Conditions, PEOU = Perceived Ease of Use, PU = Perceived Usefulness, SN = Subjective Norms, AI = Acceptance and Intention to Use.
Table 6. Collinearity statistics (VIF)
|
Construct |
Indicator |
VIF |
|
AI |
AI1 |
2.590 |
|
AI2 |
2.126 |
|
|
AI3 |
2.593 |
|
|
ATT |
ATT1 |
2.265 |
|
ATT2 |
2.090 |
|
|
ATT3 |
2.387 |
|
|
FC |
FC1 |
2.092 |
|
FC2 |
2.005 |
|
|
FC3 |
2.040 |
|
|
PEOU |
PEOU1 |
2.125 |
|
PEOU2 |
1.866 |
|
|
PEOU3 |
2.062 |
|
|
PU |
PU1 |
2.623 |
|
PU2 |
2.212 |
|
|
PU3 |
2.194 |
|
|
SN |
SN1 |
2.222 |
|
SN2 |
1.880 |
|
|
SN3 |
2.104 |
Note: ATT = Attitude, FC = Facilitating Conditions, PEOU = Perceived Ease of Use, PU = Perceived Usefulness, SN = Subjective Norms, AI = Acceptance and Intention to Use.
Collinearity was assessed using the Variance Inflation Factor (VIF). As shown in Table 6, all indicator-level VIF values ranged from 1.866 to 2.623, which were below the conservative threshold of 3.00. These results indicate that collinearity did not represent a critical problem in the measurement model.
5.4 Structural model assessment
Following confirmation of the reliability and validity of the measurement model, the structural model was assessed using PLS-SEM in SmartPLS 4.1.1.8. The assessment focused on the coefficient of determination (R²), effect size (f²), path coefficients, and statistical significance obtained through bootstrapping.
The endogenous construct, AI, produced an R² value of 0.760. This indicates that PU, PEOU, ATT, SN, and FC collectively explained 76.0% of the variance in AI. The remaining 24.0% was attributable to factors outside the proposed model. As presented in Table 7, the effect-size results indicate that ATT had the largest effect on AI (f² = 0.167), followed by PU (f² = 0.057), SN (f² = 0.047), PEOU (f² = 0.012), and FC (f² = 0.012). Thus, among the predictors included in the model, ATT demonstrated the greatest substantive contribution to explaining AI.
The effect-size results indicate that ATT had the largest effect on AI (f² = 0.167), followed by PU (f² = 0.057), SN (f² = 0.047), PEOU (f² = 0.012), and FC (f² = 0.012). Thus, among the predictors included in the model, ATT demonstrated the greatest substantive contribution to explaining AI.
Table 7. Coefficient of determination and effect size
|
Predictor |
R² (AI) |
f² |
Interpretation of f² |
|
ATT |
0.760 |
0.167 |
Medium |
|
PU |
0.760 |
0.057 |
Small |
|
SN |
0.760 |
0.047 |
Small |
|
PEOU |
0.760 |
0.012 |
Small |
|
FC |
0.760 |
0.012 |
Small |
Note: ATT = Attitude, FC = Facilitating Conditions, PEOU = Perceived Ease of Use, PU = Perceived Usefulness, SN = Subjective Norms, AI = Acceptance and Intention to Use.
Table 8. Partial Least Squares Structural Equation Modeling (PLS-SEM) model fit
|
Fit Index |
Saturated Model |
Estimated Model |
|
SRMR |
0.045 |
0.045 |
|
d_ULS |
0.339 |
0.339 |
|
d_G |
0.336 |
0.336 |
|
Chi-square |
1200.611 |
1200.611 |
|
NFI |
0.857 |
0.857 |
As shown in Table 8, the estimated model produced an SRMR of 0.045 and an NFI of 0.857. The d_ULS and d_G values were 0.339 and 0.336, respectively, while the chi-square value was 1200.611. These indices are reported as supplementary indicators of model fit, while the primary evaluation of the PLS-SEM model is based on the quality of the measurement model and the explanatory and predictive assessment of the structural model. Model fit was additionally assessed using PLS-SEM fit indices. The estimated model produced an SRMR of 0.045 and an NFI of 0.857. The d_ULS and d_G values were 0.339 and 0.336, respectively, while the chi-square value was 1200.611. These indices are reported as supplementary indicators of model fit, while the primary evaluation of the PLS-SEM model is based on the quality of the measurement model and the explanatory and predictive assessment of the structural model.
5.5 Hypothesis testing
The proposed hypotheses were tested using the bootstrapping procedure in SmartPLS 4.1.1.8. The results are presented in Table 9. Four of the five hypothesized relationships were statistically significant at the 0.05 level.
ATT had the strongest positive effect on AI, with a path coefficient of β = 0.363, a t-value of 7.380, and p < 0.001. Therefore, H3 was supported. PU also had a significant positive effect on AI (β = 0.212, t = 4.480, p < 0.001), supporting H1. SN significantly and positively influenced AI (β = 0.202, t = 3.980, p < 0.001), supporting H4. PEOU had a smaller but statistically significant positive effect on AI (β = 0.098, t = 2.187, p = 0.029), supporting H2.
Table 9. Results of hypothesis testing
|
Hypothesis & Structural Path |
β |
STDEV |
t-Value |
p-Value |
Decision |
|
|
H1 |
PU → AI |
0.212 |
0.047 |
4.480 |
< 0.001 |
Supported |
|
H2 |
PEOU → AI |
0.098 |
0.045 |
2.187 |
0.029 |
Supported |
|
H3 |
ATT → AI |
0.363 |
0.049 |
7.380 |
< 0.001 |
Supported |
|
H4 |
SN → AI |
0.202 |
0.051 |
3.980 |
< 0.001 |
Supported |
|
H5 |
FC → AI |
0.091 |
0.049 |
1.862 |
0.063 |
Not Supported |
In contrast, FC did not have a statistically significant effect on AI (β = 0.091, t = 1.862, p = 0.063). Although the estimated coefficient was positive, the p-value exceeded the 0.05 significance threshold. Therefore, H5 was not supported. These results demonstrate that the statistically significant structural predictors of passenger acceptance in the present model were ATT, PU, SN, and PEOU, whereas FC did not demonstrate a statistically significant direct effect.
5.6 Common method bias assessment
Because all constructs were measured using a single self-reported online questionnaire, the possibility of common method bias (CMB) was considered. Procedurally, the questionnaire was administered anonymously, participation was voluntary, and respondents were informed that their responses would be treated confidentially. The measurement items were presented as statements using a consistent five-point Likert scale, without requesting personally identifiable information. The original study documentation confirms the use of voluntary participation, electronic informed consent, confidentiality, and the absence of personally identifiable information.
However, a statistical CMB test is not available in the SmartPLS outputs provided for this revision. Therefore, a Harman’s single-factor test or an alternative statistical assessment should be conducted using the respondent-level dataset before this subsection is finalized. A numerical CMB result should not be inserted without an actual statistical output.
The findings of this study provide empirical evidence on the factors associated with passenger acceptance and intention to support clean energy technologies in the Thai airline industry. Based on the PLS-SEM results, ATT was the strongest predictor of AI, followed by PU, SN, PEOU, and FC. Four of the five hypothesized relationships were statistically supported, whereas the effect of FC was not statistically significant. The structural model explained 76.0% of the variance in AI (R² = 0.760), indicating substantial explanatory power. The findings therefore suggest that passenger acceptance of clean energy technologies is primarily shaped by psychological evaluation, perceived benefits, and social influence rather than by perceived enabling conditions alone. This interpretation is consistent with previous research demonstrating the importance of environmental attitudes, perceived benefits, and behavioral factors in shaping sustainable transportation and aviation-related intentions [2, 6, 7, 35].
6.1 Attitude as the strongest predictor of passenger acceptance
Among the five predictors, ATT had the strongest positive effect on AI (β = 0.363, t = 7.380, p < 0.001). This result supports H3 and indicates that passengers who hold more favorable evaluations of clean energy technologies are more likely to support, choose, and recommend airlines that adopt such technologies.
This finding is consistent with the TPB, which identifies attitude as a fundamental antecedent of behavioral intention [8]. Previous studies have similarly demonstrated the importance of attitudes in explaining sustainable transportation and environmentally responsible behavioral intentions [19, 21, 22]. In the aviation context, research on passenger environmental attitudes has also highlighted the importance of environmental perceptions and attitudes in relation to carbon-emission reduction and sustainable aviation behavior [2]. Moreover, studies examining passenger acceptance of SAF indicate that public perceptions and awareness can influence acceptance of cleaner aviation technologies [7, 35].
The strong effect of attitude may be explained by the nature of clean energy technologies in aviation. Passengers generally do not directly operate technologies such as SAF, electric aircraft, or hydrogen-powered aircraft. Instead, their acceptance is expressed through evaluations of airlines' environmental responsibility and their willingness to support airlines implementing cleaner technologies. Consequently, when passengers perceive clean energy adoption as environmentally responsible and beneficial for climate action, they are more likely to develop favorable attitudes and translate these evaluations into behavioral intentions. This interpretation is supported by research showing that environmental concerns and perceptions are relevant to the acceptance of emerging sustainable aviation and mobility technologies [2, 7, 31, 35].
The finding has an important implication for sustainable aviation: technological availability alone may not be sufficient to generate passenger support. Airlines should therefore communicate the environmental purpose, safety, reliability, and long-term sustainability benefits of clean energy technologies in ways that are understandable to passengers. Strengthening positive attitudes may be particularly important because attitude demonstrated the largest structural effect among the variables examined. Such communication is particularly relevant given that SAF and other alternative aviation fuels are increasingly considered important pathways for aviation decarbonization [4, 16], while public awareness and understanding remain important components of their broader acceptance [7].
6.2 Perceived Usefulness and passenger acceptance
PU had a significant positive effect on AI (β = 0.212, t = 4.480, p < 0.001), supporting H1. This result indicates that passengers are more likely to support clean energy technologies when they perceive that these technologies provide meaningful environmental and operational benefits.
The finding is consistent with the TAM, in which PU is a central determinant of technology acceptance [9, 30, 44]. Previous applications of TAM to sustainable transportation and emerging mobility technologies have likewise demonstrated the relevance of PU to behavioral intention and technology adoption [10, 13, 26]. Thus, the present finding extends the applicability of the usefulness construct to passenger acceptance of clean energy technologies in aviation.
In aviation, the importance of usefulness may be particularly related to passengers' perceptions of environmental performance. Although passengers may have limited knowledge of the technical characteristics of SAF, electric aircraft, or hydrogen propulsion, they can evaluate whether these technologies contribute to reducing environmental impacts and supporting more sustainable aviation. Previous research has emphasized the environmental benefits and decarbonization potential of SAF and alternative aviation pathways [4, 15, 16]. Therefore, passengers' perceptions of environmental usefulness may provide an important cognitive mechanism through which technological characteristics are translated into acceptance.
The relatively strong effect of PU therefore suggests that passenger acceptance is not based solely on environmental values; passengers also need to perceive a clear benefit from the technological transition. Airlines and policymakers should communicate measurable and credible benefits of clean energy adoption rather than relying only on general sustainability messages. Information concerning emissions reduction, operational benefits, and the contribution of clean energy technologies to the future of aviation may help strengthen passengers' PU. This is particularly important because aviation remains a significant source of transport-related emissions, making credible mitigation pathways increasingly important [14-16].
6.3 The role of Subjective Norms
SN significantly and positively influenced AI (β = 0.202, t = 3.980, p < 0.001), supporting H4. This finding demonstrates that passenger acceptance is influenced not only by individual evaluations but also by perceptions of what important people and society expect regarding sustainable aviation.
This result is consistent with TPB, which proposes that perceived social expectations can influence behavioral intention [8]. Empirical research on sustainable transportation has similarly demonstrated that SN and social influences contribute to sustainable behavioral intentions [19, 22]. In the context of travel behavior, TPB-based research has also confirmed the relevance of social and normative factors in shaping behavioral intentions [21].
The positive effect of SN suggests that sustainable aviation can become more acceptable when environmental responsibility is perceived as a socially desirable behavior. Passengers may be more willing to support airlines using clean energy technologies when such behavior is reinforced by their social networks and broader public discourse. This interpretation is also consistent with research showing that environmental attitudes and behaviors among airline passengers are influenced by broader social and environmental considerations [2].
This finding provides a practical basis for airlines to use social influence mechanisms in sustainability communication. Public campaigns, sustainability information, social media communication, and visible environmental commitments may help establish clean energy adoption as a socially supported characteristic of responsible airlines. Importantly, however, social influence should complement rather than replace substantive environmental performance, because passenger attitudes and PU remained important predictors in the structural model. Communication should therefore be supported by credible evidence of actual environmental benefits and transparent sustainability practices [4, 7].
6.4 Perceived Ease of Use and the importance of passenger convenience
PEOU also had a significant positive effect on AI (β = 0.098, t = 2.187, p = 0.029), supporting H2. Although its effect was smaller than those of ATT, PU, and SN, the statistically significant relationship indicates that convenience remains relevant to passenger acceptance.
The result supports the TAM perspective that technologies perceived as easier to use or implement are more likely to generate favorable acceptance and behavioral intentions [9, 30, 44]. Previous studies applying TAM to emerging transportation technologies have also demonstrated the relevance of PEOU in shaping technology acceptance [13, 26]. This suggests that even when passengers do not directly operate the technology, perceptions concerning the ease and convenience associated with technological transitions may still contribute to acceptance.
In the aviation context, however, ease of use should be interpreted differently from conventional consumer technologies. Passengers are generally not directly operating clean energy technologies. Rather, they assess whether technological changes can be introduced without compromising convenience, comfort, safety, service quality, or the overall travel experience.
This distinction is important because clean energy technologies may involve substantial technical changes at the airline and infrastructure levels while remaining largely invisible to passengers during the travel process. Therefore, passengers may accept such technologies when the transition does not create additional inconvenience. This perspective is consistent with research on passenger acceptance of emerging aviation and transportation technologies, where perceived technological characteristics can influence behavioral intentions even when users are not directly responsible for the underlying technical infrastructure [17, 35].
The relatively small effect size of PEOU compared with ATT and PU may indicate that passengers prioritize the environmental meaning and perceived benefits of clean energy adoption more strongly than the technical ease of the technology itself. Nevertheless, airlines should ensure that sustainability initiatives do not negatively affect core passenger experience. Communication should therefore emphasize that cleaner aviation can be pursued while maintaining appropriate levels of convenience, comfort, safety, and service quality.
6.5 Facilitating Conditions and the non-significant effect on acceptance
In contrast to the other predictors, FC did not have a statistically significant effect on AI (β = 0.091, t = 1.862, p = 0.063). Therefore, H5 was not supported.
This finding is particularly important because it differs from the expectation derived from UTAUT. FC generally concerns the availability of resources, infrastructure, technical support, and institutional arrangements required to enable technology adoption. In sustainable aviation, these conditions include infrastructure readiness, technological capability, government policies, institutional support, and resources required for implementing clean energy technologies. The importance of such systemic conditions is evident in research addressing aviation decarbonization and alternative aviation fuel pathways [4, 5, 14-16].
One possible explanation is that passengers are not the primary actors responsible for implementing aviation energy technologies. The actual adoption of SAF, electric aircraft, hydrogen-powered aircraft, and related technologies depends largely on airlines, airports, energy suppliers, regulators, governments, and other institutional stakeholders [4, 5, 14, 16]. Consequently, passengers may express strong support for clean energy aviation without having sufficient knowledge of whether the necessary infrastructure, resources, or institutional mechanisms currently exist.
This interpretation also helps explain why FC had a positive but statistically non-significant coefficient. Passengers may recognize that infrastructure and policy support are desirable, but these conditions may not directly determine their personal willingness to choose or recommend an airline. Instead, passengers appear to place greater emphasis on whether they personally perceive clean energy technologies positively and whether they believe these technologies provide meaningful benefits. Similar distinctions between individual acceptance and broader system-level conditions have been observed in research on emerging sustainable transportation technologies [10, 13, 19].
The non-significant result should therefore not be interpreted as evidence that FC are unimportant to sustainable aviation generally. Rather, it suggests that their influence may operate primarily at the organizational, infrastructural, or institutional level rather than directly through passenger acceptance. Future research could examine whether FC influences airline adoption or whether it indirectly affects passenger acceptance through PU, trust, environmental performance, or perceived safety. This would be particularly relevant in Thailand, where the transition toward lower-carbon domestic aviation requires coordinated technological, policy, and infrastructure measures [14].
6.6 Theoretical implications
The findings provide support for the usefulness of integrating TAM, TPB, and UTAUT to examine passenger acceptance of clean energy technologies in aviation. The study combines PU and PEOU from TAM, ATT and SN from TPB, and FC from UTAUT to provide complementary technological, psychological, social, and contextual explanations of passenger acceptance. Previous studies have demonstrated the value of combining technology acceptance and planned behavior perspectives when examining sustainable transportation and emerging mobility technologies [10, 13, 19, 26].
The results indicate that the three theoretical perspectives contribute differently to explaining passenger acceptance. The significant effects of PU and PEOU support the technological acceptance perspective of TAM [9, 30, 44]. The stronger effects of ATT and SN provide empirical support for the behavioral and social dimensions emphasized by TPB [8, 19, 22]. Meanwhile, the non-significant direct effect of FC suggests that the UTAUT construct may require contextual adaptation when applied to a technology that is primarily implemented by organizations rather than directly operated by consumers.
This finding represents an important contextual consideration. Clean energy technologies in aviation differ from conventional information technologies because passengers are primarily beneficiaries, evaluators, and supporters rather than direct users. Therefore, TAM applied to sustainable aviation should account for the distinction between direct technology use and consumer acceptance of organizational technological transitions. This distinction is particularly relevant to SAF and other alternative aviation fuels because their implementation depends heavily on industry infrastructure, regulation, supply chains, and institutional coordination [4, 5, 16].
Overall, the substantial explanatory power of the model (R² = 0.760) indicates that the integrated framework provides a strong explanation of passenger acceptance and intention to support clean energy technologies in the Thai airline context. The finding also supports the broader application of integrated technology-acceptance and behavioral frameworks to sustainable transportation research [10, 13, 19].
6.7 Implications for sustainable aviation and SDG 7 and SDG 13
The findings also have implications for sustainable development, particularly SDG 7 and SDG 13. Clean energy technologies such as SAF, electric aircraft, hydrogen-powered aircraft, and other renewable-energy solutions have been identified as potential pathways toward reducing the environmental impacts of aviation [3-5, 14-16]. The transition toward cleaner energy systems is particularly important in the context of global climate change and greenhouse gas emissions [1].
The high level of passenger acceptance observed in this study suggests a potentially favorable demand-side environment for the transition toward cleaner aviation. However, passenger acceptance should be understood as one component of a broader transition system. It does not by itself demonstrate actual reductions in aviation emissions or guarantee successful technological implementation. Previous research on aviation decarbonization emphasizes that technological pathways must be supported by appropriate policies, infrastructure, fuel availability, and coordinated institutional action [4, 5, 14-16].
The findings suggest that airlines should focus on three interconnected areas: building positive passenger attitudes, communicating clear environmental and operational benefits, and reinforcing social support for sustainable aviation. At the same time, policymakers and aviation stakeholders must continue developing the infrastructure, regulatory frameworks, investment mechanisms, and institutional arrangements necessary for implementation. In Thailand, policy and mitigation strategies for domestic aviation are particularly relevant to achieving longer-term emissions-reduction objectives [5, 14]. Thus, achieving SDG 7 and SDG 13 in aviation requires alignment between passenger demand, technological capability, organizational implementation, and public policy [3].
In summary, the results demonstrate that passenger acceptance of clean energy technologies in Thai aviation is driven primarily by ATT, PU, and social influence, while PEOU has a smaller but significant role. FC, although theoretically relevant, did not demonstrate a statistically significant direct effect in this sample. The findings therefore reinforce the value of an integrated TAM–TPB–UTAUT perspective while also demonstrating the need to adapt technology acceptance theory to the distinctive characteristics of sustainable aviation.
This study examined the factors influencing passengers’ acceptance and intention to support clean energy technologies adopted by airlines in Thailand by integrating the TAM, TPB, and UTAUT. The findings provide empirical evidence that passenger acceptance of clean energy technologies is shaped primarily by psychological, technological, and social factors. Among the five proposed predictors, ATT had the strongest positive effect on AI, followed by PU, SN, and PEOU. In contrast, FC did not demonstrate a statistically significant direct effect on passenger acceptance.
The strongest effect of ATT indicates that passengers’ favorable evaluations of clean energy technologies are particularly important in encouraging their willingness to choose, support, and recommend airlines adopting such technologies. PU also demonstrated a significant positive effect, suggesting that communicating the environmental and operational benefits of clean energy technologies can strengthen passenger acceptance. In addition, the significant effects of SN and PEOU indicate that social expectations and perceptions of maintaining convenience and travel experience also contribute to acceptance. These findings support the relevance of TAM and TPB in explaining passenger responses to sustainable aviation technologies. The non-significant effect of FC, meanwhile, suggests that infrastructure, institutional support, and technological readiness may be perceived primarily as responsibilities of airlines, governments, airports, and other aviation stakeholders rather than as direct determinants of passengers’ behavioral intentions. This distinction is particularly relevant because passengers generally do not directly operate technologies such as SAF, electric aircraft, or hydrogen-powered aircraft.
The structural model explained 76.0% of the variance in AI (R² = 0.760), demonstrating substantial explanatory power. The overall findings therefore support the use of an integrated TAM–TPB–UTAUT framework for examining passenger acceptance of clean energy technologies in the Thai aviation context. The results also extend the application of technology acceptance perspectives to sustainable aviation, where acceptance represents not only direct technology use but also passengers’ willingness to support, choose, and recommend airlines that adopt environmentally responsible technologies.
From a practical perspective, airlines should prioritize strategies that strengthen positive passenger attitudes, communicate credible environmental and operational benefits, and reinforce social support for sustainable aviation. At the same time, policymakers and aviation stakeholders should continue developing the infrastructure, regulatory mechanisms, resources, and institutional support required for the implementation of clean energy technologies. Such coordinated efforts are relevant to the broader transition toward sustainable aviation and the advancement of SDG 7 and SDG 13.
Overall, the study concludes that passenger acceptance provides an important demand-side foundation for the transition toward cleaner aviation in Thailand. However, positive passenger intentions alone cannot ensure technological implementation or emissions reduction. Sustainable aviation ultimately requires alignment among passenger acceptance, technological development, airline strategies, infrastructure readiness, and institutional policy. The present findings provide a basis for airlines and policymakers to place greater emphasis on the passenger perspective while continuing to address the structural conditions necessary for long-term clean energy adoption in aviation.
This research was financially supported by the Targeted Research Grant Program for Academic Staff, Fiscal Year 2025 (B.E. 2568), Faculty of Logistics, Burapha University, Thailand. The authors gratefully acknowledge this support, which made the completion of this study possible.
The authors would also like to thank all participants for their valuable contributions and cooperation throughout the data collection process. Their responses provided important insights into passenger acceptance of clean energy technologies in Thai airlines and contributed significantly to the achievement of the research objectives.
[1] Filonchyk, M., Peterson, M.P., Zhang, L., Hurynovich, V., He, Y. (2024). Greenhouse gases emissions and global climate change: Examining the influence of CO2, CH4, and N2O. Science of the Total Environment, 935: 173359. https://doi.org/10.1016/j.scitotenv.2024.173359
[2] Laphet, J., Tandamrong, D. (2025). Exploring airline passengers’ environmental attitudes and behaviors: Factor analysis of carbon emission reduction strategies. International Journal of Environmental Impacts, 8(4): 655-665. https://doi.org/10.18280/ijei.080403
[3] Agbaitoro, G.A., Oyibo, K.I. (2022). Realizing the United Nations Sustainable Development Goals 7 and 13 in sub-Saharan Africa by 2030: Synergizing energy and climate justice perspectives. The Journal of World Energy Law & Business, 15(3): 223-235. https://doi.org/10.1093/jwelb/jwac009
[4] Braun, M., Grimme, W., Oesingmann, K. (2024). Pathway to net zero: Reviewing sustainable aviation fuels, environmental impacts and pricing. Journal of Air Transport Management, 117: 102580. https://doi.org/10.1016/j.jairtraman.2024.102580
[5] Khongbamphen, S. (2025). Sustainable aviation fuel (SAF) regulations: Europe, Asia, and Thailand. SSRN Electronic Journal. https://doi.org/10.2139/ssrn.5195879
[6] Choi, A.S., Ritchie, B.W. (2014). Willingness to pay for flying carbon neutral in Australia: An exploratory study of offsetter profiles. Journal of Sustainable Tourism, 22(8): 1236-1256. https://doi.org/10.1080/09669582.2014.894518
[7] Rogachuk, B.E., Prigmore, S.M., Ogbaga, C.C., Okolie, J.A. (2025). Public perception and awareness of sustainable aviation fuel in South Central United States. Sustainability, 17(9): 4019. https://doi.org/10.3390/su17094019
[8] Ajzen, I. (2020). The theory of planned behavior: Frequently asked questions. Human Behavior and Emerging Technologies, 2(4): 314-324. https://doi.org/10.1002/hbe2.195
[9] Wang, Z., Wang, Y., Zeng, Y., Su, J., Li, Z. (2025). An investigation into the acceptance of intelligent care systems: An extended technology acceptance model (TAM). Scientific Reports, 15: 17912. https://doi.org/10.1038/s41598-025-02746-w
[10] Chonsalasin, D., Champahom, T., Wirotthitiyawong, N., et al. (2026). Understanding electric vehicle adoption across user segments in Thailand: Integrating technology acceptance, planned behavior, and environmental psychology. Urban Science, 10(5): 232. https://doi.org/10.3390/urbansci10050232
[11] Fidalgo, M., Dias, F. (2026). Beyond the intention–behavior gap in sustainable tourism: A multilevel model of environmental incoherence and integrity. Sustainability, 18(11): 5412. https://doi.org/10.3390/su18115412
[12] Sharmila Devi, R., Perumandla, S. (2024). Beyond blueprints: Unveiling sustainable housing ambitions–A TAM and EMGB fusion among paraprofessionals in urban construction landscape. Engineering, Construction and Architectural Management, 33(1): 229-257. https://doi.org/10.1108/ECAM-02-2024-0191
[13] Sakuljao, P., Satiennam, W., Satiennam, T., Kronprasert, N., Jaensirisak, S. (2023). Understanding intention to use conditionally automated vehicles in Thailand, based on an extended technology acceptance model. Sustainability, 15(3): 1868. https://doi.org/10.3390/su15031868
[14] Champeecharoensuk, A., Dhakal, S., Chollacoop, N. (2023). Climate change mitigation in Thailand’s domestic aviation: Mitigation options analysis towards 2050. Energies, 16(20): 7199. https://doi.org/10.3390/en16207199
[15] Hasan, M.A., Mamun, A.A., Rahman, S.M., et al. (2021). Climate change mitigation pathways for the aviation sector. Sustainability, 13(7): 3656. https://doi.org/10.3390/su13073656
[16] Detsios, N., Theodoraki, S., Maragoudaki, L., Atsonios, K., Grammelis, P., Orfanoudakis, N.G. (2023). Recent advances on alternative aviation fuels/pathways: A critical review. Energies, 16(4): 1904. https://doi.org/10.3390/en16041904
[17] Kim, C., Lee, K.C., Costello, F.J. (2020). The intention of passengers towards repeat use of biometric security for sustainable airport management. Sustainability, 12(11): 4528. https://doi.org/10.3390/su12114528
[18] Davis, F.D. (1989). Perceived usefulness, perceived ease of use, and user acceptance of information technology. MIS Quarterly, 13(3): 319-340. https://doi.org/10.2307/249008
[19] Yuen, K.F., Chua, G., Wang, X., Ma, F., Li, K.X. (2020). Understanding public acceptance of autonomous vehicles using the theory of planned behaviour. International Journal of Environmental Research and Public Health, 17(12): 4419. https://doi.org/10.3390/ijerph17124419
[20] Tao, D., Fu, P., Wang, Y., Zhang, T., Qu, X. (2019). Key characteristics in designing massive open online courses (MOOCs) for user acceptance: An application of the extended technology acceptance model. Interactive Learning Environments, 30(5): 882-895. https://doi.org/10.1080/10494820.2019.1695214
[21] Sujood, Hamid, S., Bano, N. (2021). Behavioral intention of traveling in the period of COVID-19: An application of the theory of planned behavior (TPB) and perceived risk. International Journal of Tourism Cities, 8(2): 357-378. https://doi.org/10.1108/IJTC-09-2020-0183
[22] Liu, Y., Sheng, H., Mundorf, N., Redding, C., Ye, Y. (2017). Integrating norm activation model and theory of planned behavior to understand sustainable transport behavior: Evidence from China. International Journal of Environmental Research and Public Health, 14(12): 1593. https://doi.org/10.3390/ijerph14121593
[23] Shamsi, M., Iakovleva, T., Olsen, E., Bagozzi, R.P. (2021). Employees’ work-related well-being during COVID-19 pandemic: An integrated perspective of technology acceptance model and JD-R theory. International Journal of Environmental Research and Public Health, 18(22): 11888. https://doi.org/10.3390/ijerph182211888
[24] Okangba, S., Ngcobo, N., Mahachi, J. (2025). Bridging innovation and governance: A UTAUT-based mixed-method study of 3D concrete printing technology acceptance in South Africa. Architecture, 5(4): 131. https://doi.org/10.3390/architecture5040131
[25] Marian, A.L., Apostolache, R., Ceobanu, C.M. (2025). Toward sustainable technology use in education: Psychological pathways and professional status effects in the TAM framework. Sustainability, 17(15): 7025. https://doi.org/10.3390/su17157025
[26] Yuen, K.F., Cai, L., Qi, G., Wang, X. (2021). Factors influencing autonomous vehicle adoption: An application of the technology acceptance model and innovation diffusion theory. Technology Analysis & Strategic Management, 33(5): 505-519. https://doi.org/10.1080/09537325.2020.1826423
[27] Paparoidamis, N.G., Tran, T.T.H., Leonidou, L.C., Zeriti, A. (2019). Being innovative while being green: An experimental inquiry into how consumers respond to eco-innovative product designs. Journal of Product Innovation Management, 36(6): 824-847. https://doi.org/10.1111/jpim.12509
[28] Kim, Y., Lee, S.S., Roh, T. (2020). Taking another look at airline CSR: How required CSR and desired CSR affect customer loyalty in the airline industry. Sustainability, 12(10): 4281. https://doi.org/10.3390/su12104281
[29] Dingil, A.E., Rupi, F., Esztergár-Kiss, D. (2021). An integrative review of socio-technical factors influencing travel decision-making and urban transport performance. Sustainability, 13(18): 10158. https://doi.org/10.3390/su131810158
[30] Venkatesh, V., Davis, F.D. (2000). A theoretical extension of the technology acceptance model: Four longitudinal field studies. Management Science, 46(2): 186-204. https://doi.org/10.1287/mnsc.46.2.186.11926
[31] Liao, C., Shen, Y., Guo, R., Yu, Z. (2025). Exploring the impact of innovation resistance on public adoption of urban air mobility: Environmental concern and innovativeness as moderators. Journal of Advanced Transportation, 2025(1): 4424886. https://doi.org/10.1155/atr/4424886
[32] Tsai, C.M., Kao, W.Y., Liu, W.C. (2025). Navigating sustainable mobility in Taiwan: Exploring the brand-specific effects of perceived green attributes on the green purchase intention for battery electric vehicles. Sustainability, 17(3): 985. https://doi.org/10.3390/su17030985
[33] Rajiani, I., Kot, S. (2018). The prospective consumers of the Indonesian green aviation initiative for sustainable development in air transportation. Sustainability, 10(6): 1772. https://doi.org/10.3390/su10061772
[34] García-Molaguero, C.C., García-Almeida, D.J. (2026). Improving sustainability in aviation through fuel saving decisions: Individual determinants for airline pilots’ environmental workplace behavior. International Journal of Sustainable Transportation, 1-13. https://doi.org/10.1080/15568318.2026.2664538
[35] Arning, K., Engelmann, L., Ziefle, M. (2023). Ready to fly? Comparing acceptance and behavioral usage intentions of CO2-based aviation fuels in four European countries. Frontiers in Energy Research, 11: 1156709. https://doi.org/10.3389/fenrg.2023.1156709
[36] Maleknia, R., Hălălișan, A.F., Maleknia, K. (2025). Who shapes what we should do in urban green spaces? An investigation of subjective norms in pro-environmental behavior in Tehran. Forests, 16(8): 1273. https://doi.org/10.3390/f16081273
[37] Beğendik, B., Karadeniz, S. (2026). Green marketing and repurchase intention in the airline industry: The mediating role of electronic word-of-mouth. Sustainability, 18(5): 2320. https://doi.org/10.3390/su18052320
[38] Norbu, T., Park, J.Y., Wong, K.W., Cui, H. (2024). Factors affecting trust and acceptance for blockchain adoption in digital payment systems: A systematic review. Future Internet, 16(3): 106. https://doi.org/10.3390/fi16030106
[39] Golbabaei, F., Yigitcanlar, T., Paz, A., Bunker, J. (2022). Understanding autonomous shuttle adoption intention: Predictive power of pre-trial perceptions and attitudes. Sensors, 22(23): 9193. https://doi.org/10.3390/s22239193
[40] Hemmings, P., Mulheron, M., Murphy, R.J., Prescott, M. (2021). Investigating the impact of COVID-19 disruption on the decarbonisation agenda at airports: Grounded or ready for take-off? Sustainability, 13(21): 12235. https://doi.org/10.3390/su132112235
[41] Suo, Y., Li, C., Tang, L., Huang, L. (2024). Exploring AAM acceptance in tourism: Environmental consciousness’s influence on hedonic motivation and intention to use. Sustainability, 16(8): 3324. https://doi.org/10.3390/su16083324
[42] Ferrer, A.L.C., Thome, A.M.T. (2023). Carbon emissions in transportation: A synthesis framework. Sustainability, 15(11): 8475. https://doi.org/10.3390/su15118475
[43] Zou, T., Guan, J., Wang, Y., Zheng, F., Lin, Y., Zhao, Y. (2025). Research on the thermal comfort experience of metro passengers under sustainable transportation: Theory of stimulus-organism-response integration with a technology acceptance model. Sustainability, 17(1): 362. https://doi.org/10.3390/su17010362
[44] Adams, D.A., Nelson, R.R., Todd, P.A. (1992). Perceived usefulness, ease of use, and usage of information technology: A replication. MIS Quarterly, 16(2): 227-247. https://doi.org/10.2307/249577
[45] Ali, N., Nakayama, S., Yamaguchi, H. (2023). Using the extensions of the theory of planned behavior (TPB) for behavioral intentions to use public transport (PT) in Kanazawa, Japan. Transportation Research Interdisciplinary Perspectives, 17: 100742. https://doi.org/10.1016/j.trip.2022.100742
[46] Venkatesh, V., Morris, M.G., Davis, G.B., Davis, F.D. (2003). User acceptance of information technology: Toward a unified view. MIS Quarterly, 27(3): 425-478. https://doi.org/10.2307/30036540
[47] Han, H., Lee, K.S., Radic, A., Ngah, A.H., Kim, J.J. (2021). The extended self-identify-based electric product adoption model and airline business strategy: A new theoretical framework for green technology products. Journal of Travel & Tourism Marketing, 38(3): 247-262. https://doi.org/10.1080/10548408.2021.1906386
[48] Zhu, Y., Wu, Z., Li, Z., Wang, H. (2026). Research on the acceptance mechanism and gender differences in urban air mobility in China based on an extended technology acceptance model. Sustainability, 18(17): 8836. https://doi.org/10.3390/su18178836
[49] Almogren, A.S. (2025). AI innovation, green learning, and sustainable attitudes: Pathways to green technology adoption in universities. Research Square. https://doi.org/10.21203/rs.3.rs-7685621/v1
[50] Yang, Y., Kim, M.Y. (2024). Promoting sustainable transportation: How people trust and accept autonomous vehicles—Focusing on the different levels of collaboration between human drivers and artificial intelligence—An empirical study with partial least squares structural equation modeling and multi-group analysis. Sustainability, 17(1): 125. https://doi.org/10.3390/su17010125
[51] Hair Jr, J.F., Hult, G.T.M., Ringle, C.M., Sarstedt, M., Danks, N.P., Ray, S. (2021). Partial Least Squares Structural Equation Modeling (PLS-SEM) Using R: A Workbook. Springer International Publishing. https://doi.org/10.1007/978-3-030-80519-7