Korn Premrungchet | Jutarat Keawboonchu | Sarawut Thepanondh* | Peemapat Jookjantra
© 2026 The authors. This article is published by IIETA and is licensed under the CC BY 4.0 license (http://creativecommons.org/licenses/by/4.0/).
OPEN ACCESS
This study investigates the implications of Thailand's revised ambient air quality standards on the interpretation of air dispersion modeling outcomes using the AERMOD model. A case study was conducted at the Map Ta Phut Industrial Complex, utilizing 2024 emissions and meteorological data to evaluate sulfur dioxide (SO₂) and nitrogen dioxide (NO₂) concentrations. High-resolution, site-specific meteorological observations collected during 2024 were incorporated into the AERMOD modeling framework to simulate short-term SO₂ (1-h and 24-h) and NO₂ (1-h) concentrations. Model outputs were systematically analyzed using maximum, 98th percentile, and 95th percentile concentration metrics and benchmarked against both previous and newly revised Thai ambient air quality standards. Modeled concentrations were further interpreted alongside observed monitoring data to strengthen the understanding of temporal variability and extreme pollution events. The results demonstrate that exclusive reliance on the maximum concentration indicator under the revised standards leads to compliance interpretations that are disproportionately influenced by rare episodic extreme events rather than representative ambient conditions. The 98th and 95th percentile values consistently remain within compliance limits, reflecting typical ambient air quality more accurately. Additionally, incomplete ambient ozone (O₃) monitoring data introduces uncertainty in NO₂ estimation through the PVMRM conversion method, highlighting the importance of data completeness in regulatory modeling applications. These findings demonstrate the scientific limitations of relying solely on maximum concentration for compliance assessment, and highlight the value of reporting percentile-based indicators alongside the maximum to provide a more complete and representative picture of ambient air quality in Environmental Impact Assessment (EIA) practice in Thailand.
AERMOD, air pollution, ambient air quality standards, Environmental Impact Assessment, sensitivity analysis, Thailand
Air pollution is a significant environmental concern, particularly in industrial estates where factories discharge various pollutants [1]. WHO [2] has documented the adverse effects of SO₂ and NO₂ on human health and ecosystems [1, 3]. Environmental Impact Assessment (EIA) is a crucial process for identifying and assessing potential air pollution impacts before project implementation, as established by Office of Natural Resources and Environmental Policy and Planning (ONEP) [4]. In Thailand, ONEP has accepted the AERMOD dispersion model for EIA reports since 2007, as documented by the Eastern Economic Corridor (EEC) Policy Committee [5]. In Thai EIA practice, modeled maximum concentrations are combined with background concentrations and compared with the applicable ambient air quality standards, as described in ONEP guidance [4].
Previous studies at the Map Ta Phut Industrial Complex have evaluated AERMOD performance, including Malakan et al. [6] and Jittra and Thepanondh [7]. However, the specific effect of the revised Thai ambient air quality standards on model-based compliance interpretation, particularly the sensitivity of maximum versus percentile concentration indicators to the new thresholds, has not been systematically examined. This study addresses that gap.
Sulfur dioxide (SO₂) and nitrogen dioxide (NO₂) are key air pollutants regulated in EIA applications due to their adverse effects on human health and the environment [1, 3], as documented by WHO [2]. NO₂ is a reactive gas associated with emissions from fuel-combustion sources and is linked to respiratory health effects at elevated concentrations, as described by WHO [2]. SO₂ is emitted mainly from combustion of sulfur-containing fuels in industrial and power generation activities [1].
Thailand’s ambient air quality standards for key pollutants were recently revised by the National Environment Board [8], replacing earlier standards established and subsequently amended under previous National Environment Board notifications, as summarized in the Pollution Control Department’s compilation [9] and shown in Table 1. Against these lower thresholds, the present study examines how concentration indicators and meteorological inputs influence the interpretation of modeled results. AERMOD is a steady-state plume dispersion model designed to assess air pollutant dispersion from various sources, as described by US EPA [10], Cimorelli et al. [11], and Perry et al. [12]. A common limitation in regulatory modeling is the completeness of input data; missing meteorological records may occur due to instrument malfunction or transmission issues, as noted by US EPA [13], and incomplete ambient ozone (O₃) monitoring data can further affect NO₂ assessments under the PVMRM conversion method, as described by US EPA [14].
The National Environment Board (NEB) 2026 notification specifies revised ambient concentration thresholds [8], while the applicable ONEP EIA guidance describes assessment using modeled maximum concentrations together with background concentrations [4]. The present study therefore examines how the choice of concentration indicator (maximum versus percentile) influences the interpretation of modeled results under the revised thresholds, while retaining the maximum concentration as the existing EIA reference metric.
Table 1. Changes in Thai ambient air quality standards
|
Pollutant |
Averaging Time |
Old Standard (ppb) |
Revised Standard (ppb) |
|
SO₂ |
1-h |
300 |
100 |
|
SO₂ |
24-h |
120 |
50 |
|
NO₂ |
1-h |
170 |
120 |
2.1 Study area and emission data
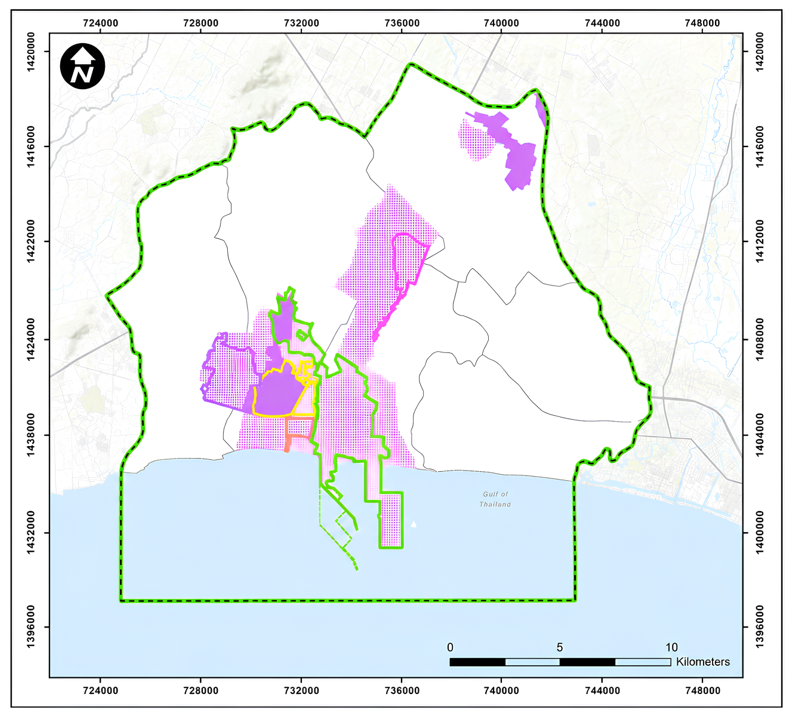
The study area is the Map Ta Phut Industrial Complex in Rayong Province, Thailand, which covers approximately 416.70 km² and is designated as a pollution control zone by EEC [15]. The complex contains approximately 200 industrial factories across diverse sectors. Emission data for the year 2024, including coordinates and stack parameters for 381 sources with total emission rates of 689.71 g/s for SO₂ and 648.27 g/s for NO₂, were obtained as secondary data from ONEP, as shown in Figure 1.
Figure 1. Map Ta Phut industrial complex and industrial estates in Rayong Province, Thailand
2.2 Meteorological and ambient data
Locally measured on-site meteorological data for 2024 were used as input to AERMOD, following the guidance of US EPA [13]. The dataset had a data completeness of 92.1% (7.9% missing hours) due to instrument malfunction or maintenance periods. Missing surface meteorological data were filled following the ONEP guideline for air quality impact assessment using mathematical models [4]. For missing periods of no more than four consecutive hours, stepwise linear interpolation was applied, while longer missing periods were replaced using data from a nearby monitoring station or data from the same date and time of the previous year, in that order. After gap filling, 8,783 valid hourly observations were available out of 8,784 possible hours in 2024, corresponding to approximately 99.99% data completeness. Ambient air monitoring data for SO₂ and NO₂, as well as hourly ambient ozone (O₃) data used for the PVMRM NO₂ conversion calculation, were obtained from monitoring stations operated by Industrial Estate Authority of Thailand (IEAT) within the Map Ta Phut Industrial Complex.
2.3 Modeling configuration
AERMOD was used for all simulations, following the formulation described by US EPA [10]. Meteorological inputs were preprocessed using AERMET, and terrain data were processed using AERMAP with Shuttle Radar Topography Mission (SRTM) digital elevation data. A uniform Cartesian receptor grid of 1,681 receptors at 500 m spacing was applied over the study domain. NO₂ was modeled using the Tier 3 PVMRM method, which estimates the conversion of NOₓ to NO₂ by using hourly ambient ozone (O₃) data. Model results were summarized as maximum, 98th percentile, and 95th percentile concentrations.
Percentile concentrations were calculated separately at each receptor over the full 2024 simulation period. For 1-h SO₂ and NO₂, the 98th and 95th percentiles were determined from valid hourly modeled concentrations using the nearest-discrete-value (non-interpolated) ranking method. For 24-h SO₂, the percentiles were calculated from daily 24-h block-average concentrations generated by AERMOD. The statistical population consisted of 366 daily 24-h values per receptor, corresponding to the full 2024 calendar year (a leap year). The highest receptor-specific percentile value among the 1,681 receptors was then reported as the domain-wide percentile value in Tables 2-4, following the same spatial reporting approach used for the maximum (1st-highest) concentration.
The PVMRM was originally developed by Hanrahan [16] to calculate the ratio of NO₂ to NOₓ concentrations downwind from industrial sources by estimating the volume of ozone entrained into the dispersion plume. In the field evaluation reported by Hendrick et al. [17], PVMRM predictions were closer to observed NO₂ concentrations than OLM for the evaluated near-source monitoring case.
The PVMRM was configured with an Equilibrium NO₂/NOₓ ratio of 0.900 and a Default In-Stack NO₂/NOₓ ratio of 0.500, consistent with US EPA default values. For hours with missing ambient O₃ data, AERMOD’s built-in minimum background ozone floor of 40 ppb was applied automatically (NOMINO3 option not activated), consistent with US EPA AERMOD modeling guidance. All modeled concentrations were converted from µg/m³ to ppb using standard reference conditions of T = 25 ℃ and P = 1 atm, consistent with US EPA regulatory practice and NEB 2026 Article 5, with molecular weights of 46.0 g/mol for NO₂ and 64.0 g/mol for SO₂. The conversion formula shown in Eq. (1).
$p p b=\frac{\left(\mu \mathrm{g} / \mathrm{m}^3 \times 24.45\right)}{M W}$ (1)
3.1 Sensitivity of compliance interpretation to revised standards
Under the revised Thai ambient air quality standards, compliance interpretation was found to be highly sensitive to the choice of concentration indicator. The following results illustrate the divergence between maximum and percentile concentration values for SO₂ and NO₂.
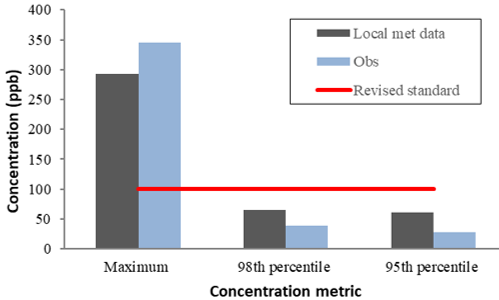
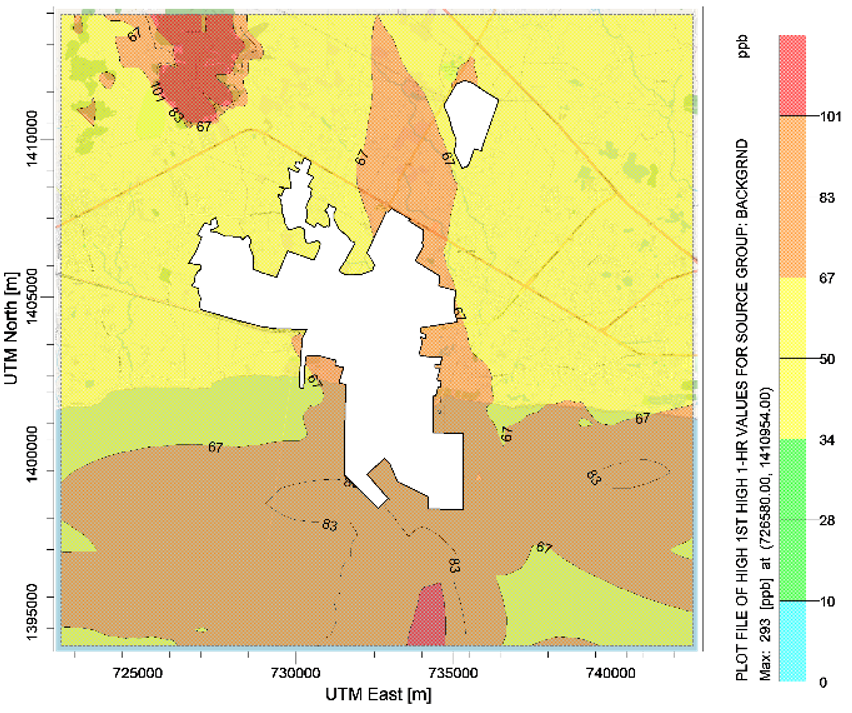
1-h SO₂: As shown in Table 2 and Figure 2, the maximum concentration predicted using local meteorological data reached 293 ppb, significantly exceeding the revised standard of 100 ppb. The 98th and 95th percentile values (65 ppb and 61 ppb respectively) remain well below the revised standard, indicating compliance under percentile-based assessment. The observed maximum (345 ppb) similarly reflects an isolated extreme event, confirming the sensitivity of compliance outcomes to the indicator chosen.
Table 2. SO₂ concentration results for 1-h averaging time
|
Concentration Metric |
Modeled (ppb) |
Observed (ppb) |
|
Maximum |
293 |
345 |
|
98th percentile |
65 |
38 |
|
95th percentile |
61 |
27 |
|
Old Thai standard |
300 |
300 |
|
Revised Thai standard |
100 |
100 |
Figure 2. SO₂ concentration results for 1-h averaging time (revised standard)
Table 3. SO₂ concentration results for 24-h averaging time
|
Concentration Metric |
Modeled (ppb) |
Observed (ppb) |
|
Maximum |
71 |
32 |
|
98th percentile |
50 |
24 |
|
95th percentile |
49 |
20 |
|
Old Thai standard |
120 |
120 |
|
Revised Thai standard |
50 |
50 |
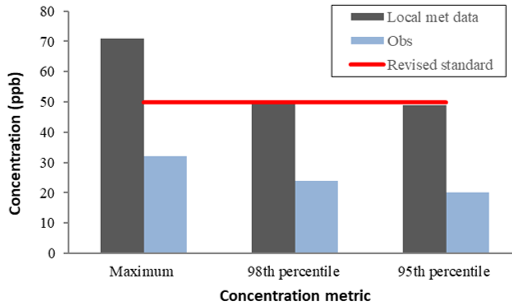
Figure 3. SO₂ concentration results for 24-h averaging time (revised standard)
24-h SO₂: As shown in Table 3 and Figure 3, the maximum modelled 24-h SO₂ concentration (71 ppb) exceeds the revised standard of 50 ppb, while the 98th and 95th percentile values (50 ppb and 49 ppb) are at or below the revised threshold. The observed maximum was only 32 ppb, substantially lower than the modeled maximum, confirming that peak model outputs reflect rare worst-case conditions rather than typical ambient concentrations.
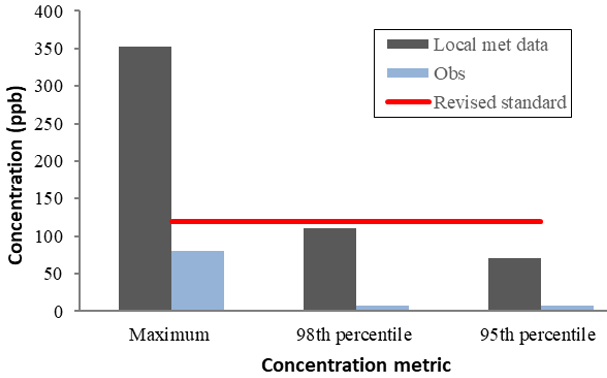
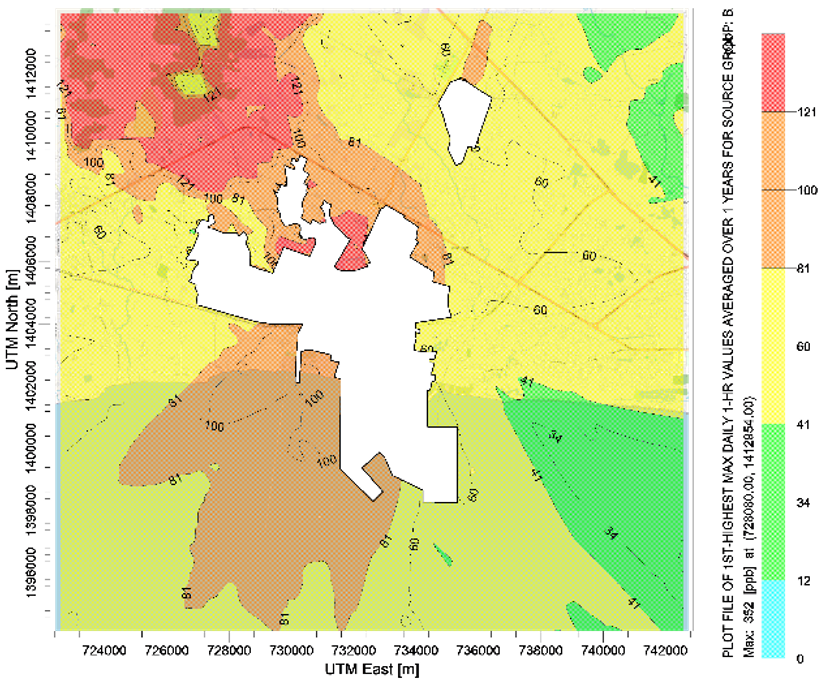
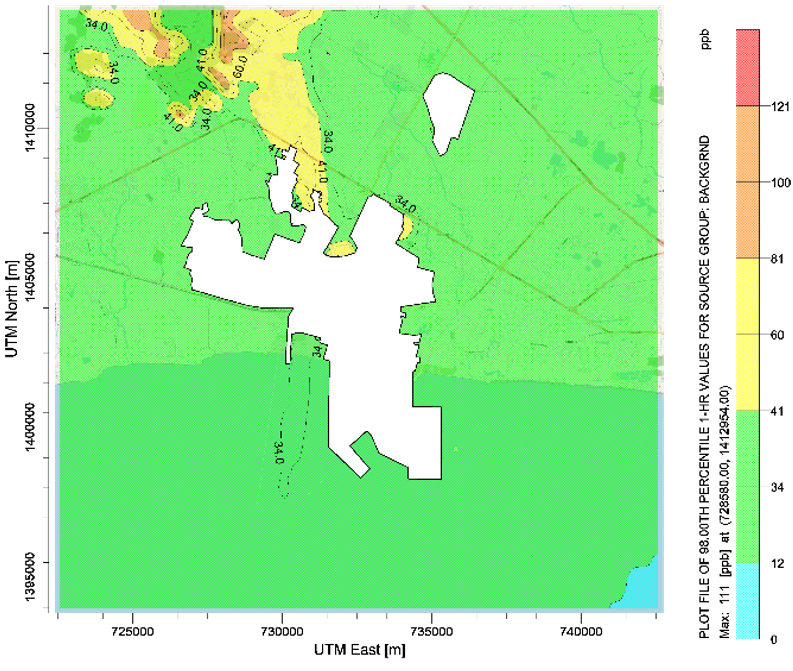
1-h NO₂: As shown in Table 4 and Figure 4, the sensitivity of compliance results to the choice of indicator is most pronounced for NO₂. The maximum modeled concentration (352 ppb) is nearly three times the revised standard of 120 ppb, while the 98th and 95th percentile values (111 ppb and 71 ppb) remain below the revised threshold. The observed maximum (80 ppb) is well within the standard, further demonstrating that the maximum modeled value represents an extreme and unrepresentative condition under the revised limits.
Table 4. NO₂ concentration results for 1-h averaging time
|
Concentration Metric |
Modeled (ppb) |
Observed (ppb) |
|
Maximum |
352 |
80 |
|
98th percentile |
111 |
8 |
|
95th percentile |
71 |
7 |
|
Old Thai standard |
170 |
170 |
|
Revised Thai standard |
120 |
120 |
Figure 4. NO₂ concentration results for 1-h averaging time (revised standard)
3.2 Spatial distribution of concentration indicators
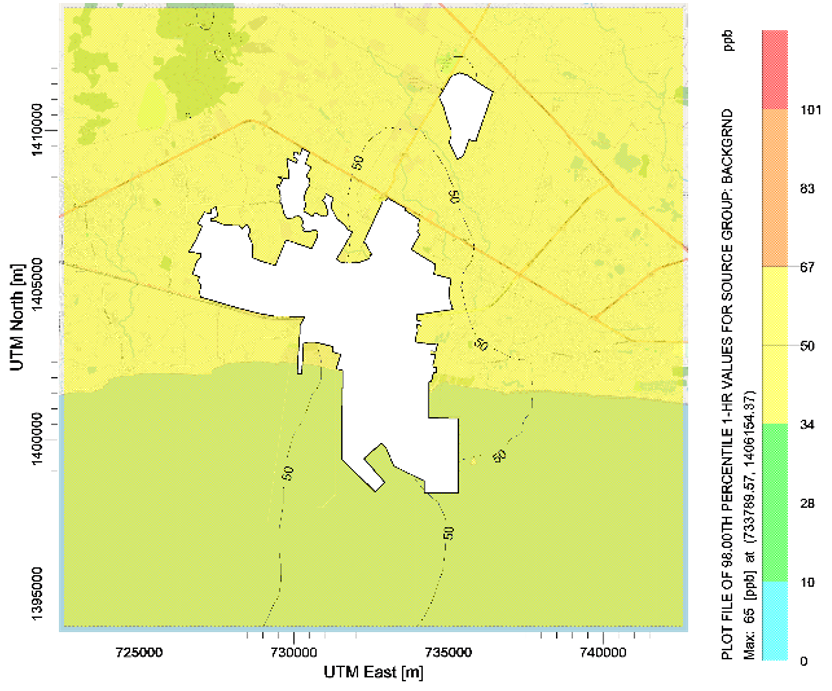
The spatial distribution of modeled concentrations provides additional context for compliance interpretation under the revised standards. For 1-h SO₂, the maximum concentration contour map (Figure 5) shows areas exceeding the revised standard of 100 ppb concentrated near major industrial emission sources, while the 98th percentile contour (Figure 6) remains well within compliance across the study domain. For 1-h NO₂, the maximum contour (Figure 7) similarly shows localized exceedance zones around key industrial sources under the revised standard of 120 ppb, whereas percentile-based contours (Figure 8) show more moderate distributions consistent with observed monitoring data. These spatial patterns further illustrate that the maximum indicator is disproportionately sensitive to the revised thresholds compared with percentile-based indicators.
Figure 5. Modelled SO₂ 1-h maximum concentration under the revised standard
Figure 6. Modelled SO₂ 1-h 98th percentile concentration under the revised standard
Figure 7. Modelled NO₂ 1-h maximum concentration under the revised standard
Figure 8. Modelled NO₂ 1-h 98th percentile concentration under the revised standard
3.3 Meteorological episode analysis of maximum concentration events
To provide context for the episodic nature of maximum concentration events, the meteorological conditions at the time of the 1-h NO₂ maximum were analyzed. The maximum modeled concentration of 352 ppb at receptor (728080 E, 1412954 N, Universal Transverse Mercator (UTM) Zone 47N) occurred on 1 October 2024 at 22:00 Local Standard Time (LST). Surface meteorological data from AERMET for this hour indicate: wind speed of 0.02 m/s, wind direction of 144° (from southeast), Pasquill-Gifford stability class E (slightly stable), mechanical mixing height of 10 m, and ambient temperature of 28.9 ℃. These stable nocturnal conditions severely restricted both vertical and horizontal dispersion, allowing emitted NOₓ to accumulate in a shallow layer near source locations. Source group analysis confirms that the modeled maximum concentration is physically consistent with the known industrial emission distribution in the study area, corroborating that the extreme event is driven by industrial point source emissions rather than background conditions. Review of the top-10 ranked hourly concentration records confirms that all maximum events occurred during late-night to early-morning hours (20:00-04:00 LST), corroborating the episodic and nocturnal nature of extreme concentration events at this site.
4.1 Indicator sensitivity and regulatory interpretation
This study demonstrates that the revised Thai ambient air quality standards substantially change compliance interpretations when maximum concentration is used as the sole indicator. As shown in Table 5, the Max/98th percentile ratios are large across all pollutants and averaging times, indicating that maximum values are disproportionately elevated relative to the distribution of modelled concentrations. For example, the Max/98th percentile ratio for 1-h SO₂ reached 4.5, while for 1-h NO₂ the Max/95th percentile ratio reached 5.0. Under the revised standard of 120 ppb, the maximum concentration (352 ppb) exceeds the limit by nearly three times, while the 98th and 95th percentile values (111 and 71 ppb respectively) remain well within compliance. These large ratios suggest that maximum values are driven by isolated extreme meteorological events and are therefore highly sensitive to the more stringent revised thresholds. This sensitivity raises the question of whether maximum concentration alone is a scientifically appropriate indicator for routine compliance assessment under the revised standards.
Table 5. Comparison of maximum to percentile concentration ratios for SO₂ and NO₂ (locally measured meteorological data, 2024)
|
Pollutant |
Averaging Time |
Ratio Type |
Value |
|
SO₂ |
1-h |
Max/98th |
4.5 |
|
|
|
Max/95th |
4.8 |
|
SO₂ |
24-h |
Max/98th |
1.4 |
|
|
|
Max/95th |
1.4 |
|
NO₂ |
1-h |
Max/98th |
3.2 |
|
|
|
Max/95th |
5.0 |
This pattern is further supported by observed monitoring data. Analysis of the one-year hourly SO₂ record showed that concentrations exceeding 100 ppb (the revised standard) occurred in only 3 out of 8,251 monitored hours (0.04%), and the peak of 345 ppb was an isolated single-hour spike. For NO₂, observed concentrations never exceeded the revised standard of 120 ppb throughout the entire monitoring period, with a recorded maximum of only 80 ppb. Concentrations above 10 ppb-a level well below the revised standard-represented only 0.6% of all NO₂ observations (50 out of 8,450 h), indicating that elevated NO₂ concentrations occur infrequently at this monitoring location. These distributions confirm that maximum concentration events are rare and isolated. The convergence of modeled percentile distributions and observed concentration frequency distributions as two independent lines of evidence consistently points to the same conclusion: that the maximum indicator reflects episodic extreme conditions rather than representative ambient air quality.
The use of percentile-based design values in air quality compliance assessment is consistent with international regulatory practice. US EPA [18] specifies that certain pollutant standards, such as the 24-h PM₂.₅ standard, are evaluated using the 98th percentile concentration rather than the absolute maximum, reflecting the principle that representative metrics better serve long-term air quality assessment. Such approaches reduce the disproportionate influence of isolated meteorological extremes on compliance outcomes. A recent AERMOD application in Bangkok by Ratanavalachai and Trivitayanurak [19] reported substantial differences between maximum and 99th-percentile modeled PM2.5 concentrations, with the hourly maxima occurring under unfavorable nighttime stagnant conditions. In the Thai context, the revised ambient air quality standards [8] represent a significant tightening of limits compared to those previously in force [9], making indicator selection more consequential than before. Prior dispersion modeling studies at Map Ta Phut by Chusai et al. [20] have demonstrated that spatial variability in NO₂ and SO₂ concentrations across industrial areas can produce substantial divergence between area-wide average and high-end concentration estimates, depending on emission source characteristics and receptor location.
4.2 Challenges and limitations
The revised standards are more stringent, which increases the importance of careful interpretation of model-based compliance results. In Thai EIA practice, modeled maximum concentrations are combined with background concentrations and compared with the applicable ambient air quality standards, as described in ONEP guidance [4]. Meteorological input quality remains an additional consideration in dispersion modeling, particularly with respect to data completeness and representativeness [21]. In the present study, maximum concentrations were substantially higher than the corresponding 98th and 95th percentile values, and the highest modeled events occurred under short-term unfavorable meteorological conditions. This pattern suggests that maximum-based compliance interpretation can be disproportionately influenced by episodic meteorological conditions, providing additional support for reporting percentile-based indicators alongside the maximum as complementary information in regulatory applications.
4.3 Uncertainty from ambient ozone data completeness and model monitor comparison
An additional source of uncertainty in this study relates to the completeness of ambient ozone (O₃) monitoring data used in the AERMOD Tier 3 PVMRM method for NO₂ modeling, as described by US EPA [10], Hanrahan [16], and Hendrick et al. [17]. The PVMRM approach estimates the in-plume conversion of emitted NOₓ to NO₂ using hourly ambient O₃ concentrations. When O₃ monitoring data contain missing hours, uncertainty is introduced in the estimated NO₂ concentrations, particularly at peak-event hours. Given that the revised NO₂ standard (120 ppb) is more stringent than the previous limit (170 ppb), this O₃-related uncertainty has heightened practical significance. It is therefore recommended that future EIA assessments ensure comprehensive and representative O₃ monitoring data [14] when applying the PVMRM method under the revised standards.
This study incorporates observed monitoring data as contextual evidence to support the interpretation of modeled concentration distributions, rather than as a formal model validation exercise against collocated measurements. Given the spatial separation of approximately 10 km between the maximum concentration receptor and Station 29T, spatiotemporally collocated comparison is not feasible. Instead, a statistical distribution comparison approach was adopted, in which the frequency distributions of modeled concentrations across all receptors and observed hourly concentrations at Station 29T were examined independently. This approach is consistent with the study's objective of assessing the representativeness of concentration indicators rather than evaluating model performance at a specific location.
Observed monitoring data from Station 29T (Maptaphut Health Promotion Hospital, UTM: 735173 E, 1405885 N) are presented as contextual evidence supporting the finding that maximum concentration events are episodic and rare in nature, not as a direct model validation benchmark. The station is located approximately 10 km southeast of the maximum concentration receptor (728080 E, 1412954 N). During the maximum NO₂ event (1 October 2024, 22:00 LST), the prevailing wind direction was 144° (southeast), placing the monitoring station in the upwind sector relative to the maximum receptor location, such that the station would not intercept the concentrated plume contributing to the modeled peak.
The revised Thai ambient air quality standards significantly affect compliance interpretation of AERMOD modeling results, particularly when the maximum concentration indicator is used as the sole basis for assessment. The results of this study demonstrate that maximum modeled concentrations of SO₂ and NO₂ are dominated by rare episodic meteorological events-characterized by near-calm winds, stable atmospheric conditions, and low mixing heights-and do not represent typical ambient air quality at the Map Ta Phut Industrial Complex. By contrast, the 98th and 95th percentile concentration values consistently remain within the revised regulatory thresholds, and observed monitoring data confirm that exceedances of the revised standards are extremely rare under actual ambient conditions. These findings do not challenge the legal validity of the revised standards, nor do they propose replacing the maximum concentration metric with percentiles. Rather, they demonstrate the scientific limitations of relying solely on maximum concentration for compliance assessment under the revised thresholds, and highlight the value of reporting percentile-based indicators alongside the maximum to provide a more complete and representative picture of ambient air quality. Based on these findings, it is recommended that: (1) EIA practitioners routinely report meteorological data completeness alongside model results; (2) percentile-based concentration indicators (98th or 95th percentile) be reported alongside the maximum to support more transparent and representative compliance interpretation; (3) ambient ozone (O₃) monitoring coverage be improved and data completeness be reported, particularly for sites applying the PVMRM method for NO₂ assessment; and (4) regulatory agencies consider providing formal guidance on the use of complementary concentration indicators under the revised ambient air quality standards in EIA applications [18], consistent with approaches adopted in international regulatory frameworks [2].
The authors wish to express their sincere gratitude to the Industrial Estate Authority of Thailand (IEAT) for providing the emission-related data and ambient air quality monitoring data that supported the analysis in this research.
|
ppb |
parts per billion, dimensionless |
|
MW |
molecular weight, g/mol |
|
T |
reference temperature, ℃ |
|
P |
reference pressure, atm |
[1] Jion, M.M.M.F., Jannat, J.N., Mia, M.Y., et al. (2023). A critical review and prospect of NO₂ and SO₂ pollution over Asia: Hotspots, trends, and sources. Science of the Total Environment, 876: 162851. https://doi.org/10.1016/j.scitotenv.2023.162851
[2] World Health Organization. (2021). WHO Global Air Quality Guidelines: Particulate Matter (PM2.5 and PM10), Ozone, Nitrogen Dioxide, Sulfur Dioxide and Carbon Monoxide. Geneva: World Health Organization. https://www.who.int/publications/i/item/9789240034228.
[3] Chen, Z.R., Liu, N.R., Tang, H., et al. (2022). Health effects of exposure to sulfur dioxide, nitrogen dioxide, ozone, and carbon monoxide between 1980 and 2019: A systematic review and meta-analysis. Indoor Air, 32(11): e13170. https://doi.org/10.1111/ina.13170
[4] Office of Natural Resources and Environmental Policy and Planning (ONEP). (2018). Guidelines for reviewing environmental impact assessment reports on air quality for industrial, petrochemical, and energy projects. https://doi.org/10.5281/zenodo.23610043
[5] Office of the Eastern Economic Corridor Policy Committee. (2020). Easy knowledge dissemination document on the AERMOD air dispersion model (Public version) . https://doi.org/10.5281/zenodo.23610473
[6] Malakan, W., Keawboonchu, J., Thepanondh, S. (2018). Comparison of AERMOD performance using observed and prognostic meteorological data. EnvironmentAsia, 11(2): 38-52. https://doi.org/10.14456/ea.2018.21
[7] Jittra, N., Thepanondh, S. (2015). Performance evaluation of AERMOD air dispersion model in Maptaphut industrial area, Thailand. In Environmental Science and Information Application Technology. Conference, Wuhan, China, pp. 225-228. https://doi.org/10.1201/b18559-38
[8] National Environment Board. (2026). Notification of the national environment board: Establishment of general ambient air quality standards. Royal Gazette, 143(Special Issue 20 Ng): 20-24. https://ratchakitcha.soc.go.th/documents/101995.pdf.
[9] Pollution Control Department (PCD). (2021). National ambient air quality standards. Bangkok, Thailand: Air Quality and Noise Management Division, Pollution Control Department. https://doi.org/10.5281/zenodo.23610519
[10] US EPA. (2026). AERMOD model formulation document. EPA-454/B-26-003. United States Environmental Protection Agency. https://gaftp.epa.gov/aqmg/SCRAM/models/preferred/aermod/aermod_mfd.pdf.
[11] Cimorelli, A.J., Perry, S.G., Venkatram, A., et al. (2005). AERMOD: A dispersion model for industrial source applications. Part I: General model formulation and boundary layer characterization. Journal of Applied Meteorology, 44(5): 682-693. https://doi.org/10.1175/JAM2227.1
[12] Perry, S.G., Cimorelli, A.J., Paine, R.J., et al. (2005). AERMOD: A dispersion model for industrial source applications. Part II: Model performance against 17 field study databases. Journal of Applied Meteorology, 44(5): 694-708. https://doi.org/10.1175/JAM2228.1
[13] US EPA. (2000). Meteorological monitoring guidance for regulatory modeling applications. United States Environmental Protection Agency. https://www.epa.gov/sites/default/files/2020-10/documents/mmgrma_0.pdf.
[14] US EPA. (2019). NO₂ modeling techniques. United States Environmental Protection Agency. https://www.epa.gov/sites/default/files/2021-01/documents/no2_modeling_techniques_white_paper.pdf.
[15] Office of the Eastern Economic Corridor Policy Committee. (2020). Study report on the status of air pollution management in the Map Ta Phut industrial area, industrial expansion potential based on the area's air-quality carrying capacity, and policy recommendations for sustainable industrial development in Map Ta Phut. https://doi.org/10.5281/zenodo.23610638
[16] Hanrahan, P.L. (1999). The plume volume molar ratio method for determining NO₂/NOₓ ratios in modeling—part I: Methodology. Journal of the Air & Waste Management Association, 49(11): 1324-1331. https://doi.org/10.1080/10473289.1999.10463960
[17] Hendrick, E.M., Tino, V.R., Hanna, S.R., Egan, B.A. (2013). Evaluation of NO₂ predictions by the plume volume molar ratio method (PVMRM) and ozone limiting method (OLM) in AERMOD using new field observations. Journal of the Air & Waste Management Association, 63(7): 844-854. https://doi.org/10.1080/10962247.2013.798599
[18] US EPA. (2017). Revisions to the guideline on air quality models: Enhancements to the AERMOD dispersion modeling system and incorporation of approaches to address ozone and fine particulate matter. Federal Register, 82(10): 5182-5235. https://www.govinfo.gov/content/pkg/FR-2017-01-17/pdf/2016-31747.pdf.
[19] Ratanavalachai, T., Trivitayanurak, W. (2023). Application of a PM2.5 dispersion model in the Bangkok central business district for air quality management. Frontiers in Environmental Science, 11: 1237366. https://doi.org/10.3389/fenvs.2023.1237366
[20] Chusai, C., Manomaiphiboon, K., Saiyasitpanich, P., Thepanondh, S. (2012). NO₂ and SO₂ dispersion modeling and relative roles of emission sources over Map Ta Phut industrial area, Thailand. Journal of the Air & Waste Management Association, 62(8): 932-945. https://doi.org/10.1080/10962247.2012.687704
[21] Bayraktar, O.M., Mutlu, A. (2024). Analyses of industrial air pollution and long-term health risk using different dispersion models and WRF physics parameters. Air Quality, Atmosphere & Health, 17(10): 2277-2305. https://doi.org/10.1007/s11869-024-01573-8