Interactive Associations of Sampled Fish Condition and Commercial Size Class with Mackerel Scad (Decapterus macarellus) Packing Density in a Small-Scale Simulated Fish Hold

Agus Tumulyadi* | Mihrobi Rihmi | Eko Sulkhany | Fuad | Sunardi | Muammar Kadhafi
© 2026 The authors. This article is published by IIETA and is licensed under the CC BY 4.0 license (http://creativecommons.org/licenses/by/4.0/).
OPEN ACCESS
Efficient fish-hold design requires an accurate understanding of how biological form and post-harvest condition govern the use of confined storage space. This study quantified the association of sampled fish condition and commercial size class with the packing density of mackerel scad (Decapterus macarellus) under small-scale simulated storage conditions. A two-factor comparative packing study evaluated freshly landed, non-frozen fish from the most recent catch and frozen fish obtained from mechanically refrigerated holds containing earlier catches across small, medium, and large commercial size classes. Six treatment combinations were evaluated in a styrofoam simulation container with internal dimensions of 47 × 32.5 × 28 cm and a calculated volume of 0.04277 m³, with 30 packing measurements per treatment and 180 observations in total. Under the classical two-way analysis of variance and heteroscedasticity-consistent HC3 tests, significant terms were identified for sampled condition, commercial size class, and their interaction (all p < 0.001). Fresh-small fish achieved the highest density at 0.5937 t m-³, followed by frozen-small fish at 0.5914 t m-³, whereas frozen-medium and frozen-large fish produced the lowest values at 0.5546 and 0.5562 t m-³, respectively. These preliminary container-derived coefficients indicate that a single species-wide value may conceal condition–size variation. Full-scale validation, measurement-uncertainty assessment, and vessel-specific usable-volume calibration are required before operational application.
fish-hold design, mackerel scad, packing density, size–condition interaction, storage-space efficiency
Accurate conversion between occupied storage volume and fish biomass is increasingly important for fisheries operations, landing verification, and the design of efficient fish-hold systems. In high-volume fisheries, direct weighing may be constrained by rapid unloading, limited port infrastructure, vessel heterogeneity, and incomplete separation of species or size classes. Under these conditions, packing density and stowage factor provide a practical bridge between observed volume and estimated weight. Packing density expresses fish mass per unit of occupied volume, whereas the conventional stowage factor expresses the volume required per unit mass. Published values show that these coefficients vary with fish species, product condition, size, and form [1, 2]. Their reliability, however, depends on how well the adopted coefficient represents the actual species, body-size distribution, storage medium, and packing arrangement. Applying a generic value across different biological and operational conditions can therefore introduce systematic bias into landing statistics and catch-volume verification. Accordingly, volume-based estimates should be treated as supplementary checks rather than replacements for direct weighing and established catch-monitoring systems [3].
Packing density is also relevant to the engineering design of fishing-vessel storage because nominal hold volume does not necessarily represent usable capacity. Insulation, structural members, partitions, refrigeration equipment, access spaces, and irregular internal geometry can reduce the effective volume available for fish. In addition, operational capacity is shaped by crew packing practices, fish arrangement, cooling systems, and safety constraints. Hold-planning studies consequently emphasize the need to combine realistic usable volume with context-specific density coefficients rather than treating capacity as a simple geometric quantity [4-6]. Therefore, engineering estimates of fish-hold capacity should distinguish nominal geometric volume from usable storage volume and account for the cooling and handling system employed.
The principal research problem is that fish cargo does not behave like a homogeneous industrial bulk material. Individual fish differ in body length, mass, curvature, cross-sectional geometry, and deformability, creating variable interstitial voids within the same container or hold. Smaller and more streamlined fish may occupy narrow spaces between adjacent individuals, whereas larger fish may produce different packing configurations because their dimensions restrict the number of possible orientations within a fixed space. Morphology and size distribution therefore influence the effective mass that can be accommodated within a fixed storage volume. Direct fish-stowage studies have consequently reported variation associated with species, fish size, physical condition, and packing arrangement [2, 7].
Physical condition further complicates the mass–volume relationship. In packing terms, fresh fish may retain greater flexibility and capacity for positional adjustment, whereas frozen fish may exhibit greater rigidity and altered body form. These responses provide a plausible explanation for differences in packing configuration. Freezing and refrigerated storage can alter tissue texture, microstructure, water distribution, thawing loss, and measured body shape [8-10]. Temperature, moisture retention, drip loss, and storage duration can also modify both fish mass and body mechanics. Cooling media such as ice, brine, refrigerated seawater, or slurry ice additionally occupy volume and alter the proportion of a hold available for fish, meaning that packing density cannot be interpreted independently of the storage environment [6, 11].
A practical approach is to derive empirical packing-density coefficients under clearly defined biological and operational conditions. A two-stage framework can be used: first, the effective usable volume of a storage space is determined by accounting for geometry and internal obstructions; second, an experimentally derived density coefficient is applied to estimate biomass [1, 4, 6]. This approach supports the equation $\left(\hat{M}=\rho_p V_u\right)$, where $\hat{M}$ is estimated fish mass (t), $\rho_p$ is packing density $\left(\mathrm{t}\ \mathrm{m}^{-3}\right)$, and $V_u$ is the usable volume occupied by fish $\left(\mathrm{m}^3\right)$. Standardized filling patterns are required so that the resulting coefficient reflects biological and storage effects rather than uncontrolled differences in orientation or layering [2, 7].
Controlled container-based experiments provide a means of examining associations between fish characteristics and packing density under fixed container geometry. By maintaining constant container dimensions and cooling-media conditions, such experiments can reduce geometric variation, although packing outcomes may remain influenced by fish orientation, layering, temperature, sample provenance, and possible fish reuse. Previous studies have shown that hold geometry, packing configuration, storage medium, temperature, fish morphology, and size distribution can influence effective storage capacity [1, 2, 4, 6]. Empirical stowage-factor studies have documented variation among fish species, while a box- and CAD-based investigation of Indian scad (Decapterus russelli) demonstrated that fish condition, size category, and packing arrangement can be incorporated into fish-hold space modelling [2, 7]. Nevertheless, controlled species-specific evidence remains limited regarding the joint association of sampled physical condition and commercial size class with the packing density of mackerel scad (Decapterus macarellus) under fixed container geometry. The research gap therefore concerns the limited evaluation of condition-by-size variation for this species and the absence of full-scale validation of container-derived coefficients, rather than a general absence of fish-stowage research.
This study therefore aimed to quantify the associations of sampled fish condition and commercial size class, including their statistical interaction, with the packing density of mackerel scad (Decapterus macarellus) in a standardized 0.04277 m³ container. Fresh and frozen fish were classified into small, medium, and large commercial size classes and evaluated using a two-factor comparative packing design. It was hypothesized that the sampled fresh-fish group would have a higher packing density than the sampled frozen-fish group, that smaller fish would achieve a higher packing density than larger fish, and that the difference between sampled conditions would vary among size classes. Because condition was not experimentally assigned and the fresh and frozen groups originated from different catch and storage histories, the comparisons were interpreted as associations between sampled groups rather than as isolated causal effects of freezing. The study contributes a species-specific assessment of the sampled-condition × commercial-size-class interaction for D. macarellus within a fixed small-scale container geometry. The resulting coefficients are presented as preliminary container-derived estimates requiring validation, and their potential use in fish-hold capacity planning or supplementary catch verification remains conditional on comparisons with measured usable hold volumes and calibrated catch weights under full-scale operational conditions.
2.1 Study area and research period
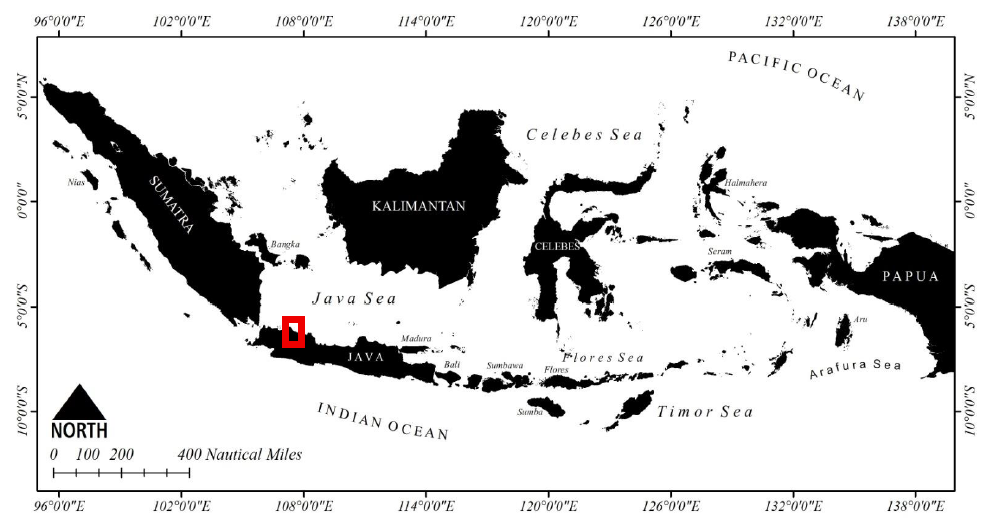
The study was conducted over 15 field-survey days from January to February 2026 at Nizam Zachman Ocean Fishing Port, Muara Baru, Jakarta, Indonesia. Field observations were conducted on two different purse-seine vessels each survey day, resulting in an observational sample of 30 vessels. This port was selected because it is a major landing centre for purse-seine fisheries and receives substantial quantities of mackerel scad, Decapterus macarellus. The observed fleet comprised medium- to large-scale wooden and fiberglass purse-seine vessels, generally measuring approximately 20–40 m in length and 4–8 m in breadth, with capacities predominantly ranging from 150 to 300 GT [12]. Field observations covered vessel characteristics, fishing-trip duration, fish-handling practices, refrigeration systems, hold configuration, and catch arrangement during storage. Particular attention was given to mechanically refrigerated vessels that stored fish without added ice because this arrangement permitted the fish mass–volume relationship to be examined without the additional mass and volume contributed by ice or another cooling medium. The study location and sampling site are presented in Figure 1.
Figure 1. Location of Nizam Zachman Ocean Fishing Port and research sampling site
The vessel observations provided the operational context for the small-scale packing procedure but were not used as vessel-level blocks in the statistical analysis. The available packing dataset did not retain a measurement-level link between the 30 observed vessels and the 180 packing measurements. Vessel observations were used only to describe the operational context and were not linked to individual packing measurements.
2.2 Research design
A two-factor comparative packing design was used to evaluate differences in packing density associated with sampled fish condition and commercial size class. The first factor was sampled condition, comprising fresh and frozen fish, whereas the second factor comprised three commercial size classes: small, medium, and large. The combination of both factors produced six sampled-condition–size groups. Thirty packing measurements were recorded for each group, resulting in 180 packing measurements in total.
Fish condition was not experimentally assigned to matched individuals from the same catch. The fresh and frozen groups represented fish obtained under their respective observed landing and storage conditions and may therefore have differed in catch time, storage duration, temperature history, or other unmeasured characteristics. Accordingly, the design was treated as a comparative packing study rather than a controlled freezing experiment. The analysis estimated differences between the sampled fresh and frozen groups and examined whether these differences varied among commercial size classes.
Vessel identity and fish-batch identity were not retained for each individual packing measurement in the available dataset. The measurements were therefore not treated as vessel-blocked or matched-vessel observations. The treatment combinations and number of packing measurements are summarized in Table 1.
Table 1. Sampled-condition and commercial-size-class combinations and numbers of packing measurements
|
Sampled Condition |
Commercial Size Class |
Combination Code |
Packing Measurements, n |
|
Fresh |
Small |
FS |
30 |
|
Fresh |
Medium |
FM |
30 |
|
Fresh |
Large |
FL |
30 |
|
Frozen |
Small |
FRS |
30 |
|
Frozen |
Medium |
FRM |
30 |
|
Frozen |
Large |
FRL |
30 |
|
Total |
180 |
2.3 Fish samples and size classification
Mackerel scad samples were obtained from purse-seine catches landed at the port and were selected using purposive criteria. Only intact individuals without substantial physical damage were included to reduce variation associated with tissue loss or abnormal body deformation. The fresh group comprised fish that had not undergone freezing, whereas the frozen group comprised fish obtained after mechanically refrigerated storage. The source records did not retain the catch, vessel, fishing date, fishing ground, storage duration, or temperature history for the individual fresh and frozen packing measurements. The groups could therefore not be confirmed as matched samples from the same catches. Accordingly, “sampled condition” is used throughout the manuscript, and observed differences are not attributed exclusively to freezing.
Each specimen was identified as D. macarellus and assigned to small, medium, or large categories according to the commercial sorting system used during landing operations. The commercial classification was validated using a separate sample of 30 fish per size category. The retained records provide observed total-length and body-mass ranges of 15–19 cm and 69–86 g for small fish, 20–25 cm and 122–241 g for medium fish, and 26–38 cm and 246–408 g for large fish. These values are ranges rather than means.
Individual biometric records from the validation fish were not retained, and condition-specific means and standard deviations for total length and body mass could not be reconstructed. Body depth and maximum body width were also not recorded. Consequently, the available biometric information confirms separation among the three commercial size classes but does not demonstrate fresh–frozen comparability within each size class.
2.4 Field observation and data collection
Direct observations and operational consultations with fishers, vessel masters, landing workers, and port personnel were used to document onboard storage practices. Observations covered 30 different purse-seine vessels, with two vessels examined per day over 15 field-survey days. Within the observed vessel sample, the purse-seine vessels undertook multi-day fishing trips and generally used approximately 13–15 mechanically refrigerated holds with reported individual capacities of about 4–10 t. Catches were separated by species and commercial size before being stacked within the holds. These characteristics describe only the vessels included in the survey and should not be generalized to all purse-seine vessels operating at the port.
The consultations were used to clarify hold configuration, cooling practices, catch sorting, and stacking procedures. Because the source records did not retain respondent numbers, a structured interview instrument, or respondent-level transcripts, this component is described as operational consultation rather than a formal interview survey. The consultations were used only to document operational practices and were not analysed as a formal interview survey.
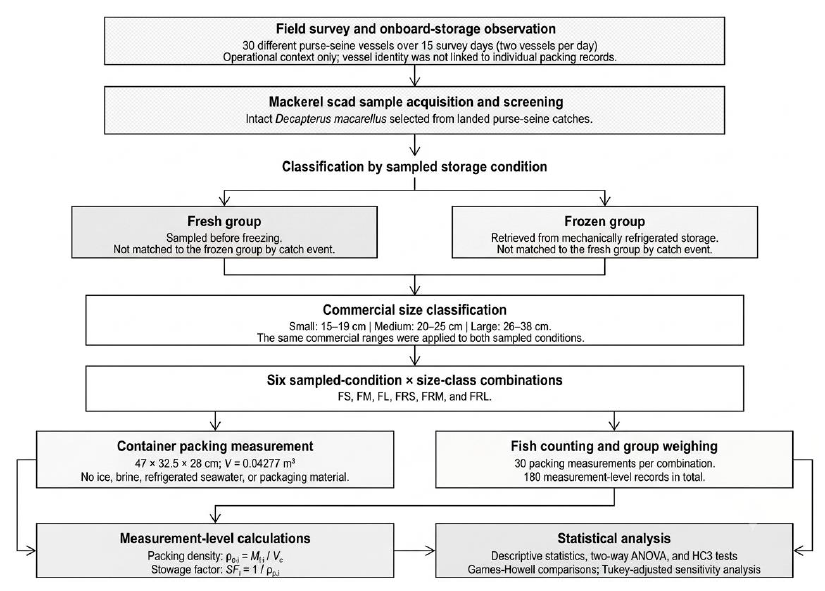
These observations provided the operational basis for selecting sampled condition and commercial size class as comparison factors and for adapting the observed stacking arrangement to the small-scale container procedure. The complete sequence of field observation, sample classification, packing measurements, weighing, calculation, and statistical analysis is shown in Figure 2.
Figure 2. Workflow of field observation, fish selection and classification, container packing, weighing, packing-density calculation, and statistical analysis
2.5 Fish-hold storage observation and simulation procedure
Packing measurements were conducted using a rectangular styrofoam container with internal dimensions of 47 × 32.5 × 28 cm and a calculated internal volume of 0.04277 m³. The value was rounded to 0.043 m³ for descriptive presentation, but 0.04277 m³ was used in the packing-density calculations. The fixed geometry allowed comparisons among sampled-condition–size combinations without variation in container dimensions. It did not isolate all biological effects because fish provenance, storage history, and individual morphology were not fully controlled. Actual vessel holds may also contain insulation, partitions, frames, refrigeration components, curved surfaces, and inaccessible spaces that reduce the volume available for catch storage [1, 2].
The container represented a small-scale simulation rather than a geometrically scaled vessel hold. Based on the reported total-length ranges, the fish-length-to-container-length ratio was 0.319–0.404 for small fish, 0.426–0.532 for medium fish, and 0.553–0.809 for large fish. Large fish therefore occupied a substantial proportion of the 47-cm container length and had fewer possible orientations. The observed size pattern may consequently reflect both fish size and the fish-to-container dimension ratio. Corresponding width and depth ratios could not be calculated because maximum body width and body depth were not recorded.
For each packing measurement, fish from one sampled-condition–size combination were selected, counted, and weighed as a group using a digital scale with a reported resolution of 0.01 kg. The fish were then arranged in the container following the stacking pattern observed during field data collection. No ice, brine, refrigerated seawater, slurry ice, or packaging material was added. The recorded fish count and net fish mass represented the fish accommodated within the fixed container volume for that measurement. The container was emptied before the next measurement, and the procedure was repeated until 30 packing measurements had been recorded for each of the six combinations. The complete fish count and net fish mass for every measurement are provided in Supplementary Data S1.
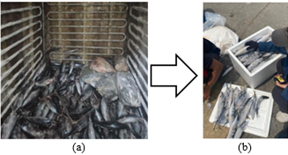
The mechanically refrigerated hold and the observed arrangement of fish in the simulation container are shown in Figure 3. The source records did not retain a fixed head–tail orientation, number of layers, permitted manual pressure, objective filling endpoint, operator identity, treatment order, or information on whether the same fish were reused across measurements. Consequently, these aspects of the packing protocol could not be evaluated retrospectively. The records are therefore described as packing measurements rather than verified independent biological replicates. This limitation is considered when interpreting the inferential results.
The scale manufacturer, model, maximum capacity, calibration record, empty-container mass, and repeat-weighing error were not retained in the source documentation. Only the 0.01 kg resolution of the scale used for total fish mass was documented. At the measured container volume, one 0.01 kg resolution increment corresponds to approximately 0.000234 t m⁻³:
$\Delta \rho_{\text {resolution }}=\frac{0.01 / 1000}{0.04277}=0.000234\ \mathrm{t}\ \mathrm{m}^{-3}$
This nominal resolution is approximately one-tenth of the smallest difference between group means, about 0.00233 t m⁻³. Nevertheless, a complete combined measurement uncertainty could not be calculated because scale calibration, repeatability, empty-container uncertainty, and dimensional-measurement precision were unavailable. The resolution calculation should therefore not be interpreted as a complete uncertainty analysis.
2.6 Packing-density calculation and statistical analysis
Packing density was calculated separately for each of the 180 packing measurements as:
$\rho_{p, i}=\frac{M_{f, i}}{V_c}$
where, $\rho_{p, i}$ is the packing density of measurement $i$, expressed in $\mathrm{t}\ \mathrm{m}^{-3}; M_{f, i}$ is the net fish mass in tonnes; and $V_c$ is the measured internal container volume of $0.04277 \mathrm{~m}^3$. Net fish mass was calculated as:
$M_{f, i}=\frac{M_{f, i(\mathrm{~kg})}}{1000}$
Calculations used the recorded fish mass and unrounded container volume; values were rounded only for presentation. Supplementary Data S1 provides both the source-reported density and the density recalculated from net fish mass and $V_c$.
The conventional stowage factor was calculated for each packing measurement before group-level summarization as the reciprocal of packing density:
$S F_i=\frac{1}{\rho_{p, i}}=\frac{V_c}{M_{f, i}}$
wwhere, $S F_i$ is expressed in $\mathrm{m}^3 \mathrm{t}^{-1}$. For each sampled-condition-size combination, the trial-level $S F_i$ values were summarized using the mean, standard deviation, and 95% confidence interval. The mean of the individual reciprocals was distinguished from the reciprocal of the mean packing density because the reciprocal transformation is nonlinear:
$\overline{(S F)}_g=\frac{1}{n_g} \sum_{i=1}^{n_g} \frac{1}{\rho_{p, i}} \neq \frac{1}{\bar{\rho}_{p, g}}$
Descriptive statistics were calculated for each sampled-condition–size combination and reported as the mean, standard deviation, standard error, 95% confidence interval, and observed range. A two-way analysis of variance evaluated differences in packing density associated with sampled condition, commercial size class, and their interaction, using α = 0.05. Partial eta squared $\left(\eta_p^2\right)$ was calculated for the sampled-condition, size-class, and interaction terms. Because sampled condition was not assigned to matched fish, these terms describe statistical differences or associations and not an experimentally isolated effect of freezing.
The availability of the 180 measurement-level records permitted the statistical analysis to be reconstructed. Residual normality was assessed using a Q–Q plot and the Shapiro–Wilk test, while variance homogeneity was assessed using Levene’s test across the six sampled-condition–size combinations. All 180 measurements were retained, and no observations were excluded after inspection. The reconstructed residuals did not show a statistically significant departure from normality, whereas Levene’s test indicated unequal group variances.
Because variance homogeneity was not supported, the conventional factorial ANOVA was retained to reproduce the original balanced-design analysis, but heteroscedasticity-consistent HC3 Wald tests were used as a sensitivity analysis. When the condition × size interaction was significant, interpretation focused on simple effects: differences between sampled fresh and frozen groups within each size class and differences among size classes within each sampled condition. Because homogeneity of variance was not supported, the classical two-way ANOVA was retained for comparison with the original analysis, while HC3 heteroscedasticity-consistent tests were used to evaluate the robustness of the factorial terms. Games–Howell comparisons were used for the primary pairwise interpretation, whereas Tukey-adjusted comparisons were retained as a sensitivity analysis.
Statistical analyses were conducted using Python 3.12.13, NumPy 2.3.5, and SciPy 1.17.0. The source-reported and recalculated measurement-level data, group summaries, trial-level reciprocal-density values, and ANOVA verification are provided in Supplementary Data S1. These records permit numerical reproduction of the descriptive statistics, ANOVA, pairwise comparisons, and interaction plots. However, unique-fish, fish-reuse, vessel, and sample-batch identifiers remain unavailable; therefore, biological independence and vessel-level clustering cannot be verified retrospectively. The inferential results are interpreted as preliminary evidence from the small-scale packing measurements.
3.1 Onboard fish-hold storage and observed sample conditions
Field observations were conducted on 30 different purse-seine vessels over 15 survey days, with two vessels observed per day at Nizam Zachman Ocean Fishing Port. The observed vessels comprised medium- to large-scale purse seiners, generally measuring approximately 20–40 m in length and 4–8 m in breadth and predominantly falling within the 150–300 GT range. These vessels undertook multi-day fishing trips and used mechanically refrigerated fish holds. Within the observed vessel sample, catches were stored without ice as the principal cooling medium and were separated by species and commercial size before being placed directly in the holds. The vessels had approximately 13–15 holds, with reported individual capacities of about 4–10 t. These findings describe only the 30 vessels included in the field survey and should not be interpreted as representing all purse-seine vessels operating at the port. Vessel-level internal hold dimensions, refrigeration obstructions, and usable storage volumes were not systematically measured; consequently, nominal and effective hold capacities could not be compared quantitatively.
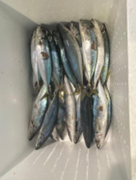
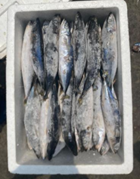
The sampled fresh and frozen mackerel scad showed descriptive differences in external appearance and posture during handling. Fresh samples generally appeared glossier, retained more natural coloration, and were less fixed in posture, whereas frozen samples appeared paler, had reduced surface gloss, and retained a comparatively fixed posture. Figure 4 presents representative samples of the two observed conditions. These observations were qualitative and were not supported by mechanical rigidity, deformation, tissue-density, or interstitial-void measurements. Core temperature, freezing temperature and rate, storage duration, surface frost or glaze, thawing, and drip loss were also not retained in the source dataset. The terms “fresh” and “frozen” therefore identify the observed storage status of the sampled groups rather than standardized thermodynamic treatments.
Figure 4. Representative external appearance of sampled fresh and frozen mackerel scad (Decapterus macarellus) used in the packing measurements
3.2 Commercial size classes and biometric ranges of experimental fish
The experimental fish were assigned to three commercial size classes used during routine catch sorting at the study port. The source report retained classification data from 30 fish in each size class. Small fish ranged from 15 to 19 cm in total length and from 69 to 86 g in individual body mass (Table 2). Medium fish ranged from 20 to 25 cm and from 122 to 241 g, whereas large fish ranged from 26 to 38 cm and from 246 to 408 g. The same commercial ranges were applied to the sampled fresh and frozen groups. However, the retained data consisted only of category-level ranges rather than individual biometric records separated by sampled condition. Accordingly, condition-specific means and standard deviations could not be calculated, and comparability between fresh and frozen fish within each size class could not be tested. Body depth and maximum body width were not recorded. The categories should therefore be interpreted as commercial classification ranges rather than complete morphometric descriptions of the fish included in all packing measurements.
Table 2. Commercial size-class ranges and packing measurements for sampled fresh and frozen mackerel scad
|
Sampled Condition |
Size Class |
Total Length Range (cm) |
Individual Body Mass Range (g) |
Packing Measurements, n |
|
Fresh |
Small |
15–19 |
69–86 |
30 |
|
Fresh |
Medium |
20–25 |
122–241 |
30 |
|
Fresh |
Large |
26–38 |
246–408 |
30 |
|
Frozen |
Small |
15–19 |
69–86 |
30 |
|
Frozen |
Medium |
20–25 |
122–241 |
30 |
|
Frozen |
Large |
26–38 |
246–408 |
30 |
3.3 Packing density and conventional stowage factor
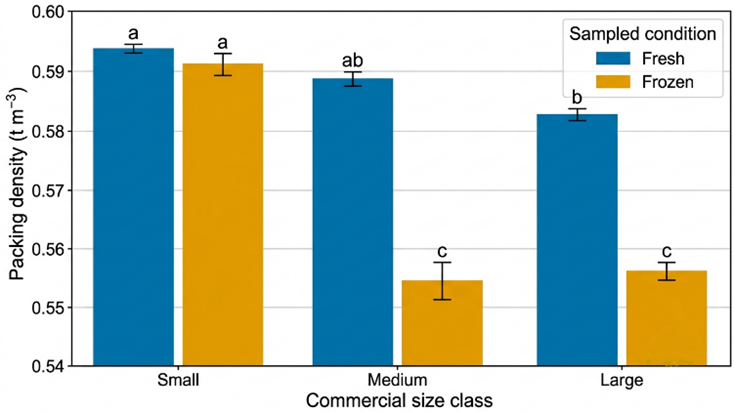
Packing density varied among the six sampled condition–size combinations. Fresh-small fish produced the highest mean packing density, at 0.5937 ± 0.0043 t m⁻³, followed by frozen-small fish at 0.5914 ± 0.0117 t m⁻³. Fresh-medium and fresh-large fish produced mean values of 0.5887 ± 0.0103 and 0.5829 ± 0.0083 t m⁻³, respectively. The lowest mean was recorded for frozen-medium fish at 0.5546 ± 0.0118 t m⁻³, followed by frozen-large fish at 0.5562 ± 0.0071 t m⁻³. These values were recalculated from the fish mass recorded for each of the 180 packing measurements using the exact internal container volume of 0.04277 m³.
The conventional stowage factor was calculated separately for every packing measurement before the group means and standard deviations were calculated. Mean stowage factors ranged from 1.6844 ± 0.0121 m³ t⁻¹ for fresh-small fish to 1.8039 ± 0.0379 m³ t⁻¹ for frozen-medium fish. Combinations with a greater fish mass per unit container volume consequently had lower stowage factors. Frozen-small fish had the broadest observed packing-density interval, from 0.5714 to 0.6175 t m⁻³, whereas fresh-small fish had the smallest within-group standard deviation. Table 3 reports the mean, standard deviation, 95% confidence interval, and observed range for packing density, together with the corresponding trial-level stowage-factor statistics.
3.4 Associations of sampled condition, size class, and their interaction with packing density
Residual normality was not rejected by the Shapiro–Wilk test (W = 0.9887, p = 0.163), whereas homogeneity of variance was rejected by the median-centred Levene test, F(5, 174) = 6.975, p < 0.001. The classical two-way analysis of variance identified significant terms for sampled condition, F(1, 174) = 229.975, p < 0.001; commercial size class, F(2, 174) = 112.639, p < 0.001; and the sampled condition × size-class interaction, F(2, 174) = 48.212, p < 0.001. The heteroscedasticity-consistent HC3 tests produced the same statistical inference for sampled condition, F(1, 174) = 222.309, p < 0.001; commercial size class, F(2, 174) = 124.239, p < 0.001; and their interaction, F(2, 174) = 46.772, p < 0.001 (Table 4). The partial eta-squared values were 0.569, 0.564, and 0.357 for sampled condition, commercial size class, and their interaction, respectively.
The descriptive marginal mean packing density was 0.5884 t m⁻³ for the sampled fresh group and 0.5674 t m⁻³ for the sampled frozen group. Across sampled conditions, the descriptive marginal means were 0.5926, 0.5717, and 0.5695 t m⁻³ for small, medium, and large fish, respectively. However, these marginal means should not be interpreted as uniform condition or size effects because the sampled condition × size-class interaction was significant. Interpretation therefore focused on comparisons among the six sampled condition–size combinations.
The interaction pattern is presented in Figure 5. Within the sampled fresh group, mean packing density decreased from 0.5937 t m⁻³ for small fish to 0.5887 t m⁻³ for medium fish and 0.5829 t m⁻³ for large fish. Within the sampled frozen group, mean packing density decreased sharply from 0.5914 t m⁻³ for small fish to 0.5546 t m⁻³ for medium fish and then increased slightly to 0.5562 t m⁻³ for large fish. The fresh–frozen mean difference was 0.0023 t m⁻³ in the small class, 0.0341 t m⁻³ in the medium class, and 0.0267 t m⁻³ in the large class. This non-parallel response was consistent with the significant sampled condition × size-class interaction. Because the fresh and frozen groups were not matched by catch event and condition was not experimentally assigned, these contrasts represent differences between the sampled groups rather than isolated causal effects of freezing.
Table 3. Packing density and trial-level conventional stowage factor of mackerel scad according to sampled condition and commercial size class
|
Sampled Condition |
Size Class |
Packing Measurements (n) |
Packing Density, Mean ± SD (t m⁻³) |
95% CI (t m⁻³) |
Observed Range (t m⁻³) |
Trial-level Stowage Factor, Mean ± SD (m³ t⁻¹) |
95% CI (m³ t⁻¹) |
|
Fresh |
Small |
30 |
0.5937 ± 0.0043 |
0.5921–0.5953 |
0.5869–0.6035 |
1.6844 ± 0.0121 |
1.6799–1.6889 |
|
Fresh |
Medium |
30 |
0.5887 ± 0.0103 |
0.5849–0.5926 |
0.5693–0.6049 |
1.6991 ± 0.0299 |
1.6880–1.7103 |
|
Fresh |
Large |
30 |
0.5829 ± 0.0083 |
0.5798–0.5860 |
0.5728–0.5981 |
1.7160 ± 0.0243 |
1.7069–1.7251 |
|
Frozen |
Small |
30 |
0.5914 ± 0.0117 |
0.5871–0.5958 |
0.5714–0.6175 |
1.6914 ± 0.0331 |
1.6791–1.7038 |
|
Frozen |
Medium |
30 |
0.5546 ± 0.0118 |
0.5502–0.5590 |
0.5408–0.5761 |
1.8039 ± 0.0379 |
1.7898–1.8181 |
|
Frozen |
Large |
30 |
0.5562 ± 0.0071 |
0.5535–0.5588 |
0.5410–0.5658 |
1.7982 ± 0.0231 |
1.7896–1.8069 |
Table 4. Classical two-way analysis of variance and heteroscedasticity-consistent HC3 tests for mackerel scad packing density
|
Source of Variation |
df |
Sum of Squares |
Mean Square |
Conventional (F) |
Conventional (p) |
Partial ηp² |
HC3 Robust (F) |
Robust (p) |
|
Sampled condition |
1 |
0.019877 |
0.019877 |
229.975 |
<0.001 |
0.569 |
222.309 |
<0.001 |
|
Commercial size class |
2 |
0.019471 |
0.009735 |
112.639 |
<0.001 |
0.564 |
124.239 |
<0.001 |
|
Sampled condition × size class |
2 |
0.008334 |
0.004167 |
48.212 |
<0.001 |
0.357 |
46.772 |
<0.001 |
|
Residual error |
174 |
0.015039 |
0.000086 |
— |
— |
— |
— |
— |
|
Corrected total |
179 |
0.062720 |
— |
— |
— |
— |
— |
— |
Table 5. Tukey-adjusted and Games–Howell simple-effect comparisons of mackerel scad packing density within size classes and sampled conditions
|
Simple-effect Comparison |
Mean Difference (t m⁻³) |
Tukey 95% CI |
Tukey-adjusted (p) |
Games–Howell 95% CI |
Games–Howell (p) |
Interpretation |
|
Fresh-small − Frozen-small |
0.0023 |
-0.0047 to 0.0092 |
0.935 |
-0.0046 to 0.0091 |
0.916 |
Not significant |
|
Fresh-medium − Frozen-medium |
0.0341 |
0.0272 to 0.0410 |
<0.001 |
0.0257 to 0.0426 |
<0.001 |
Fresh-medium higher |
|
Fresh-large − Frozen-large |
0.0267 |
0.0197 to 0.0336 |
<0.001 |
0.0208 to 0.0325 |
<0.001 |
Fresh-large higher |
|
Fresh-small − Fresh-medium |
0.0050 |
-0.0019 to 0.0119 |
0.304 |
-0.0011 to 0.0111 |
0.167 |
Not significant |
|
Fresh-small − Fresh-large |
0.0108 |
0.0039 to 0.0178 |
<0.001 |
0.0058 to 0.0159 |
<0.001 |
Fresh-small higher |
|
Fresh-medium − Fresh-large |
0.0059 |
-0.0011 to 0.0128 |
0.148 |
-0.0013 to 0.0130 |
0.166 |
Not significant |
|
Frozen-small − Frozen-medium |
0.0369 |
0.0299 to 0.0438 |
<0.001 |
0.0279 to 0.0458 |
<0.001 |
Frozen-small higher |
|
Frozen-small − Frozen-large |
0.0353 |
0.0283 to 0.0422 |
<0.001 |
0.0279 to 0.0427 |
<0.001 |
Frozen-small higher |
|
Frozen-medium − Frozen-large |
−0.0016 |
-0.0085 to 0.0053 |
0.985 |
-0.0091 to 0.0058 |
0.987 |
Not significant |
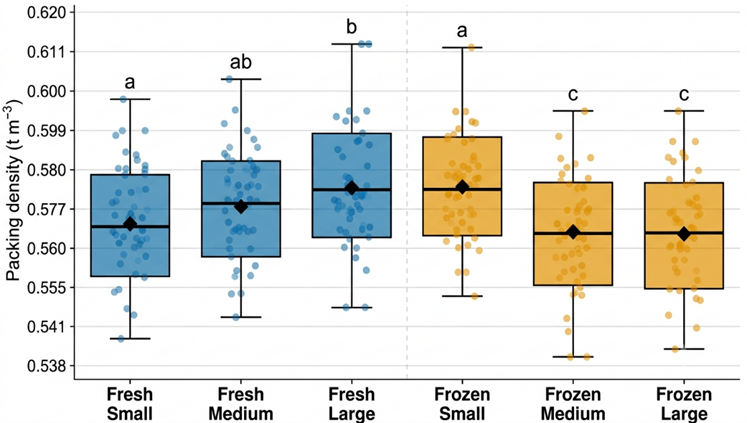
The compact-letter display in Figure 5 summarizes the Games–Howell pairwise comparisons reported in Table 5. Fresh-small and frozen-small fish shared group “a,” fresh-medium fish formed the overlapping group “ab,” fresh-large fish formed group “b,” and frozen-medium and frozen-large fish shared group “c.” Consequently, fresh-medium fish did not differ significantly from fresh-small, frozen-small, or fresh-large fish. The frozen-medium and frozen-large groups had significantly lower packing densities than all fresh groups and frozen-small fish. Tukey-adjusted comparisons produced the same compact-letter grouping, supporting the robustness of the pairwise interpretation (Table 5).
Figure 6 presents the distribution of the 30 packing-density measurements within each sampled-condition–size combination. Fresh-small measurements were relatively tightly distributed around the median, whereas the fresh-medium, frozen-small, and frozen-medium groups exhibited broader within-group variation. Frozen-medium and frozen-large measurements were concentrated below the corresponding fresh-medium and fresh-large measurements. The plotted means and medians were relatively close within most combinations, suggesting limited distributional asymmetry; however, visual examination of the group distributions was not used as a substitute for the formal residual diagnostics. The distributional pattern was consistent with the significant sampled condition × size-class interaction and the Games–Howell comparisons. Figure 6 displays the same compact-letter assignments as Figure 5.
4.1 Onboard storage context and relevance of packing-density estimation
Field observations on 30 different purse-seine vessels over 15 survey days showed that the observed vessels used mechanically refrigerated holds and generally stored catches without ice as the principal cooling medium. The vessels reportedly contained approximately 13–15 holds, with nominal individual capacities of about 4–10 t [12]. However, these values represented reported operational capacities rather than geometrically measured usable volumes. The absence of added ice may reduce the proportion of storage space occupied by cooling media, but this study did not include an ice-based comparison, measure the volume displaced by ice, or quantify any resulting increase in fish-carrying capacity. Usable storage volume may also be reduced by hull curvature, insulation, structural members, partitions, refrigeration piping, access spaces, and incomplete filling zones. Because these components were not measured for each vessel, the field observations provide operational context but do not demonstrate a quantitative difference between nominal and usable hold capacity. Previous studies have shown that fish-hold geometry, refrigeration configuration, insulation, airflow, and thermal performance influence temperature distribution and cooling performance within onboard storage systems [13-16]. Accordingly, the small-container packing coefficients cannot be transferred directly to a vessel hold without independently determining its usable volume and validating the conversion against weighed catch.
The observed separation of catches by species and commercial size provides an operational rationale for evaluating packing coefficients at a more specific level than a single species-wide value. Previous container-based research has similarly reported substantial variation in fish mass per unit volume among species and packing configurations, demonstrating the potential bias associated with generalized coefficients [2, 5]. In the present 0.04277-m³ container, mean packing density ranged from 0.5546 ± 0.0118 t m⁻³ for frozen-medium fish to 0.5937 ± 0.0043 t m⁻³ for fresh-small fish. The corresponding measurement-level mean stowage factors ranged inversely from 1.8039 ± 0.0379 to 1.6844 ± 0.0121 m³ t⁻¹. These stowage-factor statistics were calculated by taking the reciprocal of each packing-density measurement before calculating the group mean, rather than by taking the reciprocal of the group mean density. The significant sampled condition × size-class interaction further indicated that one coefficient did not describe all six sampled combinations adequately. Nevertheless, the coefficients remain preliminary small-scale estimates because they were not validated in full-scale holds, the fresh and frozen groups were not matched by catch event or storage history, and the available records did not verify unique-fish or sample-batch independence. Applying these coefficients to operational catch estimation would therefore require vessel-scale calibration using measured usable hold volumes and calibrated unloading weights across different vessels, seasons, and loading conditions. Until such validation is completed, volume-based estimates should be treated only as exploratory secondary checks and not as replacements for direct weighing, observer verification, or electronic monitoring. Electronic monitoring itself is most effective when integrated with existing catch-monitoring programmes rather than treated as a stand-alone verification system [3].
4.2 Association between sampled fish condition and packing density
The sampled fresh group had a higher descriptive marginal mean packing density than the sampled frozen group, at 0.5884 and 0.5674 t m⁻³, respectively. These marginal means should be interpreted cautiously because the significant sampled condition × size-class interaction showed that the fresh–frozen difference varied among commercial size classes. Figure 4 documents that the sampled fresh fish generally appeared less fixed in posture, whereas the sampled frozen fish retained a comparatively fixed posture. However, the photographs record external appearance only and do not demonstrate quantitative differences in flexibility, mechanical rigidity, deformation, or interstitial void volume. A less fixed body posture might permit greater positional adjustment during packing, while a more fixed configuration might retain spaces between adjacent fish and the container walls. This remains a proposed packing mechanism rather than an experimentally demonstrated explanation.
Ice-crystal formation during freezing can alter water distribution, muscle microstructure, protein properties, texture, and other physicochemical characteristics of aquatic products [8, 17, 18]. These studies establish that freezing can modify fish tissue, but they do not demonstrate that the whole frozen fish examined in the present experiment had a particular mechanical rigidity or produced a quantified interstitial-void fraction. It is physically plausible that differences in body configuration affected settling, orientation, and void formation during packing, but fish temperature, freezing rate, storage duration, tissue density, mechanical rigidity, deformation under load, and void fraction were not measured. The sampled fresh and frozen groups also differed in catch and storage history and were not matched measurements of the same fish before and after freezing. Consequently, the observed packing-density differences cannot be attributed exclusively to freezing, ice formation, or reduced deformability.
The difference between the sampled fresh and frozen groups was not uniform among commercial size classes. For small fish, the mean difference was 0.0023 t m⁻³ and was not statistically significant according to the Games–Howell comparison (95% CI: -0.0046 to 0.0091 t m⁻³; p = 0.916). For medium fish, the sampled fresh group had a packing density 0.0341 t m⁻³ higher than the sampled frozen group (95% CI: 0.0257–0.0426 t m⁻³; p < 0.001). The corresponding difference for large fish was 0.0267 t m⁻³ (95% CI: 0.0208–0.0325 t m⁻³; p < 0.001). Thus, the data did not resolve a fresh–frozen difference in the small class, whereas statistically significant differences were detected in the medium and large classes. This non-parallel pattern accounts for the significant sampled condition × size-class interaction and demonstrates why the marginal condition means alone provide an incomplete description. Nevertheless, these comparisons were made between sampled groups. Because condition was not experimentally assigned to matched fish, the results do not establish freezing as the sole cause of the observed interaction.
The present results indicate that a single universal packing coefficient should not yet be assigned to all fresh or frozen mackerel scad, because the sampled-condition difference varied among size classes. However, this experiment did not compare refrigeration technologies and therefore cannot establish that mechanically refrigerated storage is less volumetrically efficient than ice, brine, slurry ice, or refrigerated-seawater storage. Studies of alternative onboard cooling systems show that their evaluation requires simultaneous consideration of cooling rate, product quality, energy consumption, cooling-medium volume, and storage configuration [14, 19-21]. None of these system-level outcomes was measured in the present study. The results are therefore restricted to differences among sampled condition–size combinations within a 0.04277 m³ container. Before any coefficient is used operationally, it must be validated against measured usable hold volume and calibrated catch weight under full-scale loading conditions.
4.3 Association of fish size and the sampled condition–size interaction with packing density
Small fish produced the highest descriptive marginal mean packing density (0.5926 t m⁻³), compared with 0.5717 and 0.5695 t m⁻³ for medium and large fish, respectively. Their smaller dimensions may have provided greater configurational freedom within the fixed rectangular container, whereas larger fish had fewer possible orientations relative to the container boundaries. Fish length represented 31.9–40.4% of container length for small fish, 42.6–53.2% for medium fish, and 55.3–80.9% for large fish. The observed pattern may therefore reflect a combined response to commercial size and the fish-length-to-container-length ratio rather than a scale-independent biological size effect. Fish-width-to-container-width and fish-depth-to-container-depth ratios could not be calculated because body width and depth were not measured. Previous container-based research has similarly shown that fish morphology and spatial arrangement can influence the mass accommodated per unit storage volume, supporting the use of coefficients that account for differences in fish characteristics rather than a single generalized value [2, 7].
Within the sampled fresh group, mean packing density decreased numerically from small to medium and large fish. However, Games–Howell comparisons indicated that fresh-small fish did not differ significantly from fresh-medium fish (p = 0.167), fresh-medium fish did not differ from fresh-large fish (p = 0.166), and only fresh-small and fresh-large fish differed significantly (p < 0.001). Within the sampled frozen group, frozen-small fish had significantly higher packing density than both frozen-medium and frozen-large fish (both p < 0.001), whereas frozen-medium and frozen-large fish did not differ (p = 0.987). This pattern is compatible with a container-boundary constraint but does not demonstrate the existence of a geometric threshold. Only one container size and three broad commercial classes were examined, while body width, body depth, curvature, fish temperature, mechanical rigidity, deformation, occupied volume, and interstitial-void volume were not measured. Demonstrating a geometric threshold would require multiple container dimensions, continuous three-dimensional biometric measurements, standardized temperature conditions, and direct measurement of occupied and void volumes.
The significant sampled condition × size-class interaction indicates that the association between sampled condition and packing density differed among commercial size classes. Games–Howell comparisons produced three principal compact-letter groups: fresh-small and frozen-small fish shared group “a,” fresh-medium fish formed the overlapping group “ab,” fresh-large fish formed group “b,” and frozen-medium and frozen-large fish shared group “c.” Tukey-adjusted comparisons produced the same grouping pattern. Consequently, the marginal fresh–frozen means conceal the substantially larger sampled-condition differences detected in the medium and large classes, whereas marginal size-class means conceal the different size pattern within the sampled frozen group. Because variance homogeneity was rejected, the Games–Howell comparisons were emphasized. Nevertheless, operational interpretation remains provisional because biological independence among packing measurements could not be verified and the interaction has not been replicated using other container dimensions or validated in full-scale vessel holds.
The residual coefficient of variation was 1.61%, indicating relatively low residual dispersion in relation to the overall mean packing density. The recalculated partial eta-squared values were ηp² = 0.569 for sampled condition, ηp² = 0.564 for size class, and ηp² = 0.357 for their interaction. The HC3 heteroscedasticity-consistent tests produced the same significance conclusions as the classical two-way analysis, supporting the presence of a non-parallel sampled condition × size-class pattern. However, neither a low coefficient of variation nor robust standard errors establish biological independence, instrument accuracy, or repeatability across fish batches and vessels. The factorial framework was useful for identifying the interaction shown in Figure 5, but it does not transform the observed sampled-condition comparison into a randomized causal experiment.
4.4 Potential operational and fisheries-management implications
The container-derived coefficients could be evaluated in a preliminary volume-to-mass model in which predicted fish mass is calculated by multiplying measured usable volume by the packing-density coefficient corresponding to the relevant sampled condition and commercial size class. However, direct transfer of the present coefficients to commercial fish holds is not justified. Actual holds contain insulation, refrigeration pipes, structural members, curved hull surfaces, access spaces, and incompletely filled zones that reduce usable capacity. Moreover, fish-hold geometry, refrigeration configuration, insulation, airflow, and thermal performance influence temperature distribution and cooling performance within onboard storage systems [13, 14, 16, 22]. The reported capacities of approximately 4–10 t for the observed holds represented nominal operational capacities and were not accompanied by measurements of internal geometric or usable volume. Vessel-specific correction factors would therefore be required to account for hold geometry, filling level, stacking orientation, species composition, refrigeration components, and inaccessible volume. The coefficients must first be evaluated across different fish-to-container ratios and subsequently validated by comparing predicted masses with calibrated unloading weights from full-scale holds.
Table 6. Illustrative catch-mass estimates based on selected packing-density coefficients
|
Sampled Condition–Size Combination |
Mean Packing Density (t m⁻³) |
SD (t m⁻³) |
Nominal Hold Volume (m³) |
Usable-Volume Correction Factor |
Estimated Usable Volume (m³) |
Predicted Catch Mass (t) |
Illustrative Uncertainty Range (t) |
Difference from Frozen–Medium (t) |
|
Frozen–medium |
0.5546 |
0.0118 |
10.0 |
0.90 |
9.0 |
4.991 |
4.641–5.352 |
Reference |
|
Fresh–large |
0.5829 |
0.0083 |
10.0 |
0.90 |
9.0 |
5.246 |
4.912–5.586 |
+0.254 |
|
Fresh–small |
0.5937 |
0.0043 |
10.0 |
0.90 |
9.0 |
5.343 |
5.039–5.651 |
+0.352 |
Table 6 provides an illustrative sensitivity calculation based on a hypothetical nominal hold volume of 10.0 m³ and a usable-volume correction factor of 0.90, giving an assumed usable volume of 9.0 m³. The estimated fish mass was 4.991 t when the frozen-medium packing-density coefficient of 0.5546 t m⁻³ was applied, 5.246 t when the fresh-large coefficient of 0.5829 t m⁻³ was applied, and 5.343 t when the fresh-small coefficient of 0.5937 t m⁻³ was applied. Thus, selecting different coefficients changed the estimated mass by as much as 0.352 t, or approximately 352 kg, for the same assumed usable volume. When ±5% uncertainty in usable volume and ±1 SD of packing density were incorporated, the illustrative ranges were 4.641–5.352 t for frozen-medium fish, 4.912–5.586 t for fresh-large fish, and 5.039–5.651 t for fresh-small fish. These ranges are sensitivity intervals rather than formal confidence or prediction intervals because the assumed correction factor and usable-volume uncertainty were not measured aboard the surveyed vessels.
Following vessel-scale validation, packing-density conversion might provide a secondary estimate during high-volume unloading and help identify landing records requiring direct verification. Shore-based observers can contribute to landed-weight verification, biological sampling, and catch accounting in high-volume fisheries [23], while electronic monitoring can extend the coverage and documentation of fishing operations when integrated with existing monitoring programmes [3]. Packing-density conversion cannot, however, detect species substitution, unreported discarding, incorrect species declarations, or undocumented differences in filling and stacking practices. It should therefore not replace calibrated scales, shore-based sampling, observer verification, or electronic monitoring. Its potentially defensible role is limited to an auditable supplementary method supported by vessel-specific calibration, documented hold measurements, quantified uncertainty, and periodic comparison with directly weighed catches.
4.5 Limitations and future research
The principal limitation was the use of a rectangular 0.04277-m³ simulation container rather than a full-scale vessel hold. The fish-length-to-container-length ratio increased from 0.319–0.404 for small fish to 0.553–0.809 for large fish, indicating that the observed size pattern may include a container-boundary effect. This concern is particularly important for large fish, whose lengths represented as much as 80.9% of the internal container length. Although container geometry was fixed, the retained records did not specify an objective filling endpoint, fish orientation, layer pattern, applied pressure, operator, or randomized packing order. The packing procedure therefore cannot be described as completely standardized. The simulation also did not reproduce vessel motion, vertical compaction under commercial catch loads, curved hold walls, refrigeration structures, inaccessible spaces, long storage duration, or temperature fluctuations. Consequently, the results cannot be generalized directly to full-scale holds or to ice, brine, refrigerated-seawater, slurry-ice, boxed, and other storage configurations.
A second limitation was the use of broad commercial length and body-mass ranges rather than continuous three-dimensional morphometric measurements linked to individual packing records. Body depth, maximum width, curvature, individual volume, surface area, and body-shape variation were unavailable. Fish temperature, time after capture, freezing rate, refrigerated-storage duration, surface frost or glaze, moisture condition, tissue rigidity, compaction pressure, deformation, and void fraction were also not measured. These omissions are important because freezing rate, temperature history, and ice-crystal formation can alter water distribution, muscle microstructure, protein properties, and texture in aquatic products [8, 11, 17, 18]. Figure 4 consequently documents external appearance only and cannot establish mechanical rigidity, tissue deformation, or interstitial-void formation as the mechanism responsible for the observed packing pattern.
The sampled fresh and frozen groups did not constitute matched observations of the same fish before and after freezing. They originated from different catch events and storage histories, potentially introducing confounding through capture time, fishing ground, handling, temperature history, nutritional condition, and storage duration. Fish condition was therefore an observed grouping factor rather than a randomly assigned treatment, and the analysis cannot isolate a causal effect of freezing. Although the 180 measurement-level mass records were recovered and supplied as Supplementary Data S1, identifiers for individual fish, fish sets, catch batches, vessels, operators, and packing sequences were not retained. The packing-density calculations, analysis of variance, post hoc comparisons, and interaction plots can therefore be reproduced, but biological independence and potential fish reuse cannot be verified. These limitations require cautious interpretation of the inferential tests and effect-size estimates.
Recovery of the 180 packing records allowed the statistical analysis and residual diagnostics to be reassessed. Residual normality was not rejected by the Shapiro–Wilk test (W = 0.9887, p = 0.163), but homogeneity of variance was rejected by the median-centred Levene test, F(5, 174) = 6.975, p < 0.001. HC3 heteroscedasticity-consistent tests were therefore used to evaluate the factorial terms, and Games–Howell comparisons replaced Fisher’s least significant difference test. Tukey-adjusted comparisons were retained as a sensitivity analysis and produced the same compact-letter pattern. However, these procedures address unequal variances and multiple comparisons; they cannot correct unverified biological independence or unknown fish reuse. Future experiments should preregister the statistical analysis, retain individual- and batch-level identifiers, avoid reusing fish across measurements intended to be independent, randomize packing order, and prespecify multiplicity-adjusted comparisons with confidence intervals.
Measurement uncertainty could not be reconstructed completely. The reported scale resolution of 0.01 kg corresponds to a packing-density resolution increment of approximately 0.000234 t m⁻³ when the exact container volume of 0.04277 m³ is used. This increment is smaller than the smallest observed group-mean difference of approximately 0.0023 t m⁻³. However, the scale manufacturer, model, maximum capacity, calibration records, empty-container mass, repeat-weighing error, and dimensional-measurement uncertainty were not retained. Scale resolution alone is therefore insufficient to establish that the smallest contrast was instrumentally resolved. Consistent with this limitation, the fresh–frozen difference within the small size class was not statistically significant.
Future research should conduct matched before-and-after experiments using fish from the same catch, comparable biometric ranges, standardized freezing temperatures and rates, and documented storage durations. Experiments should use multiple container dimensions and fish-to-container ratios; measure body depth, width, curvature, individual volume, temperature, tissue rigidity, compaction pressure, and interstitial-void fraction; and standardize the filling endpoint, orientation, layering, applied pressure, operator allocation, and packing order. Full-scale validation should subsequently compare predicted catch masses with calibrated unloading weights across vessels, seasons, loading pressures, storage durations, and refrigeration systems. Only after this multiscale validation and uncertainty assessment should the coefficients be considered for operational fish-hold planning or secondary catch verification.
Within the standardized 0.04277 m³ container, mackerel scad packing density was associated with the combination of sampled fish condition and commercial size class. Fresh-small fish had the highest mean packing density (0.5937 t m⁻³), whereas frozen-medium fish had the lowest mean (0.5546 t m⁻³) and did not differ significantly from frozen-large fish (0.5562 t m⁻³; Games–Howell p = 0.987). The fresh–frozen mean difference was 0.0023 t m⁻³ for small fish and was not statistically significant (p = 0.916), whereas significant differences of 0.0341 and 0.0267 t m⁻³ were detected for medium and large fish, respectively (both p < 0.001). The heteroscedasticity-consistent HC3 analysis confirmed a significant sampled condition × size-class interaction, indicating that a single marginal condition or size coefficient would not adequately represent all six sampled combinations. However, because the fresh and frozen groups were not matched before and after freezing, these results describe associations among sampled groups and do not establish freezing as the sole cause of the observed differences.
The study provides preliminary small-scale evidence that a single fixed species coefficient may conceal variation associated with sampled condition, commercial size class, and fish-to-container geometry. Mean packing density ranged from 0.5546 to 0.5937 t m⁻³, while the corresponding measurement-level mean conventional stowage factors ranged from 1.6844 to 1.8039 m³ t⁻¹. These container-derived values should not yet be applied as operational coefficients for commercial fish holds. Their present contribution is to define preliminary coefficient ranges and testable hypotheses for subsequent calibration studies. Potential applications to fish-hold capacity planning or secondary catch verification remain conditional on validation against measured usable hold volumes and calibrated catch weights. Interpretation must also consider the possible container-boundary effect and the inability to verify biological independence or fish reuse among the 180 packing measurements.
The authors gratefully acknowledge the Faculty of Fisheries and Marine Science, Universitas Brawijaya, for providing access to the facilities of the Fishing Technology Laboratory. Special appreciation is extended to Jessica Lucyana Amanda Putri for her valuable contribution to data collection and preparation. The authors also thank the fishers and personnel of Nizam Zachman Ocean Fishing Port, Jakarta, for their cooperation and support during field data collection.
The measurement-level dataset supporting the packing-density analyses is provided in Supplementary Data S1 accompanying this article. It contains 180 packing measurements across six sampled-condition–commercial-size-class combinations, including fish counts, net fish masses, and reported packing densities. Packing densities and conventional stowage factors can be recalculated using the recorded net fish masses and the container volume of 0.04277 m³, as described in the Methods. Individual-fish, fish-reuse, vessel, and catch-batch identifiers were not retained and are therefore unavailable.
[1] Waterman, J.J. (2001). Measures, Stowage Rates and Yields of Fishery Products. Rome: Food and Agriculture Organization of the United Nations (FAO). https://www.fao.org/4/x5898e/x5898e00.htm.
[2] Setyohadi, D., Pamungkas, R.S., Purwanto, H., et al. (2024). Enhancing fisheries management and sustainability: A stowage factor analysis of fish species at Mayangan Port, Indonesia. International Journal of Design & Nature and Ecodynamics, 19(6): 1939-1949. https://doi.org/10.18280/ijdne.190610
[3] van Helmond, A.T.M., Mortensen, L.O., Plet-Hansen, K.S., et al. (2019). Electronic monitoring in fisheries: Lessons from global experiences and future opportunities. Fish and Fisheries, 21(1): 162-189. https://doi.org/10.1111/faf.12425
[4] Budiyanto, M.A., Azharrisman, F., Utama, A.F. (2023). Cooling performance of modular fish hold for 30 gross-tonnage fishing vessel. Journal of Marine Engineering & Technology, 22(1): 38-44. https://doi.org/10.1080/20464177.2022.2094655
[5] Hansen, A.Å., Svanes, E., Hanssen, O.J., Void, M., Rotabakk, B.T. (2012). 8 - Advances in bulk packaging for the transport of fresh fish. In Advances in Meat, Poultry and Seafood Packaging, Woodhead Publishing, pp. 248-260. https://doi.org/https://doi.org/10.1533/9780857095718.2.248
[6] Shawyer, M., Medina Pizzali, A.F. (2003). The use of ice on small fishing vessels. FAO Fisheries Technical Paper, no. 436. Rome: Food and Agriculture Organization of the United Nations (FAO). https://www.fao.org/4/y5013e/y5013e00.htm.
[7] Sunardi, Setyanto, A., Yulianto, E.S., Mihrobikhulwaturihmi, Pamungkas, R.S. (2026). A model-driven method for space optimization in purse seine fish holds: Application to Indian scad. ARPN Journal of Engineering and Applied Sciences, 20(22): 1967-1974. https://doi.org/10.59018/1125220
[8] Duarte, A.M., Silva, F., Pinto, F.R., Barroso, S., Gil, M.M. (2020). Quality assessment of chilled and frozen fish—Mini review. Foods, 9(12): 1739. https://doi.org/10.3390/foods9121739
[9] Vasconcelos, J., Cirera, M., Vieira, A.R., Otero-Ferrer, J.L., Tuset, V.M. (2025). Application of shape analysis for the identification of pelagic fish stocks. Hydrobiologia, 852: 2847-2869. https://doi.org/10.1007/s10750-025-05798-1
[10] Johnston, W.A., Nicholson, F.J., Roger, A., Stroud, G.D. (1994). Freezing and refrigerated storage in fisheries. Food and Agriculture Organization of the United Nations (FAO), Rome, Italy, FAO Fisheries Technical Paper 340. https://openknowledge.fao.org/handle/20.500.14283/v3630e.
[11] Brown, P., Dave, D. (2021). Current freezing and thawing scenarios employed by North Atlantic fisheries: Their potential role in Newfoundland and Labrador's northern cod (Gadus morhua) fishery. PeerJ, 9: e12526. https://doi.org/10.7717/peerj.12526
[12] Dariansyah, M.R., Novita, Y., Iskandar, B.H., Jaya, I., Kuniawati, V.R. (2023). Diversity of purse seine vessels at Pekalongan archipelago fisheries port (PPN) above 100 gross tonnage. International Journal of Marine Engineering Innovation and Research, 8(3): 509-516. https://doi.org/10.12962/j25481479.v8i3.18775
[13] Baheramsyah, A., Cahyono, B., Aruan, F.S. (2017). Slurry ice as a cooling system on 30 GT fishing vessel. International Journal of Marine Engineering Innovation and Research, 1(3): 136-142. https://doi.org/10.12962/j25481479.v1i3.2005
[14] DeBeer, J., Nolte, F., Lord, C.W., Colley, J. (2019). Salt penetration in whole raw tuna frozen onboard vessel by brine immersion: An industrial study. Marine Fisheries Review, 81(1): 40-52. https://doi.org/10.7755/mfr.81.1.2
[15] Prayitno, M.E. (2022). Analysis of technical specifications of 180 GT purse seine vessel in fishing line III fisheries management area (FMA) 572. International Journal of Marine Engineering Innovation and Research, 7(4): 244-260. https://doi.org/10.12962/j25481479.v7i4.14859
[16] Ramadhanti, A., Novita, Y., Imron, M., Bangun, T.N.C., Iskandar, B.H. (2022). The ratio of storage volume to cubic number for rampus nets at the Karangantu archipelago fishery port-Banten. Jurnal Perikanan Universitas Gadjah Mada, 24(2): 155-163. https://doi.org/10.22146/jfs.73658
[17] Liu, S.L., Zeng, X.H., Zhang, Z.Y., et al. (2020). Effects of immersion freezing on ice crystal formation and the protein properties of snakehead (Channa argus). Foods, 9(4): 411. https://doi.org/10.3390/foods9040411
[18] Tan, M.T., Mei, J., Xie, J. (2021). The formation and control of ice crystal and its impact on the quality of frozen aquatic products: A review. Crystals, 11(1): 68. https://doi.org/10.3390/cryst11010068
[19] Fiedler, F.N., Sales, G., Giffoni, B.B., et al. (2016). Characterization and comparison of Brazilian and foreign leased pelagic longline fleets in the Southwestern Atlantic Ocean between 2003 and 2014. How different are these fisheries? Revista CEPSUL -Biodiversidade e Conservação Marinha, 5: 1-16. https://doi.org/10.37002/revistacepsul.vol5.5991-16
[20] Isaacs, M. (2016). The humble sardine (small pelagics): Fish as food or fodder. Agriculture & Food Security, 5: 27. https://doi.org/10.1186/s40066-016-0073-5
[21] Laso, J., Vázquez-Rowe, I., Margallo, M., Crujeiras, R.M., Irabien, Á., Aldaco, R. (2018). Life cycle assessment of European anchovy (Engraulis encrasicolus) landed by purse seine vessels in northern Spain. The International Journal of Life Cycle Assessment, 23: 1107-1125. https://doi.org/10.1007/s11367-017-1318-7
[22] Montojo, U.M., Delos Santos, V.H., Narida, C.M., et al. (2020). Estimation of post-harvest losses of fish transported using ice-chilled carrier boats from high seas pocket 1. The Philippine Journal of Fisheries, 27(1): 83-92. https://doi.org/10.31398/tpjf/27.1.2019a0018
[23] Gredzens, C., Kingham, A., Jannot, J.E. (2026). Evaluating and advancing the use of shore-based observers for scientific sampling and catch verification in high-volume fisheries. Fisheries Management and Ecology, 33(3): 612-629. https://doi.org/10.1111/fme.70039