Valdeci José Costa* | Paulo Roberto Oliveira de Sá | Kaio Henrique Coelho do Amarante | Lilia Aparecida Kanan
© 2026 The authors. This article is published by IIETA and is licensed under the CC BY 4.0 license (http://creativecommons.org/licenses/by/4.0/).
OPEN ACCESS
This study proposes and details a methodological pathway for defining the variables and indicators of the database system of the Sustainable Regional Development Observatory (ODRS/SC), based at the University of Planalto Catarinense (UNIPLAC), Santa Catarina, Brazil. The central contribution is methodological: a reproducible framework that combines variable selection based on substantive and statistical criteria, robust normalization, aggregation through compensatory and non-compensatory methods, the definition of reference thresholds, and sensitivity and influence analysis to prioritize the indicators with the greatest leverage. To demonstrate its applicability, a pilot application is presented using public data from the Atlas of Human Development Index (HDI) in Brazil for the Serra Catarinense—the region with the lowest HDI in the state. In this application, the sensitivity and influence analysis identifies education and income as the dimensions with the greatest leverage on the index, illustrating how the proposed method can support the definition of analytical and territorial priorities. The results of the pilot application are not taken as a validation of the method, but as a demonstration of its operationalization in a specific regional context. The study thus offers a replicable methodological proposal whose applicability to different territories and contexts should be examined in future studies.
sustainable regional development, database, Human Development Index, regional development indicators, quality of life
Sustainable regional development is a global imperative that requires not only comprehensive measures, but also the precise identification of the areas most in need of strategic intervention. In this context, the Human Development Index (HDI) is an important tool; however, its effective use depends on the ability to identify, within these regions, which variables and indicators carry meaningful weight and impact, so that coordinated actions can in fact improve people’s quality of life [1].
The HDI has notably proven to be an instrument that guides public policy [2]. Created in 1990, it has been published annually since 1993 by the United Nations Development Programme (UNDP) [3]. The HDI is calculated from three guiding dimensions: health, education, and income. Thus, the greater the progress in these dimensions, the higher the HDI of the region in question.
In the HDI calculation, the health dimension considers life expectancy, that is, the longevity of populations and, naturally, how healthy they are. The education dimension assesses the literacy rate and/or the level of schooling of the population at large. As for income, the focus is on the population’s standard of living, which is generally measured by GDP per capita [4]. The HDI is then obtained as a geometric mean of the normalized indicators of the dimensions mentioned above [3].
This index clearly has its limitations. A number of researchers currently point to the need to incorporate additional dimensions and indicators, such as sustainability; the territorial distribution of income; key social elements; sustainability integrated with other issues and with the relationship to the environment; the time spent on urban commuting [2]; urban and rural sanitation; territorial planning; and the generation and use of renewable energy, among others [5, 6]. Moreover, the use of different methodologies in composing the indices may yield different results [1].
Along these lines, recent literature warns that synthetic measures such as the HDI may reward merely symbolic progress, that is, gains in scores, rankings, and reports that do not correspond to effective changes in the underlying socioeconomic and environmental conditions; in other words, the index may fail to represent reality [7]. To avoid this pitfall, it is recommended that indicators reflect the population’s actual living conditions, and not merely formal performance in terms of scores, and that they be interpreted in light of the articulation across different territorial levels (from the neighborhood to the municipality, the region, and the country) and across the environmental, social, and economic dimensions. These premises reinforce the role of an observatory capable of articulating data from different levels and domains, rather than merely assembling isolated indicators.
Brazil, as a country of continental dimensions, exhibits deep regional asymmetries, as occurs in other developing countries [8]. In the state of Santa Catarina, the Highland Plateau region of Santa Catarina records the lowest Human Development indices, according to the Municipal HDI published by the Atlas of Human Development in Brazil [9, 10]. As an example, Brazil has an average HDI of 0.727 [10], while Santa Catarina has an average HDI of 0.774; the municipality of Cerro Negro, located in the Serra Catarinense, has an HDI of 0.621. When attention turns to the education dimension, the value falls to 0.455 [10], one of the lowest in the country. In addition, according to the map of wealth in Brazil published by Neri [11], in his analysis of the number of people required to file an annual personal income tax return, by municipality, in 2020 throughout Brazil, in the table entitled “Where are the rich? Municipalities 2020”, the severe inequalities in declared income across the country are outlined. In that study, for the state of Santa Catarina, it can readily be observed that the great majority of municipalities with the lowest rates of income tax filers and the lowest per capita income are located in the Serra region of the state. This is an indicator that reveals the percentage of the population potentially living in multidimensional poverty. It is a regrettable disparity.
This situation is not unique to the Serra Catarinense. A study by Gumbowsky et al. [12] shows the evolution of the Municipal HDI for the municipalities of the Planalto Norte Catarinense region. The authors carry out a descriptive and comparative analysis between 1991 and 2010 and conclude that there is an increase in the Municipal HDI, although a slow one; with respect to education, the indices are challenging, as they show that the observed values remain far from the targets proposed at the regional and national levels. For Prajapati [13], education is the main pillar for the growth of the remaining indices and, consequently, for genuine human development as a whole.
Data corroborating the statements above can also be found on several data platforms, among them that of the Maria Cecilia Souto Vidigal Foundation, available at https://primeirainfanciaprimeiro.fmcsv.org.br/meu-municipio.
Aware of this reality, researchers at the University of Planalto Catarinense (UNIPLAC) initiated studies on policies to foster regional development, with the aim of changing this status quo, that is, raising the regional HDI. To this end, a research project was submitted to the Santa Catarina State Research and Innovation Support Foundation (FAPESC). Once approved, its development culminated in the launch of the Sustainable Regional Development Observatory of Santa Catarina (ODRS/SC) on 20 July 2023 [14].
Given this context, the role of the ODRS is to promote and propose actions integrated with sustainable regional development through the production and sharing of information, methodologies, and knowledge derived from the analysis and comparison of the indicators and variables that make up the HDI. This entails the need for a productive relationship between the ODRS and public, private, and third-sector bodies. According to the United Nations Economic and Social Council [15], where there is sufficient focus, innovation, political commitment, and determination, with fully engaged partners and results-oriented multilateral collaboration, these challenges can be overcome and sustainable development will be well on track.
This effort aligns with a broader paradigm in which regional development moves beyond the logic of economic growth and seeks, in an articulated way, economic prosperity, social equity, and ecological balance [16]. Such a perspective favors processes built from the realities of each region, with a leading role for residents, municipal government, and local and regional organizations, in contrast to solutions defined in a centralized manner through merely illusory plans or projects that yield no lasting positive results. From this standpoint, collaborative governance and the mobilization of territorial actors become a condition for the effectiveness of policies, a role for which the ODRS/SC is particularly well suited.
Having established this local picture, this study proposes a meticulous approach to defining the variables and indicators intended to compose and enhance the database system of the ODRS/SC. The need for such an approach is multifaceted. First, precision in identifying regions with a low HDI is essential for more efficient resource allocation and for the implementation of targeted policies [17]. Second, by establishing specific variables and indicators, this work aims not only to improve the assessment of the HDI, but also to incorporate sustainability aspects that are vital for truly lasting development [18].
This work also seeks to contribute to the existing body of knowledge by providing a well-grounded methodological framework that can be used not only by the Observatory, but also by researchers and institutions interested in the study and promotion of sustainable regional development.
Against this backdrop, the research question guiding this study is: How can an indicator system be structured to identify, in a reproducible way, the critical sub-areas within low-HDI municipalities, integrating heterogeneous local administrative data with data from the IBGE and the Atlas of Human Development?
As for novelty, the distinctive feature of this study is not the creation of yet another composite index—such as the Multidimensional Poverty Index (MPI) or the Sustainable Regional Development Index (IDRS) [8]—but the articulation, at the sub-municipal scale, between (i) administrative data from utility companies (water and energy) and from the municipal administration (property tax and zoning) and (ii) the consolidated indicators of the IBGE/Atlas, combining compensatory and non-compensatory aggregation with security thresholds (critical, alert, and optimal). This combination, applied to the little-studied context of the Serra Catarinense, distinguishes the proposal both from the composite-index literature and from the usual practice of observatories that merely gather isolated indicators.
Because the HDI is a broad measure, the implementation of effective changes requires identifying not only the specific regions in need of intervention, but also the sub-areas and sets of complex systems that negatively affect the indicators [8]. To this end, a systemic approach to data and their relationships is essential, particularly when the aim is to achieve:
•Improved decision-making: By defining clear variables and indicators for the database system, decision-makers gain access to more precise and detailed information about specific and relevant areas. This enables more efficient resource allocation and the implementation of targeted policies.
•Support for sustainability: Including sustainability indicators in this database system can provide valuable insight into how regions are developing, not only economically but also in social and environmental terms [19].
•Contribution to future research: By establishing a sound methodology for defining variables and indicators, this article can serve as a basis for subsequent studies on sustainable regional development and on the analysis of critical sub-areas in regions with a low HDI.
•Promotion of equity: Identifying sub-areas in regions with a low HDI is the first step toward promoting equity and social justice. It enables the implementation of targeted policies to improve quality of life in these areas, thereby reducing disparities.
Furthermore, according to Almeida and Firme [17], factors such as relief, climate, spatial conditions, and the connection between one region and another may cause certain actions to be amplified or attenuated, generating different impacts for the same stimulus, that is, a spatial spillover and a degree of geographic dependence. This view reinforces the need for an analysis of autocorrelated indicators.
This spatial interdependence reflects the fact that regions and cities behave as complex adaptive systems, in which infrastructure, land use, residents’ behavior, and public policies co-evolve through non-linear interactions, feedback loops, and self-organization processes, giving rise to emergent behaviors that cannot be deduced from the isolated analysis of the parts [20]. Recognizing this complex nature justifies the systemic analysis of data and correlations proposed by the Observatory and recommends adaptive management strategies capable of coping with uncertainty and of tracking the evolution of territories over time.
According to the UNDP [21], the main indicators that make up an HDI assessment are:
(a) Education: literacy rate; enrollment rate; access to quality education; school dropout rate.
(b) Health: life expectancy at birth; infant mortality rate; access to basic health services; prevalence of chronic diseases.
(c) Income and employment: per capita income; unemployment rate; poverty and income inequality indices; access to employment opportunities.
(d) Environmental sustainability: air and water pollution indices; use of renewable energy; environmental conservation areas; carbon footprint.
(e) Infrastructure and services: access to drinking water and basic sanitation; quality of transport infrastructure; access to communication services (internet, telephone).
(f) Social development: crime rate; access to culture and leisure; indices of social cohesion and civic participation.
These indicators provide a comprehensive view of the socioeconomic, environmental, and quality-of-life conditions of a region. The precise selection of variables will depend on data availability, on the particular features of the region under study, and on the specific objectives of the ODRS/SC. Integrating these different dimensions offers a holistic view of development, enabling the precise identification of sub-areas and pointing to those that require priority attention.
The robustness of an indicator system also depends on the quality of the variables selected: they should be scientifically grounded, measurable, and representative, remain aligned with the objectives of public policy, and provide an integrated reading of the conditions of the territory [22]. It is also important to recognize that indicators are not independent of one another; their relationships may constitute synergies, where progress in one favors the others, or conflicts, where progress in one comes at the expense of another. Identifying the most central and positively influential indicators within a network of interactions makes it possible to concentrate efforts where the effect on the whole is greatest [23].
3.1 Collection and processing of primary data for populating the database
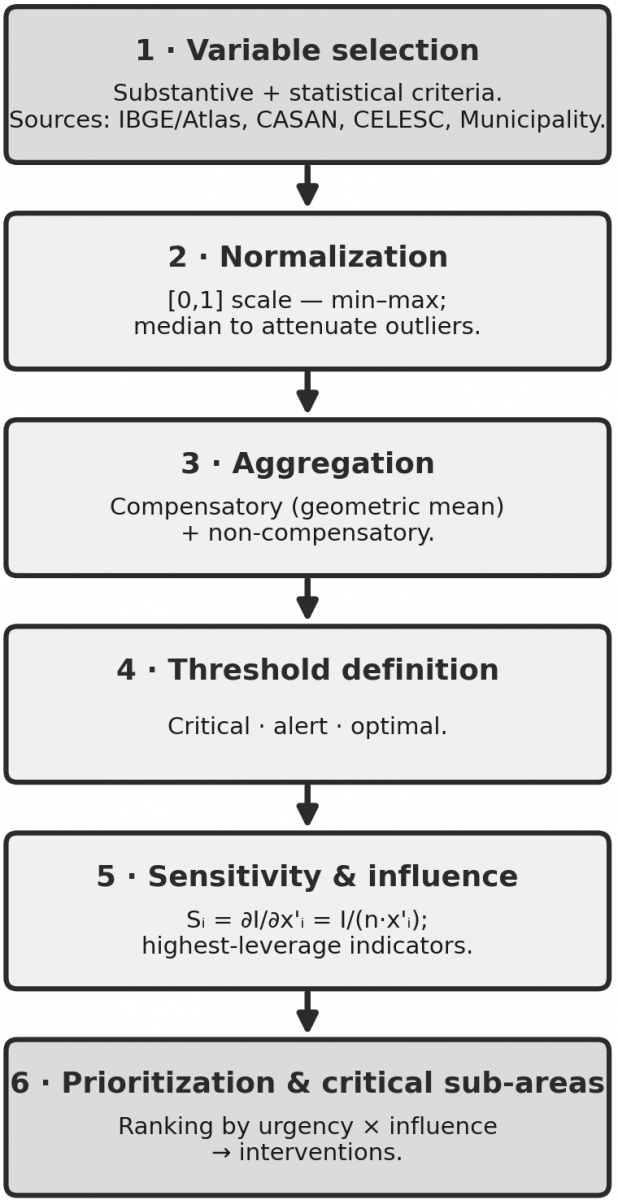
Figure 1 summarizes the methodological pathway adopted, from the stages of indicator selection and normalization to sensitivity analysis and the prioritization of critical sub-areas.
Figure 1. Flowchart of the methodological pathway of the Sustainable Regional Development Observatory of Santa Catarina (ODRS/SC) indicator system
The primary source of statistical data, systematically collected and used by various public and private bodies at the federal, regional, and municipal levels, remains the Brazilian Institute of Geography and Statistics (IBGE); it is therefore only consistent to use it extensively in order to create the comparative basis against which data gathered from other sources are scrutinized. This is because cross-referencing IBGE indicators with data supplied by public bodies is a robust approach for enriching the analysis and for identifying, within regions with a low HDI, which subsets of indices and indicators carry the greatest weight in affecting the overall score [24]. This was achieved through adherence to the following integration principles.
3.2 Data standardization
Since it is impossible to ensure that the data provided by municipal authorities, for example, are in compatible formats and consistent with the IBGE indicator categories, it fell to the Observatory to create tools enabling this appropriate structuring prior to importing the data. This removes technical and operational obstacles that would otherwise hamper obtaining such data from third parties, ensuring that heterogeneous data are made compatible with the Observatory’s database upon integration, rather than necessarily at the information sources themselves.
Regions are identified by mapping data originating from municipal authorities and bodies such as the Santa Catarina Water and Sanitation Company (CASAN), the Municipal Water and Sanitation Department (SEMASA), and Santa Catarina Electric Power (CELESC), among others, correlating them with the geographic areas defined by the IBGE. This is done through a georeferencing system or, more simply, through a semantic construction that standardizes localities, creating within the Observatory’s database a common base of municipalities, regions, and neighborhoods, associated with codes that can be referenced directly.
Data cross-referencing is carried out by integrating the datasets, combining information from IBGE indicators with data provided by municipal authorities and other public and private bodies. After cross-referencing, statistical analyses are performed to identify correlations, trends, or disparities between the IBGE indicators and the local data for each indicator. On this basis, it is possible to proceed to the analysis and assessment of the indicators [25].
3.3 Methodological procedure
In general terms, the methodology is quantitative, justified by the objective and measurable nature of the data needed to identify variables and indicators in a sustainable regional development observatory [4]. In the context of identifying critical areas in cities and regions with a low HDI, a quantitative approach offers several advantages:
•Objectivity and precision: Quantitative research employs methods based on numerical and measurable data. This allows for the precise and objective identification of the socioeconomic, environmental, and quality-of-life variables that affect the HDI across different regions. By analyzing data such as literacy rates, life expectancy, per capita income, and access to basic services, it is possible to obtain a clear understanding of the areas with a low HDI.
•Statistical analysis: The quantitative methodology allows the application of statistical techniques to identify correlations, patterns, and trends in the data collected. This enables an in-depth analysis of the relationships between different variables and the HDI, providing information on the main factors that contribute to areas of low development.
•Representative sampling: With a well-structured quantitative study, it is feasible to collect data from a representative sample of cities and regions. This helps ensure that the conclusions and analyses drawn from the data are generalizable to the population under study, offering a broader and more comprehensive view.
•Comparability and reproducibility: The quantitative approach allows different indicators and variables to be compared across regions, facilitating the identification of disparities and critical points in areas with a low HDI. Moreover, by following a standardized method, the results can be reproduced and compared over time to assess changes and progress.
•Foundation for decisions and public policy: The tangible nature of quantitative data provides a solid basis for formulating public policy and intervention strategies. Such data underpin consistent decisions, enabling more efficient resource allocation and the implementation of measures targeted at areas in need of sustainable development.
Following an extensive literature review, the determination of the key variables that may influence the HDI measure, the selection of sources with available data, and the identification of a suitable method for establishing multidimensional indicators, it was determined that the following datasets will be allocated to the database from the sources listed below.
Table 1 lists the selected indicators, organized by the dimensions of sustainable development, with their respective sources, units, temporal coverage, polarity, and reference thresholds. As shown there, the IBGE and the Atlas provide the sociodemographic, education, health, and income/labor indicators; the utility companies (CASAN/SEMASA and CELESC) provide the sanitation and energy data; and the municipal administration provides the territorial data (property tax and zoning).
Table 1. Variables and indicators of the Sustainable Regional Development Observatory of Santa Catarina (ODRS/SC) system, by dimension
|
Dimension |
Indicator |
Source |
Unit |
Coverage |
Polarity |
Threshold / Reference (Optimal) |
|
Education |
Literacy rate |
IBGE/Atlas |
% |
2010; PNADc |
Positive |
optimal ≥ 98%; normalized band |
|
Education |
Adult schooling (≥18 yrs, complete primary) |
IBGE/Atlas |
% |
2010 |
Positive |
normalized band |
|
Education |
Net school attendance (basic ed.) |
INEP/IBGE |
% |
annual |
Positive |
optimal ≥ 95% |
|
Education |
School dropout rate |
INEP |
% |
annual |
Negative |
optimal ≤ 2% |
|
Education |
IDEB (early/final years) |
INEP |
index 0–10 |
biennial |
Positive |
optimal ≥ 6.0 (PNE target) |
|
Health |
Life expectancy at birth |
Atlas/DATASUS |
years |
2010; annual |
Positive |
normalized band (state ref. ≈ 76.6) |
|
Health |
Infant mortality rate |
DATASUS/SIM |
per 1,000 live births |
annual |
Negative |
optimal ≤ 12 (SDG 3.2) |
|
Health |
Primary-care coverage |
DATASUS/e-Gestor |
% |
annual |
Positive |
optimal ≥ 95% |
|
Income/Labor |
Household income per capita |
IBGE/Atlas |
BRL |
2010; PNADc |
Positive |
normalized band |
|
Income/Labor |
Unemployment rate |
IBGE |
% |
annual |
Negative |
optimal ≤ 5% |
|
Income/Labor |
Share vulnerable to poverty |
IBGE/Atlas |
% |
2010 |
Negative |
normalized band |
|
Income/Labor |
Gini index (income) |
IBGE/Atlas |
index 0–1 |
2010 |
Negative |
optimal ≤ 0.40 |
|
Sanitation |
Population with treated water |
CASAN/SNIS |
% |
annual |
Positive |
optimal ≥ 99% (2033 Framework) |
|
Sanitation |
Households with sewage collection & treatment |
CASAN/SNIS |
% |
annual |
Positive |
optimal ≥ 90% (2033 Framework) |
|
Sanitation |
Solid-waste collection coverage |
Municipality/SNIS |
% |
annual |
Positive |
optimal ≥ 99% |
|
Sanitation |
Water distribution losses |
CASAN/SNIS |
% |
annual |
Negative |
optimal ≤ 25% |
|
Energy |
Electricity consumption per capita |
CELESC |
kWh/inhab·yr |
annual |
Contextual |
regional distribution |
|
Energy |
Share of renewable sources |
CELESC/EPE |
% |
annual |
Positive |
normalized band |
|
Energy |
Distribution losses (efficiency) |
CELESC |
% |
annual |
Negative |
normalized band |
|
Environmental |
Vegetation / green-area cover |
IBGE/MapBiomas |
% |
periodic |
Positive |
normalized band |
|
Environmental |
Water Quality Index (WQI) |
CASAN/IMA |
index 0–100 |
annual |
Positive |
optimal ≥ 79 (CETESB–ANA) |
|
Economy |
Municipal GDP per capita |
IBGE |
BRL |
annual |
Positive |
normalized band |
|
Economy |
Formal jobs (employment ties) |
RAIS/CAGED |
per 1,000 inhab. |
annual |
Positive |
normalized band |
|
Economy |
Economic diversification (sectors) |
IBGE |
index |
annual |
Positive |
normalized band |
|
Territory |
Property tax (assessed value/revenue) |
Municipality (Lages) |
BRL/class |
cadastral |
Contextual |
stratification (not classified) |
|
Territory |
Zoning/land use |
Municipality |
class |
cadastral |
Contextual |
stratification (not classified) |
|
Social |
Homicide rate |
SSP/SC |
per 100,000 inhab. |
annual |
Negative |
optimal ≤ 10 (WHO ref.) |
|
Social |
Social Vulnerability Index (SVI) |
Ipea/Atlas |
index 0–1 |
2010 |
Negative |
optimal ≤ 0.200; crit. > 0.500 (Ipea) |
|
Social |
Access to culture & leisure (facilities) |
Municipality/IBGE |
per 10,000 inhab. |
periodic |
Positive |
normalized band |
Note: The table reports source, unit, coverage, polarity, and reference threshold for each indicator. After normalization to [0, 1] (with polarity adjusted so that “higher = better”), each indicator is classified as critical (< 0.500), alert (0.500–0.699), or optimal (≥ 0.700), by analogy with the Human Development Index (HDI) bands and the security-threshold literature [26]. In the threshold column, the raw value defining “optimal” performance is given where an official reference target exists (e.g., the Legal Framework for Sanitation—Law 14.026/2020: 99% water and 90% sewage by 2033; SDG 3.2: infant mortality ≤ 12 per thousand; the SVI/Ipea and WQI/CETESB-ANA bands); in the remaining cases, the threshold is set by the regional distribution of the municipalities of the Association of Municipalities of the Serra Catarinense (AMURES).
These indicators can offer valuable information on the consumption, distribution, quality, and investments related to water and energy across different regions. Analyzing these variables together with socioeconomic indicators can contribute to a more complete assessment of sustainable development in particular areas.
From the municipal administration, the following territorial data are also used:
Urban Property and Land Tax (IPTU): Data on the urban property and land tax and on a city’s zoning information can provide relevant insight for understanding the socioeconomic and spatial dynamics of a region, and are useful in the context of the present study on identifying regions with a low HDI within an Observatory. The property tax can reflect the appreciation or depreciation of particular areas of the city. Regions with lower taxes may indicate less development or infrastructure, whereas regions with higher taxes may signal more developed or higher-value areas. Information on the type of buildings (residential, commercial, industrial) can reveal the status of the region’s economic diversification and urban structure. The distribution of property-tax values can indicate socioeconomic disparities in the city, with higher-income regions paying higher taxes and vice versa. Zoning reveals how the city is divided into different areas (residential, commercial, industrial, and so forth). This can indicate the functional and economic diversity of the region, as well as accessibility to services and infrastructure.
Urban planning and quality of life: Zoning information can display the profile of the city’s urban planning, including areas designated for environmental preservation, areas of urban expansion, and other aspects. Zoning can directly influence quality of life, such as proximity to green areas, the existence of quiet residential zones, and access to public services, among other factors [5].
By integrating property-tax data and zoning information into the study of human-development and socioeconomic indicators, it is possible to enrich the understanding of the specific characteristics of different areas of the city. This can help identify patterns, disparities, and specific needs in terms of sustainable regional development [8].
3.4 Statistical analysis and data cross-referencing
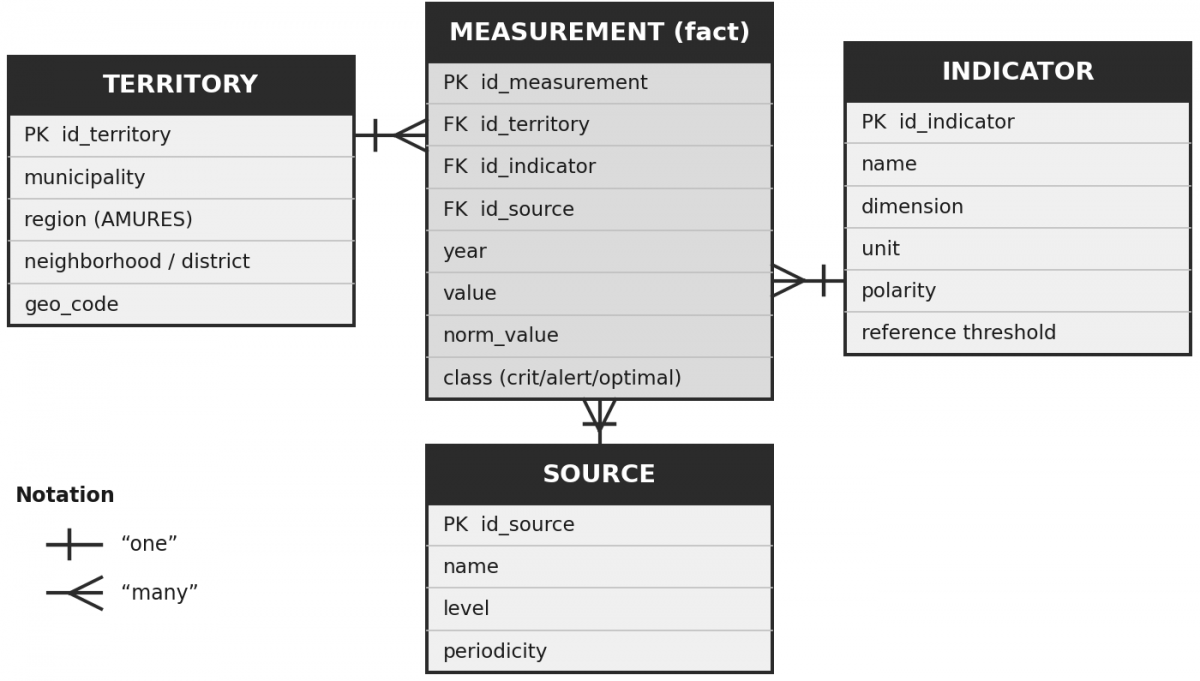
The relational structure of the database is illustrated in Figure 2. The measurement fact table links each value to a territory, an indicator, and a source, which enables the cross-referencing and normalization of the data described in this section.
Statistical methods were employed to analyze the data and to cross-reference IBGE information with data from municipal authorities, identifying correlations and patterns among the indicators. The results obtained were validated by checking the consistency and accuracy of the integrated data, and adjustments were made where necessary to improve the accuracy of the results. To this end, the database system was developed, implementing a structure to store and manage these indicators in an organized and accessible manner for future use by the Observatory. All methodological steps carried out, the indicators selected, the data sources, and the results obtained are stored in a detailed report.
This methodology aims to establish a solid framework for identifying and integrating relevant indicators, enabling the precise identification of regions with a low HDI and thereby advancing the mission of the ODRS/SC.
It is important to stress that the nature of human development is multidimensional and oriented toward quality of life. According to Saab et al. [3], a robust analysis of the data requires the application of parametric methods such as multivariate analysis with random-effects and fixed-effects models. For Dalberto et al. [27], the idea of development is as subjective as that of utility; for this reason, a non-parametric treatment is often necessary, that is, the use of non-parametric mathematical models, which, however, must under no circumstances fail to represent the reality conveyed by the data, which are quantitative.
3.5 Selection, normalization, and aggregation of indicators
Building an indicator system requires well-defined methodological stages of selection, normalization, and aggregation of the variables. In the selection stage, it is advisable to combine substantive criteria, that is, the theoretical relevance of each variable to the phenomenon under study, with statistical criteria, eliminating variables that are excessively correlated with one another in order to avoid redundancy and double counting [22]. Next, because the variables are expressed in different units and scales, they must be normalized to a common range, for example from 0 to 1, a step that makes them comparable across municipalities and over time [23]. For variables with strong skewness or extreme values, which are frequent in municipal socioeconomic data, the use of normalization techniques such as those based on the spatial median is recommended, as they reduce the influence of outliers without discarding them [22].
Normalization (min–max) to the [0, 1] scale: for positive-polarity indicators, $x^{\prime}_i=\frac{x_i-\text {mín}}{\operatorname{máx}-\text{mín}}$; for negative-polarity indicators, $x^{\prime}_i=\frac{\operatorname{máx}-x_i}{\operatorname{máx}-\text{mín}}$. For variables with strong skewness or extreme values (frequent in municipal socioeconomic data), median-based normalization is recommended, as it attenuates the influence of outliers [22].
Compensatory aggregation (geometric mean), as in the HDI itself: $I=\left(\prod_i x_i^{\prime}\right)^{\frac{1}{n}}$. To limit the compensation among dimensions, a partially non-compensatory aggregation is additionally adopted, which penalizes the heterogeneity among indicators (shifted geometric mean, with a parameter α that controls the degree of compensation) [28, 29].
Reference thresholds: each indicator (or the index) is compared with critical, alert, and optimal values, classifying the sub-area as at risk, on alert, or stable [26].
Sensitivity (highest-leverage indicators): for the geometric mean, $S_i=\frac{\partial I}{\partial x_i}=\frac{I}{n \cdot x^{\prime}_i}$. The marginal leverage is greatest precisely for the lowest subindex-a result that objectively grounds the prioritization of interventions [29].
The aggregation stage defines how the normalized indicators are combined into synthetic indices. Compensatory methods, such as the arithmetic and geometric means, allow good performance in one indicator to offset weak performance in another; the HDI itself adopts a geometric mean of its three dimensions. However, compensation can mask critical weaknesses: a sub-area with reasonable income may conceal a severe shortfall in education. For this reason, recent proposals combine compensatory and non-compensatory aggregations, penalizing the heterogeneity among the indicators of a given territory and preventing relevant shortfalls from being hidden [28]. One axiomatically grounded alternative is the shifted geometric mean, which controls the degree of compensation among indicators by means of an adjustable parameter [29]. The choice of aggregation method and of the weights assigned is, to some extent, subjective and should be made explicit, as it directly affects the results, which helps explain the sensitivity of the indices to the methodological approach adopted.
For the assessment of indicators to translate into a risk diagnosis, it is essential to establish reference values, or thresholds. The literature on the security dimension of sustainable development proposes associating each indicator with a set of thresholds (critical, alert, and optimal), so as to convert a reading of development into a reading of security: comparing the observed value with these boundaries makes it possible to classify a sub-area as being in a situation of risk, alert, or stability [26]. The definition of these boundaries can be supported by artificial-intelligence techniques and by cluster analysis, which reduce subjectivity and automate classification as new data are incorporated [26, 30].
3.6 Prioritization of indicators and identification of critical areas
Once the indices have been defined, the decisive step for the mission of the ODRS/SC is to identify which indicators hold the greatest potential to raise the performance of a sub-area-precisely the points at which limited interventions and resources produce the greatest effect. Sensitivity analysis, based on the derivative of the index with respect to each indicator, objectively pinpoints these highest-leverage indicators [29]. In a complementary way, prioritization frameworks combine two criteria: the level of performance, or urgency, assessed through historical trend, comparison with benchmarks, and distance from targets; and the level of influence, estimated through network analysis and centrality measures that capture the synergies and conflicts among indicators. Combining these criteria, by means of a multi-criteria analysis, ranks the priority indicators for each territory [23].
These procedures also make it possible to classify sub-areas into levels and positions of development, combining, for example, the level of sustainable development and the population’s standard of living, and to associate each position with development scenarios, from optimistic to pessimistic, that are useful for action planning [22].
3.7 Pilot application: Identifying the dimensions with the greatest leverage in the Serra Catarinense
To demonstrate the operationalization of the method with public and reproducible data, the database of the Atlas of Human Development in Brazil is used, whose subindices are already normalized to the [0, 1] interval. The 18 municipalities of the Association of Municipalities of the Serra Catarinense (AMURES) are analyzed, gathered in Table 2 in ascending order of HDI, with Santa Catarina and Brazil as references. Cerro Negro, the municipality with the lowest HDI in the state (0.621), is taken as a detailed case.
Table 2. Human Development Index (HDI) and subindices (income, longevity, and education) for the 18 Association of Municipalities of the Serra Catarinense (AMURES) municipalities, in ascending order of HDI, with Santa Catarina and Brazil as references (Atlas of Human Development, 2010 Census)
|
Territory |
HDI |
HDI-Income |
HDI-Longevity |
HDI-Education |
|
Cerro Negro |
0.621 |
0.634 |
0.829 |
0.455 |
|
São José do Cerrito |
0.636 |
0.618 |
0.827 |
0.503 |
|
Campo Belo do Sul |
0.641 |
0.648 |
0.768 |
0.528 |
|
Bocaina do Sul |
0.647 |
0.642 |
0.768 |
0.549 |
|
Rio Rufino |
0.653 |
0.652 |
0.806 |
0.530 |
|
Capão Alto |
0.654 |
0.680 |
0.796 |
0.516 |
|
Painel |
0.664 |
0.668 |
0.808 |
0.543 |
|
Palmeira |
0.671 |
0.655 |
0.827 |
0.557 |
|
Ponte Alta |
0.673 |
0.666 |
0.804 |
0.568 |
|
São Joaquim |
0.687 |
0.705 |
0.817 |
0.562 |
|
Anita Garibaldi |
0.688 |
0.667 |
0.826 |
0.592 |
|
Urubici |
0.694 |
0.722 |
0.823 |
0.562 |
|
Bom Jardim da Serra |
0.696 |
0.710 |
0.835 |
0.568 |
|
Bom Retiro |
0.699 |
0.704 |
0.869 |
0.559 |
|
Urupema |
0.699 |
0.667 |
0.823 |
0.622 |
|
Correia Pinto |
0.702 |
0.701 |
0.804 |
0.614 |
|
Otacílio Costa |
0.740 |
0.713 |
0.835 |
0.681 |
|
Lages |
0.770 |
0.755 |
0.867 |
0.697 |
|
Santa Catarina (reference) |
0.774 |
0.773 |
0.860 |
0.697 |
|
Brazil (reference) |
0.727 |
0.739 |
0.816 |
0.637 |
The regional pattern is clear and reproducible: in all 18 municipalities, education is the lowest subindex-and therefore the one with the greatest marginal leverage in the geometric mean-and education and income together constitute the two lowest dimensions. The regional averages of the subindices (education 0.567; income 0.678; longevity 0.818) confirm this reading and become sharper in contrast with the state (Santa Catarina: education 0.697; income 0.773; longevity 0.860): the region's gap is largest precisely in education (−0.130) and then in income (−0.095), being smallest in longevity (−0.042). Relative to Brazil, the region lies below the national average in education (−0.070) and income (−0.061) but at the same level in longevity (+0.002), which reinforces that the constraint on human development in the Serra Catarinense is, above all, educational and, secondarily, related to income. It was further verified that the geometric mean of the three subindices reproduces the published HDI for each of the 18 municipalities and for the state (consistency check).
Verification (reproducibility): the geometric mean of Cerro Negro's three subindices reproduces the published index: (0.455 × 0.634 × 0.829)(1/3) = 0.621.
Gap decomposition (distance to the high-development threshold, 0.700): education −0.245 (largest shortfall), income −0.066, and longevity already above the threshold (0.829). The constraint is therefore concentrated in education and, secondarily, in income.
Marginal sensitivity $\left(\frac{\partial \mathrm{IDHM}}{\partial x_i}=\frac{\mathrm{IDHM}}{3 x_i}\right)$: 0.455 for education, 0.326 for income, and 0.250 for longevity. That is, the same absolute gain in the education subindex raises the HDI about 1.4 times more than in income and 1.8 times more than in longevity.
Interpretation: both the gap decomposition and the sensitivity analysis point, in a convergent and reproducible way, to education and income as the dimensions with the greatest leverage for raising the HDI in the region-a result that replaces the previously unsupported statement and that guides resource allocation. The same procedure is replicable for the 18 AMURES municipalities and, subsequently, to the sub-areas (neighborhoods and districts) as the administrative data are integrated.
The choice of the visualization platform critically considered commercial and open-source alternatives according to criteria of cost, interoperability, reproducibility, learning curve, automatic updating, and geoprocessing, as shown in Table 3.
Table 3. Comparison of visualization platforms (Power BI, R/Shiny, Tableau, and open-source solutions) according to defined criteria
|
Criterion |
Power BI |
R/Shiny |
Tableau |
Metabase/Superset (Open-Source) |
|
Cost/licensing |
MS license (already at institution) |
Free (open) |
Commercial |
Free (open) |
|
Interoperability |
High (MS/Excel) |
High (via R) |
High |
High (SQL/DB) |
|
Reproducibility |
Medium |
High (version-controllable script) |
Medium |
Medium/High |
|
Learning curve |
Low |
High (requires R) |
Low |
Medium |
|
Automatic updating |
Yes |
Yes (with server) |
Yes |
Yes |
|
Geoprocessing |
Good |
Very good |
Good |
Limited |
Rationale for the choice: at the current stage, the ODRS/SC adopts Power BI for three objective reasons-Microsoft licensing already available at the institution (low marginal cost), a low learning curve for the team, and direct integration with the spreadsheet ecosystem in use. As a limitation, the lower reproducibility of the visual layer is noted; therefore, the computation of the indices is kept in version-controllable routines (scripts), reserving Power BI for visualization, which preserves the auditability of the results.
By supporting sustainable regional development through the production of research and projects capable of planning in detail the actions that best meet the needs of the population, the ODRS/SC comes to address a recurring need that affects the region. The low HDI of the municipalities of the Serra Catarinense may be influencing young people’s willingness not to remain in their home towns, given that this population, in absolute numbers, is declining as a result of the lack of prospects in the region. Coupled with the exodus of young people, public authorities face difficulties in proposing projects that would give them access to parliamentary budget allocations and funding from development agencies. This difficulty stems from the absence of a team qualified for such work. In this sense, proposing responsive actions that support managers in decision-making and in obtaining resources for the generation of employment and income, and that can contribute to the sustainable regional development of the region’s municipalities, means moving beyond a stance of mere observation to becoming an agent providing information useful for multidimensional development.
It is worth emphasizing at this point that the Observatory is established, with a physical and human structure capable of producing and disseminating information, methodologies, and knowledge. The database is operational and is being populated daily with data obtained from the various sources mentioned above.
The collection of primary data from the public sector faced limitations, which are reported here systematically. At the municipal level, property-tax and zoning data were requested only from the Municipality of Lages, the region's hub municipality; at this stage, no formal request was made to the other municipalities of the Serra Catarinense. In addition, several regional and state-level entities were contacted, from which no data were obtained: the refusals were generally justified by claims of data ownership and by concerns about its use, even though the purpose was strictly research and support for public policy. These access difficulties are themselves a relevant finding, as they reveal institutional barriers to data transparency that the Observatory seeks to help overcome.
Another situation to be considered concerns the 2022 census, whose data are still being compiled and interpreted by the responsible agency and therefore could not yet be used in this work.
The pilot application supports, in a reproducible way, the identification of education and income as the dimensions with the greatest leverage in the region. For Cerro Negro-the municipality with the lowest HDI in the state (0.621 [10]), with subindices of 0.455 (education), 0.634 (income), and 0.829 (longevity)-the marginal sensitivity of the HDI is greatest for the lowest subindex, objectively confirming education and income as intervention priorities. This pattern is not restricted to the extreme case: it recurs across the 18 AMURES municipalities and is reinforced by the contrast with the state, whose regional gap is larger in education and income than in longevity. Thus, the statement ceases to be a preliminary impression and derives instead from an explicit and replicable analysis.
However, the results have proven highly sensitive to the methodological approach and to the indicators used. The assessments revealed many discrepancies and inconsistencies that could lead to erroneous conclusions regarding decision-making. Metrics that reflect the measurement of the indices are still lacking, as is the inclusion of additional indices, such as those linked to sustainable development.
The sensitivity observed is, to a large extent, expected and tractable in light of recent literature. It arises from the choices of normalization, aggregation, and weighting of the indicators, so that making these procedures explicit and standardizing them tends to reduce the inconsistencies reported [28, 29]. The finding that education and income are the main drivers of the HDI discrepancies can be formalized through sensitivity analysis, which would objectively confirm these indicators as the highest-leverage ones for the region and would guide resource allocation [23, 29]. Moreover, treating the Serra Catarinense as a complex adaptive system, with non-linear interactions, feedback loops, and spatial spillovers among municipalities, helps explain why similar stimuli generate different impacts, and reinforces the importance of adaptive management and continuous monitoring [20]. Finally, care should be taken to ensure that the indices reflect effective changes in living conditions, and not merely formal progress, relying on well-defined reference thresholds to distinguish real progress from merely nominal gains [7, 26].
It is also worth noting that the ODRS/SC keeps pace with social innovation, encouraged by research and projects that can contribute to the search for innovative, creative solutions that help resolve economic and social problems that are difficult for the public sector, or even the private sector, to solve on its own. The ODRS/SC undertakes actions aimed at assisting the municipal authorities of the Serra Catarinense region in proposing projects that are responsive to society’s demands and eligible for submission to development agencies. In addition, the ODRS/SC designs and develops projects for professional training, so that the skills of entrepreneurs and workers generate economic and social value for businesses, individuals, and the region.
The knowledge generated by the ODRS/SC can be applied to the systematic formulation of projects that help build an important foundation for socioeconomic development and for the continuous monitoring of public policies, which may affect local and regional human-development indices.
In this sense, regional development observatories are understood as instruments capable of supporting the needs of public managers, since they are structured and endowed with the intellectual and technological resources required to contribute to building a sustainable development plan suited to securing resources for the financing of public policy.
Comparing the use of disconnected individual spreadsheets with the robustness of a scientific methodology applied to a database system integrated with Power BI highlights an important difference in the effectiveness of data analysis. Scattered spreadsheets, although useful for simple tasks, limit the ability to cross-reference information and apply complex statistical methods. By contrast, once created, the database offers a powerful platform for consolidating information, enabling the application of academic and scientific statistical methods as well as detailed professional analyses.
This integrated approach facilitates the transformation of raw data into actionable knowledge, essential for informed decision-making. Tools such as Power BI make it possible to create interactive visualizations and dynamic reports, fostering a deeper and more strategic understanding of the information. This is vital for initiatives such as the ODRS/SC, which benefit enormously from the ability to cross-reference data from different sources for a precise diagnosis, well-grounded forecasts, and the formulation of effective strategies.
Implementing these strategies can transform regional inequalities into opportunities for growth. Robust investments in education and health, together with the development of supporting infrastructure, are fundamental.
In addition, the sustainable management of natural resources and the creation of a regional observatory for continuous monitoring are essential to ensure the effectiveness of the policies implemented. Conservation efforts and sustainable agricultural practices are vital to safeguarding the well-being of future generations. Collaboration among government, the private sector, and civil society is fundamental to building a more inclusive, equitable, and prosperous future for all inhabitants of the Serra Catarinense.
In methodological terms, the continuous improvement of the ODRS/SC database entails adopting explicit criteria for the selection, normalization, and aggregation of indicators, combining compensatory and non-compensatory methods, defining reference thresholds, and employing sensitivity and influence analyses to prioritize interventions. This pathway, aligned with contemporary approaches to measuring sustainable development, transforms the Observatory from a data repository into an instrument of diagnosis and prognosis in the service of sustainable regional development.
Applying an integrated, evidence-based approach will enable not only the improvement of human-development indices, but also the creation of a sustainable and resilient environment. Success stories in Florianópolis and Criciúma, with their strategies of investment in technology, innovation, and infrastructure, offer valuable models that can be adapted by the municipalities of the Serra Catarinense. Regional integration and collaboration among municipalities strengthen the capacity to attract investment and implement effective development projects, transforming regional inequalities into opportunities for sustainable and equitable growth.
This work is supported by the Santa Catarina State Research and Innovation Support Foundation (FAPESC, Grant number 020/2022) for funding the research project that gave rise to the ODRS/SC, and the UNIPLAC through institutional support.
The work was conducted at the Sustainable Regional Development Observatory of Santa Catarina (ODRS/SC), University of Planalto Catarinense (UNIPLAC), Lages, Santa Catarina, Brazil.
Generative AI tools (Claude and NotebookLM) were used solely to improve readability and linguistic structure. No AI was used to generate scientific results or conclusions. Authors take full responsibility for the content.
[1] Fuzaro, P.A., Carniello, M.F. (2020). Comparative study of the municipal human development index and the Firjan municipal development index in the Metropolitan Region of Vale do Paraíba-SP. Desenvolvimento em Questão, 18(52): 75-100. https://doi.org/10.21527/2237-6453.2020.52.75-100
[2] Li, B., Gao, S., Liang, Y.L., et al. (2020). Estimation of regional economic development indicator from transportation network analytics. Scientific Reports, 10: 2647. https://doi.org/10.1038/s41598-020-59505-2
[3] Saab, F., Dias, F.O., Lopes, A.V., Ramalho, P.I.S. (2021). Public policies and human development: Factors that impact the HDI in Brazilian municipalities. RACE-Revista De Administração, Contabilidade E Economia, 20(2): 209-230. https://doi.org/10.18593/race.23354
[4] Muro, P., Mazziotta, M., Pareto, A. (2011). Composite indices of development and poverty: An application to MDGs. Social Indicators Research, 104(1): 1-18. https://doi.org/10.1007/s11205-010-9727-z
[5] Denardin, V.F., Alves, C.L.B., Cazella, A.A., Fett Junior, N., Lopes, P.R. (2022). Territorial approach to development: Natural dimension and contributions to the diagnosis and surveying of new scenarios. Revista Brasileira de Gestão e Desenvolvimento Regional, 18(1): 39-60. https://doi.org/10.54399/rbgdr.v18i1.6523
[6] Phillips, J. (2023). Determining sustainability using the environmental performance index and human development index-an alternative approach to the environmental human index through a holistic quantitative dynamic framework. Science of the Total Environment, 884: 163752. https://doi.org/10.1016/j.scitotenv.2023.163752
[7] Zhang, Y.P., Weber, O. (2026). From proxies to system state: Defining sustainability management against symbolic progress. Sustainable Development, 1-19. https://doi.org/10.1002/sd.71225
[8] Bianco, T.S.D., De Lima, J.F., Morejon, C.F.M. (2016). The regional sustainable development index in southern Brazil. Redes, 21(2): 8-28. https://doi.org/10.17058/redes.v21i2.6353
[9] UNDP. (2024). Atlas of human development in Brazil. https://www.undp.org/pt/brazil/desenvolvimento-humano/atlas-do-desenvolvimento-humano-no-brasil.
[10] PNUD, Ipea, Fundação João Pinheiro. (2000). Atlas do desenvolvimento humano no brasil. United Nations Development Programme (UNDP) Brazil, Institute for Applied Economic Research (Ipea), and João Pinheiro Foundation (FJP). https://repositorio.ipea.gov.br/entities/book/8f787bdd-b471-4bcc-93d5-4e03d0b70076.
[11] Neri, M. (2023). Mapa da Riqueza no Brasil. FGV Social. https://hdl.handle.net/10438/33805.
[12] Gumbowsky, A., Noernberg, E.I., Maia, E.D.W., Carvalho, K.V. (2022). Municipal human development index (MHDI): Study of the municipalities of Planalto Norte Catarinense and links between education and regional development. DRd-Desenvolvimento Regional em Debate, 12: 436-452. https://doi.org/10.24302/drd.v12.4025
[13] Prajapati, H.R. (2016). Advance in methodology of human development index. Social Science Research Network (SSRN), Electronic Journal. https://doi.org/10.2139/ssrn.3772148
[14] Fernandes, C.A., Kanan, L.A. (2023). Breve história do ODRS-SC. In Observatório do Desenvolvimento Regional Sustentável: Um olhar diligente para a Serra Catarinense. Lages, SC: Uniplac Editora.
[15] United Nations, Economic and Social Council. (2019). Special edition: Progress towards the sustainable development goals (report of the secretary-general, E/2019/68). 1-39. https://unstats.un.org/sdgs/files/report/2019/secretary-general-sdg-report-2019--EN.pdf.
[16] Wittmann, M.B., Trevisan, M., Ávila, L.V. (2025). Desenvolvimento sustentável como catalisador de um novo paradigma para o crescimento regional. Redes, 31: e19961. https://doi.org/10.17058/ghmf8z05
[17] Almeida, L.A., Firme, V. de A.C. (2023). Education and economic growth: A spatial-econometric analysis for the municipalities from southeast’s Brazil. Pesquisa e Planejamento Econômico, 53(1): 202-229. http://doi.org/10.38116/ppe53n1art6
[18] Micaliski, E.L., Radtke Junior, C.H., Hertes, A., Ordonhes, M.T., Figuerôa, K.M., Cavichiolli, F.R. (2023). The influence of the municipal human development index on the development of educational, income or leisure sports policies in Brazil. Retos, 51: 962-969. https://doi.org/10.47197/retos.v51.101375
[19] Oliveira, E.A. de A.Q., Santos, M.J., Fisch, G. (2024). Desenvolvimento regional e mudanças climáticas: Desafios do século XXI. Revista Brasileira de Gestão e Desenvolvimento Regional, 20(2). https://doi.org/10.54399/rbgdr.v20i2.7622
[20] Abujder Ochoa, W.A., Iarozinski Neto, A., Vitorio Junior, P.C., Calabokis, O.P., Ballesteros-Ballesteros, V. (2025). The theory of complexity and sustainable urban development: A systematic literature review. Sustainability, 17(1): 3. https://doi.org/10.3390/su17010003
[21] PNUD-United Nations Development Programme, Conceição, P. (2024). Human development report 2023-24: Breaking the gridlock: Reimagining cooperation in a polarized world. Elsevier BV. https://doi.org/10.2139/ssrn.4934148
[22] Łuczak, A., Cermakova, K., Kalinowski, S., Hromada, E., Mec, M. (2025). Measurement of sustainable development and standard of living in territorial units: Methodological concept and application. Sustainable Development, 33(3): 4604-4630. https://doi.org/10.1002/sd.3366
[23] Issa, L., El Fadel, M. (2026). Prioritization of the sustainable development goals: Developing and testing a novel framework under varying geographic scales. Sustainable Development, 34(2): 2251-2278. https://doi.org/10.1002/sd.70424
[24] Kosmin, A.D., Kuznetsova, O.P., Kosmina, E.A. (2019). Improved methodology for constructing and calculating the multidimensional human development index. Opcion, 35(S19): 1057-1083. https://produccioncientificaluz.org/index.php/opcion/article/view/24073.
[25] Shehovtseva, L.S., Chernyshkov, P.P. (2015). Objectives and institutions of regional development: Interdisciplinary methodology. International Journal of Economics and Financial Issues, 5(2): 19-24. https://izlik.org/JA45FL94WD.
[26] Dalberto, R.C., Ervilha, G.T., Bohn, L., Gomes, A.P. (2015). An efficient human development index: An alternative measurement of national well-being. Pesquisa e Planejamento Econômico, 45(2): 337-363. https://repositorio.ipea.gov.br/entities/publication/8535fc2f-f466-433e-a324-4a652ae0fc51.
[27] Blancas, F.J., Contreras, I. (2025). Global SDG composite indicator: A new methodological proposal that combines compensatory and non-compensatory aggregations. Sustainable Development, 33(1): 158-176. https://doi.org/10.1002/sd.3109
[28] Kouikoglou, V.S., Phillis, Y.A. (2025). On an aggregation theory for indicators expressing behaviors of complex systems with an application to sustainability. Sustainable Development, 34(3): 3304-3321. https://doi.org/10.1002/sd.70482
[29] Kharazishvili, Y., Kwilinski, A., Ivaniuta, S., Sukhodolia, O., Czart, P. (2025). System of indicators for the environmental component of sustainable development in the security dimension. Sustainable Development, 33(1): 146-160. https://doi.org/10.1002/sd.70000
[30] Manikandan, S., Kaviya, R.S., Shreeharan, D.H., et al. (2025). Artificial intelligence-driven sustainability: Enhancing carbon capture for sustainable development goals-A review. Sustainable Development, 33(2): 2004-2029. https://doi.org/10.1002/sd.3222