
Ghufran K. Azeez | Wisam S. Al-Rekabi*
© 2026 The authors. This article is published by IIETA and is licensed under the CC BY 4.0 license (http://creativecommons.org/licenses/by/4.0/).
OPEN ACCESS
The objective of this study is to assess the effectiveness and pollutant removal efficiency of Upflow Anaerobic Sludge Blanket (UASB) for treating effluent from dairy wastewater to produce quality water for sustainable reuse. Nine parameters- chemical oxygen demand (COD), biochemical oxygen demand (BOD), pH, temperature, electrical conductivity (EC), total suspended solids (TSS), total nitrogen (TN), total dissolved solids (TDS), and dissolved oxygen (DO) were examined in laboratory tests of dairy wastewater in order to evaluate its quality. The abatement efficiencies for COD, BOD, TSS, and TN were 76.09%–95.56%, 60.53%–94.10%, 58.85%–92.82%, and 16.66%–25.74%, respectively. With an organic loading rate (OLR) ranging from 7.28 to 1.6 kg COD/m3∙d, UASB technology can be applied to underdeveloped nations with limited resources and is an efficient integrated treatment system. Because the treatment method can meet effluent regulations, is inexpensive, and is simple to operate and maintain. The findings showed that COD, BOD, and TSS partially meet the standards at optimal operating conditions, with a hydraulic retention time (HRT) of 24 h, upflow velocity of 0.04 m/h, and flow rate of 2.91 L/h, while TN still does not meet all standards.
Upflow Anaerobic Sludge Blanket reactor, dairy wastewater, anaerobic treatment, chemical oxygen demand removal, biochemical oxygen demand removal, hydraulic retention time, organic loading rate
Wastewater production has increased as a result of urbanization and global population growth, since there is less space to build more wastewater treatment facilities. Furthermore, more stringent rules have been implemented to restrict the release of different contaminants; thus, it is essential to create new and different technologies for wastewater treatment [1]. One of the industries that generates wastewater that is high in organic matter is the dairy industry, which results in the generation of water that is foul-smelling and includes a lot of chemical oxygen demand (COD). The devastation of aquatic life and other marine organisms due to the discharge of dairy plant effluents into water resources can further deplete oxygen levels and provide extra food for microbial consortia. Anaerobic systems have been developed due to their ability to use methane gas and treat wastes with great strength [2]. One method of continuously operating anaerobic wastewater treatment is the Upflow Anaerobic Sludge Blanket (UASB). In the UASB, the wastewater flows vertically up from the bottom above the sludge blanket, where the waste is being digested by bacteria. Hydraulic retention time (HRT), up-flow velocity (Vup), and organic loading rate (OLR), changing operating temperature, and pH all had an important effect on UASB performance [3]. Low capital cost, low energy requirements, low operation and maintenance expenses, and sustainability are the fundamental criteria used when choosing technology for sewage treatment [4]. The gas collection, gas separation, feed input, and effluent withdrawal are the main physical components of a UASB reactor that need to be carefully considered. The UASB reactor is the only one with feed input and gas separation designs. In order to prevent channeling or the creation of dead zones, the feed inlet is designed to distribute wastewater uniformly [5]. The UASB method is a popular and reasonably priced technique for treating industrial wastewater. Anaerobic bacteria are used in this biological treatment process to break down organic materials in wastewater, with the end result being biogas [6].
Anaerobic digestion provides the dairy industry with a special treatment option as a result. Anaerobic digestion not only lowers an effluent's COD but also produces minimal microbial biomass. The largest benefit is the recovery of energy in the form of methane, and biogas can be produced from up to 95% of the organic matter in a waste stream. A common anaerobic reactor at both high and low temperatures is the UASB reactor. The most popular high-rate anaerobic method for treating anaerobic sewage is the UASB reactor. The most crucial factor influencing the size and form of the UASB reactor is the HRT rather than the OLR in the case of relatively weak wastewater, like sewage [7].
Several developments that have been reported for UASB include a 6-hour HRT experiment conducted to contrast the performance of a one-stage UASB reactor with a UASB digester system at low temperatures, such as 15 ℃. Researcher [8] discovered that UASB digesters outperform one-stage reactors in terms of conversion and separation efficiency. The sludge generated in the UASB reactor is considerably more stable. The UASB typically performs well in tropical nations. UASB was one of the potential methods for sludge stabilization and wastewater treatment. In order to handle wastewater in tropical regions, the UASB reactor was investigated at two distinct lower temperatures in this study.
Wastewater enters the UASB reactor at a natural temperature of between 22 and 26 ℃. HRT during the colder months is 2, 4, 6, 8, and 10 h with varying loading rates ranging from 0.95 to 5.70 kg COD/m3∙d. The removal effectiveness of BOD5, COD, and TSS was 54, 46, and 53% during the colder period and around 71, 63, and 65% during the warmer period [9].
The investigated catechol biodegradation in aqueous solution by co-metabolism with glucose as the major substrate in a UASB reactor; according to their batch investigations, catechol in an aqueous solution may be co-metabolized and degraded up to a concentration of 1000 mg/L glucose at a concentration of 1000 mg/L. With a good COD removal efficiency of almost 95% [10].
Despite numerous studies addressing dairy water treatment by UASB, these studies have not focused on evaluating reactor performance using key operating conditions, namely, flow rate (Q), HRT, and environmental conditions (temperature, pH) during the summer season. Real operational data from a UASB reactor that treats dairy wastewater in Al-Samawa, Iraq, over the summer is presented in this article. The work is important since it evaluates the impacts of Q, HRT, temperature, and pH at high ambient temperatures, as well as whether the treated effluent is suitable for environmental discharge regulations. The results offer a regional case study and useful recommendations for the use of inexpensive anaerobic treatment systems in the Iraqi dairy sector.
The main objective of this research is to evaluate UASB technology as an alternative and efficient method for treating dairy wastewater in Al Samawa City under different operating conditions. It also aims to determine the HRT that provides the best removal rates of COD, BOD, TN, and TSS, and to compare the UASB effluent with effluent discharge standards.
2.1 Reactor design and operation
The reactor used in this experiment is a laboratory-scale UASB reactor. The UASB reactor volume is 70 L; it is a cylindrical-shaped glass fiber-reinforced polypropylene tank. The UASB has a height of 132cm with an internal diameter of 30cm. Seven sample ports were provided along the reactor height, and a gas-liquid-solid separator (GLSS) was added on top of the UASB. The height of the GLSS is 32 cm. A port for gas outlet at the top of the reactor, as shown in Figure 1, and Table 1 shows important operating design parameters for UASB. The UASB was inoculated with sludge seeds from the Al-Thaghar wastewater treatment plant in Basrah city.
About 7 L of digested sludge were added to the reactor, which represents 10% of the reactor's total volume. Influent wastewater was added from the reactor's bottom via a distribution system.
After the start-up period of about two months, where the formation of sludge granulation at temperatures (35–37 ℃) at HRT of 24 h and an Vup of 0.04 m/h. The start-up phase until it reached a COD removal efficiency of 73.85%. The steady state was started after UASB stabilization since this level of removal indicated stable reactor functioning. Table 2 shows the start-up period for sampling frequency and dates. The steady-state operation of the UASB research test period lasted about three months (July, August, September), with operating HRT of 6, 12, 24 h and Vup of 0.164, 0.08, 0.04 m/h, respectively.
Figure 1. Design details of the Upflow Anaerobic Sludge Blanket (UASB) reactor
Table 1. Operating design parameters for Upflow Anaerobic Sludge Blanket (UASB)
|
Parameters |
Value |
|
Volume (L) |
70 |
|
Diameter (φ) (cm) |
30 |
|
Height (cm) |
132 |
|
Temperature (℃) |
35–37 |
|
HRT (h) |
6, 12, 24 |
|
Upflow velocity (m/h) |
0.164, 0.08, 0.04 |
|
Flow rate (Q) (L/h) |
11.6, 5.8, 2.91 |
Table 2. Start-up period
|
Parameters |
Number of Readings |
Date |
|
COD (mg/L) |
8 |
1/5/2025–30/6/2025 |
|
BOD (mg/L) |
8 |
1/5/2025–30/6/2025 |
|
TSS (mg/L) |
8 |
1/5/2025–30/6/2025 |
|
TN (mg/L) |
8 |
1/5/2025–30/6/2025 |
2.2 Analytical methods and collection of samples
A digital device assessed temperature, pH, and dissolved oxygen (DO), total dissolved solids (TDS), electrical conductivity (EC), COD, BOD, TSS, and TN, using the standard method of the American Public Health Association (APHA) [11]. The samples are analyzed utilizing the DR5000 and DR1900 Hach spectrophotometer instruments. Filter paper with a pore size of 0.45 µm was used to filter wastewater samples when the test called for it.
This study focuses on the treatment of dairy factory wastewater. The samples were collected from the effluent of dairy wastewater from the dairy factory in Al-Samawa City in the mid-south of Iraq, and each sample was filled in a 30-liter plastic container. Samples were taken for analysis from the influent and effluent of the UASB once time every week. With the exception of pH, DO, and temperature, which were measured daily, the results were averaged weekly. It was noted that 12 separate samples were gathered and examined at each HRT operational stage, whereas each influent and effluent sample was examined just once. Table 3 shows the raw dairy wastewater characteristics.
Table 3. Raw wastewater characteristics
|
Parameters |
Range |
Average |
|
COD (mg/L) |
1450–1800 |
1625 |
|
BOD (mg/L) |
550–750 |
650 |
|
TSS (mg/L) |
600–766 |
683 |
|
TN (mg/L) |
50–69 |
59.5 |
During this research, three discharges (11.6, 5.8, 2.91) L/h were adopted, with HRT in the reactor ranging from 6, 12, and 24 h.
The equation that follows is used to calculate the removal efficiency of any pollutant [12]:
Removal efficiency $\%=\frac{\left[A_o-A_t\right]}{A_o}$ (1)
where,
Ao = Pollutant concentration at time zero, mg/L
At = Pollutant concentration after time t, mg/L
The following formula was applied to calculate the OLR [13]:
$O L R=\frac{\operatorname{COD}_{i n}}{H R T}$ (2)
where,
CODin = Influent COD concentration (kg/m3)
HRT = Hydraulic retention time (day)
Table 4. Experimental operation
|
Parameters |
HRT (h) |
Number of Readings |
SD |
Mean |
|
COD (mg/L) |
6 12 24 |
12 12 12 |
2.4 1.35 2.35 |
80.24 80.89 92.62 |
|
BOD (mg/L) |
6 12 24 |
12 12 12 |
3.64 2.12 2.43 |
65.29 73.77 90.02 |
|
TSS (mg/L) |
6 12 24 |
12 12 12 |
3.2 4.79 7.89 |
66.53 70.48 81.37 |
|
TN (mg/L) |
6 12 24 |
12 12 12 |
0.49 0.75 1.4 |
18.43 19.09 22.9 |
At a temperature of 35–37 ℃, the DO values were 0.31–0.01 mg/L in dairy wastewater. The rates of pH varied; it recorded the lowest value of 7.2 at HRT 6 h and the highest value of 7.8 at HRT 24 h. The rates of EC varied; it recorded the highest value of 3634 mg/L at HRT 6 h and the lowest value of 3103 mg/L at HRT 24 h. The rates of TDS varied; it recorded the highest value of 2543 mg/L at HRT 6 h and the lowest value of 2117 mg/L at HRT 12 h. Table 4 shows the experimental operation.
3.1 Chemical oxygen demand removal at different hydraulic retention times
Figure 2 shows monthly changes in the summer months (July, August, September) of COD results at different HRTs. In Figure 3, the COD removal is over 95%. At HRT 6 h, the effluent COD concentrations diminished from 435 mg/L to 293.2 mg/L. The corresponding OLR, determined using the operating conditions, decreased overall from 7.28 to 6.79 kg COD/m3∙d, while the average removal efficiency increased from 76.09% to 82.73%.
At HRT 12 h, the effluent COD concentrations diminished from 379 mg/L to 290.3 mg/L with OLR from 3.6 to 3.3 kg COD/m3∙d, while the average removal efficiency increased from 78.97% to 83.37%. At HRT 24 h, the effluent COD concentrations diminished from 214.6 mg/L to 72 mg/L with OLR from 1.8 to 1.6 kg COD/m3∙d, while the average removal efficiency increased from 88.27% to 95.56%.
A comparison between UASB effluent quality and discharge standards showed that, at an HRT of 24 h, the COD values in Tests 8–12 complied with the Iraqi wastewater discharge specifications for WWTP effluents. COD at 24 h in all tests (1–12) complies with Environmental Health and Safety in Table 5. Table 6 shows contaminant compliance with standard limits by HRT and test number. Table 7 shows the results of the COD concentration.
Table 5. The effluent standards of certain pollutants in countries
|
Parameter |
Iraqi Specifications from WWTPs [14] |
Environmental, Health, and Safety [15] |
|
BOD (mg/L) |
40 |
50 |
|
COD (mg/L) |
100 |
250 |
|
TN (mg/L) |
- |
10 |
|
TSS (mg/L) |
60 |
50 |
Table 6. Contaminant compliance with standards
|
Parameter |
HRT (h) |
Test Number Compliance with Iraqi Specification |
Test Number Compliance with Environmental Health and Safety |
|
BOD (mg/L) |
24 |
11, 12 |
11, 12 |
|
COD (mg/L) |
24 |
8–12 |
1–12 |
|
TSS (mg/L) |
24 |
11, 12 |
11, 12 |
Table 7. Results of chemical oxygen demand (COD)
|
HRT (h) |
Test Number |
Influent |
OLR |
Effluent |
Removal Efficiency (%) |
|
6 |
1 |
1820 |
7.28 |
435 |
76.098 |
|
2 |
1800 |
7.2 |
421 |
76.611 |
|
|
3 |
1790 |
7.16 |
411 |
77.039 |
|
|
4 |
1600 |
6.4 |
351 |
78.062 |
|
|
5 |
1688 |
6.752 |
325 |
80.746 |
|
|
6 |
1744 |
6.976 |
332 |
80.963 |
|
|
7 |
1738 |
6.952 |
330 |
81.012 |
|
|
8 |
1667 |
6.668 |
314.4 |
81.139 |
|
|
9 |
1623 |
6.492 |
303 |
81.330 |
|
|
10 |
1668 |
6.672 |
298.4 |
82.110 |
|
|
11 |
1614 |
6.456 |
280.3 |
82.633 |
|
|
12 |
1698 |
6.792 |
293.2 |
82.732 |
|
|
12 |
1 |
1803 |
3.606 |
379 |
78.979 |
|
2 |
1795 |
3.59 |
377 |
78.997 |
|
|
3 |
1798 |
3.596 |
355.6 |
80.222 |
|
|
4 |
1612 |
3.224 |
331.5 |
79.435 |
|
|
5 |
1690 |
3.38 |
328.8 |
80.544 |
|
|
6 |
1710 |
3.42 |
331 |
80.643 |
|
|
7 |
1801 |
3.602 |
341.4 |
81.043 |
|
|
8 |
1629 |
3.258 |
301.1 |
81.516 |
|
|
9 |
1678 |
3.356 |
304.6 |
81.847 |
|
|
10 |
1705 |
3.41 |
307.7 |
81.953 |
|
|
11 |
1637 |
3.274 |
291.5 |
82.193 |
|
|
12 |
1746 |
3.492 |
290.3 |
83.373 |
|
|
24 |
1 |
1830 |
1.83 |
214.6 |
88.273 |
|
2 |
1771 |
1.771 |
190.6 |
89.237 |
|
|
3 |
1796 |
1.796 |
170.2 |
90.523 |
|
|
4 |
1676 |
1.676 |
150 |
91.050 |
|
|
5 |
1671 |
1.671 |
130.2 |
92.208 |
|
|
6 |
1782 |
1.782 |
121.3 |
93.193 |
|
|
7 |
1790 |
1.79 |
111.3 |
93.782 |
|
|
8 |
1643 |
1.643 |
97.4 |
94.071 |
|
|
9 |
1608 |
1.608 |
94 |
94.154 |
|
|
10 |
1765 |
1.765 |
91 |
94.844 |
|
|
11 |
1567 |
1.567 |
84 |
94.639 |
|
|
12 |
1625 |
1.625 |
72 |
95.569 |
3.2 Biochemical oxygen demand removal at different hydraulic retention times
Figures 4 and 5 show the BOD results and removal efficiency at different HRTs, respectively. At HRT 6 h, the effluent BOD concentrations diminished from 296 mg/L to 205.8 mg/L, while the removal efficiency increased from 60.53% to 70.6% (Table 8). At HRT 12 h, the effluent BOD concentrations diminished from 207.3 mg/L to 148 mg/L, while the removal efficiency increased from 71.60% to 77.57%. At HRT 24 h, the effluent BOD concentrations diminished from 101.6 mg/L to 39.3 mg/L, while the removal efficiency increased from 85.94% to 94.10%. A comparison of UASB effluent quality and discharge standards showed BOD at 24 h in only Tests 11 and 12, which could be compared with Iraqi Specifications from WWTPs and Environmental, Health, and Safety (Table 5).
Table 8. Results of biochemical oxygen demand (BOD)
|
HRT (h) |
Test Number |
Influent |
Effluent |
Removal Efficiency (%) |
|
6 |
1 |
750 |
296 |
60.5333 |
|
2 |
736 |
291 |
60.461 |
|
|
3 |
730 |
286 |
60.821 |
|
|
4 |
677 |
256.4 |
62.127 |
|
|
5 |
700 |
245 |
65 |
|
|
6 |
720 |
241 |
66.527 |
|
|
7 |
719 |
239 |
66.759 |
|
|
8 |
688 |
227 |
67.005 |
|
|
9 |
670 |
220 |
67.164 |
|
|
10 |
680 |
219 |
67.794 |
|
|
11 |
671 |
210 |
68.703 |
|
|
12 |
700 |
205.8 |
70.6 |
|
|
12 |
1 |
730 |
207.3 |
71.602 |
|
2 |
726 |
211 |
70.936 |
|
|
3 |
729 |
206.5 |
71.673 |
|
|
4 |
660 |
184 |
72.121 |
|
|
5 |
688 |
186.2 |
72.936 |
|
|
6 |
690 |
184.5 |
73.260 |
|
|
7 |
721 |
188.3 |
73.883 |
|
|
8 |
666 |
171.7 |
74.219 |
|
|
9 |
650 |
166 |
74.461 |
|
|
10 |
690 |
167 |
75.797 |
|
|
11 |
695 |
161 |
76.834 |
|
|
12 |
660 |
148 |
77.575 |
|
|
24 |
1 |
723 |
101.6 |
85.947 |
|
2 |
705 |
93 |
86.808 |
|
|
3 |
708 |
79 |
88.841 |
|
|
4 |
685 |
81 |
88.175 |
|
|
5 |
682 |
77 |
88.709 |
|
|
6 |
708 |
71 |
89.971 |
|
|
7 |
705 |
66 |
90.638 |
|
|
8 |
666 |
60.5 |
90.915 |
|
|
9 |
651 |
57.2 |
91.213 |
|
|
10 |
675 |
52 |
92.296 |
|
|
11 |
654 |
47.7 |
92.706 |
|
|
12 |
667 |
39.3 |
94.107 |
3.3 Total nitrogen removal at different hydraulic retention times
Figures 6 and 7 show the TN results and removal efficiency at different HRTs, respectively. At HRT 6 h, the effluent TN concentrations changed slightly from 55.0 to 55.3 mg/L, while the removal efficiency increased from 16.66% to 19.85% (Table 9). At HRT 12 h, the effluent TN concentrations diminished from 44.8 mg/L to 40.5 mg/L, while the removal efficiency increased from 18.54% to 20.43%. At HRT 24 h, the effluent TN concentrations reduced from 54.1 mg/L to 45 mg/L, while the removal efficiency increased from 20.90% to 25.74%. A comparison of UASB effluent quality and discharge standards showed that TN does not meet all standards. The anaerobic nature of the UASB system and the absence of integrated nitrification and denitrification conditions hampered UASB's ability to remove TN. As a result, TN concentrations continued to be higher than those allowed by environmental regulations.
Table 9. Results of total nitrogen (TN)
|
HRT (h) |
Test Number |
Influent |
Effluent |
Removal Efficiency (%) |
|
6 |
1 |
66 |
55 |
16.666 |
|
2 |
68 |
56 |
17.647 |
|
|
3 |
65 |
53.3 |
18 |
|
|
4 |
60 |
49.1 |
18.166 |
|
|
5 |
63 |
51.2 |
18.730 |
|
|
6 |
58 |
46.9 |
19.137 |
|
|
7 |
62 |
50.2 |
19.032 |
|
|
8 |
59 |
47.9 |
18.813 |
|
|
9 |
62 |
50.6 |
18.387 |
|
|
10 |
64 |
53 |
17.187 |
|
|
11 |
67 |
53.9 |
19.552 |
|
|
12 |
69 |
55.3 |
19.855 |
|
|
12 |
1 |
55 |
44.8 |
18.545 |
|
2 |
58 |
47.1 |
18.793 |
|
|
3 |
61 |
49.3 |
19.180 |
|
|
4 |
63 |
50.9 |
19.206 |
|
|
5 |
59 |
47.8 |
18.983 |
|
|
6 |
52 |
42.1 |
19.038 |
|
|
7 |
53 |
42.8 |
19.245 |
|
|
8 |
59 |
47.7 |
19.1525 |
|
|
9 |
57 |
45.8 |
19.649 |
|
|
10 |
51 |
42.2 |
17.254 |
|
|
11 |
50 |
40.2 |
19.6 |
|
|
12 |
50.9 |
40.5 |
20.432 |
|
|
24 |
1 |
68.4 |
54.1 |
20.906 |
|
2 |
63.2 |
49.7 |
21.360 |
|
|
3 |
58.4 |
45.9 |
21.404 |
|
|
4 |
66.1 |
51.6 |
21.936 |
|
|
5 |
63.1 |
48.9 |
22.503 |
|
|
6 |
62 |
47.8 |
22.903 |
|
|
7 |
62.9 |
48.4 |
23.052 |
|
|
8 |
63.4 |
48.7 |
23.186 |
|
|
9 |
55 |
42 |
23.636 |
|
|
10 |
57.3 |
43.8 |
23.560 |
|
|
11 |
58.1 |
43.8 |
24.612 |
|
|
12 |
60.6 |
45 |
25.742 |
3.4 Total suspended solids removal at different hydraulic retention times
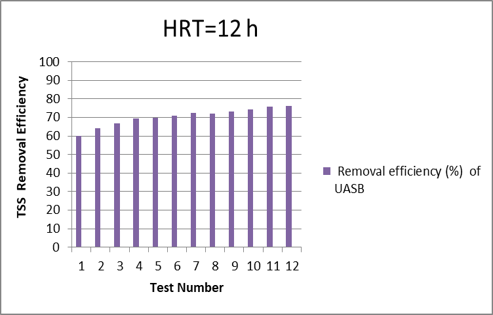
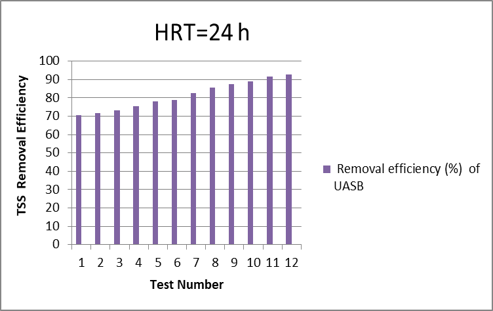
Figures 8 and 9 show the TSS results and removal efficiency at different HRTs, respectively. At HRT 6 h, the effluent TSS concentrations diminished from 288 mg/L to 224 mg/L (Table 10), while the removal efficiency increased from 58.85% to 69.85%. At HRT 12 h, the effluent TSS concentrations diminished from 280 mg/L to 180mg/L, while the removal efficiency increased from 60.17% to 76.31%. At HRT 24 h, the effluent TSS concentrations diminished from 210 mg/L to 52 mg/L, while the average removal efficiency increased from 70.42% to 92.82%. A comparison of UASB effluent quality and discharge standards showed that TSS at 24 h in only Tests 11 and 12 could meet Iraqi Specifications from WWTPs and Environmental, Health, and Safety. As detailed in Table 5.
Table 10. Results of total suspended solids (TSS)
|
HRT (h) |
Test Number |
Influent |
Effluent |
Removal Efficiency (%) |
|
6 |
1 |
700 |
288 |
58.85 |
|
2 |
750 |
272 |
63.733 |
|
|
3 |
731 |
265 |
63.748 |
|
|
4 |
766 |
268 |
65.013 |
|
|
5 |
638 |
220 |
65.517 |
|
|
6 |
754 |
245 |
67.506 |
|
|
7 |
764 |
240 |
68.586 |
|
|
8 |
719 |
229 |
68.150 |
|
|
9 |
730 |
227 |
68.904 |
|
|
10 |
741 |
229 |
69.095 |
|
|
11 |
740 |
226 |
69.459 |
|
|
12 |
743 |
224 |
69.851 |
|
|
12 |
1 |
703 |
280 |
60.170 |
|
2 |
710 |
255 |
64.084 |
|
|
3 |
730 |
242 |
66.849 |
|
|
4 |
760 |
231 |
69.605 |
|
|
5 |
740 |
223 |
69.864 |
|
|
6 |
750 |
219 |
70.8 |
|
|
7 |
766 |
210 |
72.584 |
|
|
8 |
720 |
200 |
72.222 |
|
|
9 |
726 |
194 |
73.278 |
|
|
10 |
740 |
190 |
74.324 |
|
|
11 |
750 |
182 |
75.733 |
|
|
12 |
760 |
180 |
76.315 |
|
|
24 |
1 |
710 |
210 |
70.422 |
|
2 |
705 |
200 |
71.631 |
|
|
3 |
730 |
195 |
73.287 |
|
|
4 |
750 |
184 |
75.466 |
|
|
5 |
760 |
168 |
77.894 |
|
|
6 |
668 |
142 |
78.742 |
|
|
7 |
709 |
123 |
82.651 |
|
|
8 |
702 |
102 |
85.470 |
|
|
9 |
710 |
90 |
87.323 |
|
|
10 |
709 |
77 |
89.139 |
|
|
11 |
721 |
60 |
91.678 |
|
|
12 |
725 |
52 |
92.827 |
3.5 Description of operating conditions
Increasing the HRT resulted in lower effluent COD concentrations. An HRT of 24 h achieved the highest removal efficiencies: 95.56% for COD, 94.10% for BOD, and 92.82% for TSS. This is consistent with Utami et al. [3], a higher HRT usually results in greater reactor performance in terms of removal efficiency and has been observed to do so for an UASB with COD levels that HRT increased from 36 h to 72 h, increase in COD removal efficiency of 55.64% to 66.81%, BOD5 from 67.85% to 74.58%; and TSS from 66.69% to 84.19% [3].
The results showed that the temperature range from 35 to 37 ℃ leads to increased removal of organic pollutants, COD, BOD, and TSS, as anaerobic bacteria become more active at high temperatures in July, August, and September.
Padilla-Gasca and López-López [16] found that the removal efficiency of COD was 86.1% at 35 ℃. The pH of the effluent from the UASB is between 7.2 and 7.8, and the COD and BOD removal increase with varying pH between 7.2 and 7.8. At pH 7.2, the COD removal is 76.098%, and at pH 7.8, the COD removal is 94.639%. More than 80% of COD is removed in UASB, which occurs best in an environment at a pH of 7 [17]. The pH range 6.5 to 7.8 in order to achieve greater results [18].
3.6 Comparing with other Upflow Anaerobic Sludge Blanket system studies
Table 11 shows that the removal efficiency of the present study was compared with the removal efficiencies of other system studies. This study's COD removal efficiency is higher than that of research by Tandukar et al. [19] and Seghezzo et al. [20], and is consistent with Elmitwalli et al. [21]. The BOD removal efficiency was the closest to that of research by Seghezzo et al. [20] and higher than that of Tandukar et al. [19].
Table 11. Comparison of the Upflow Anaerobic Sludge Blanket (UASB) with other studies
|
Temperature (℃) |
HRT (h) |
COD (%) |
BOD (%) |
Reference |
|
35–37 |
(6–24) |
(76.09–95.56) |
(60.53–94.10) |
This study |
|
9–32 |
6 |
63 |
53 |
[19] |
|
- |
6 |
69 |
80 |
[20] |
|
14–24 |
(8–20) |
79 |
- |
[21] |
This study aimed to evaluate the effectiveness of UASB under different conditions. The UASB proved effective in the summer months. Higher temperatures resulted in higher removal rates. Based on the experimental results, the UASB reactor operated at an HRT of 24 h, an upflow velocity of 0.04 m/h, and a flow rate of 2.91 L/h, producing effluent COD, BOD, and TSS values that complied with the Iraqi WWTP discharge specifications and the Environmental, Health, and Safety guidelines. Under these conditions, the highest removal efficiencies were achieved: 95.56% for COD, 94.10% for BOD, and 92.82% for TSS. A comparison of UASB effluent quality with discharge standards showed that TN concentrations at different HRTs did not meet all standards and exhibited low removal efficiency. COD removal efficiency decreased when the OLR exceeded 7 kg COD/m3∙d. This directly affects methanogenic activity and ultimately reduces COD removal due to microbial inhibition; moreover, an overloaded sludge blanket cannot tolerate high toxicity. Under the experimental conditions, a longer HRT (24 h) and a lower OLR corresponded to a higher COD removal rate.
[1] Ibrahim, H.T., Al-Aboodi, A.H., Abbas, S.A. (2018). Nutrients removal from domestic wastewater in Basrah City (Southern Iraq) using combined A2/O bio contact oxidation technology. E3S Web of Conferences, 65: 05001. https://doi.org/10.1051/e3sconf/20186505001
[2] Bharati, S., Shinkar, N. (2013). Comparative study of various treatments for dairy industry wastewater. IOSR Journal of Engineering, 3(8): 42-47. https://doi.org/10.9790/3021-03844247
[3] Utami, I., Redjeki, S., Astuti, D.H., Sani. (2016). Biogas production and removal COD–BOD and TSS from wastewater industrial alcohol (vinasse) by modified UASB bioreactor. MATEC Web of Conferences, 58: 01005. https://doi.org/10.1051/matecconf/20165801005
[4] Khan, A.A., Gaur, R.Z., Mehrotra, I., Diamantis, V., Lew, B., Kazmi, A.A. (2014). Performance assessment of different STPs based on UASB followed by aerobic post-treatment systems. Journal of Environmental Health Science & Engineering, 12: 43. https://doi.org/10.1186/2052-336X-12-43
[5] Rizvi, H. (2010). Sewage treatment by an upflow anaerobic sludge blanket reactor (UASB) under subtropical conditions. Ph.D. Dissertation, University of the Punjab.
[6] Alawadi, W.A., Al-Khafaji, S.A., Al-Rekabi, W.S. (2023). The effectiveness of up-flow anaerobic sludge blanket for treating industrial sewage: A brief review. Eurasian Journal of Engineering and Technology, 20: 18-23. https://geniusjournals.org/index.php/ejet/article/view/4684.
[7] Hassan, A.N., Nelson, B.K. (2012). Invited review: Anaerobic fermentation of dairy food wastewater. Journal of Dairy Science, 95(11): 6188-6203. https://doi.org/10.3168/jds.2012-5732
[8] Mahmoud, N., Zeeman, G., Gijzen, H., Lettinga, G. (2003). Anaerobic sewage treatment in a one-stage UASB and a combined UASB-digester system. In Seventh International Water Technology Conference, Egypt, pp. 307-322. https://fada.birzeit.edu/jspui/bitstream/20.500.11889/3526/3/Anaerobic%20sewage%20treatment%20in%20a%20one-stage%20UASB%20reactor.pdf.
[9] Azimi, A.A., Zamanzadeh, M. (2004). Determination of design criteria for UASB reactors as a wastewater pretreatment system in tropical small communities. International Journal of Environmental Science and Technology, 1: 51-57. https://doi.org/10.1007/BF03325816
[10] Subramanyam, R., Mishra, I.M. (2007). Biodegradation of catechol (2-hydroxy phenol) bearing wastewater in a UASB reactor. Chemosphere, 69: 816-824. https://doi.org/10.1016/j.chemosphere.2007.04.064
[11] American Public Health Association (APHA). (1999). Standard methods for the examination of water and wastewater. APHA.
[12] Riffat, R., Husnain, T. (2013). Fundamentals of Wastewater Treatment and Engineering. IWA Publishing.
[13] Al-Khafaji, S.A. (2024). Effectiveness of moving bed biofilm reactor (MBBR) for hospital wastewater treatment in South of Iraq (Basrah City). Ph.D. Thesis, University of Basrah, College of Engineering, Iraq.
[14] Al-Murshady, K.R, Al-Qaisi, A.Z, Ali, Z.H. (2021). The ability of using treated wastewater for irrigation purposes: Middle Euphrates of Iraq as a case study. IOP Conference Series: Earth and Environmental Science, 779: 012101. https://doi.org/10.1088/1755-1315/779/1/012101
[15] Environmental, Health, and Safety Guidelines for Dairy Processing. (2007). International Finance Corporation (IFC), World Bank Group.
[16] Padilla-Gasca, E., López López, A. (2010). Kinetics of organic matter degradation in an upflow anaerobic filter using slaughterhouse wastewater. Journal of Bioremediation and Biodegradation, 1(2): 106. https://doi.org/10.4172/2155-6199.1000106
[17] Zhang, B., Zhang, L.L., Zhang, S.C., Shi, H.Z., Cai, W.M. (2005). The influence of pH on hydrolysis and acidogenesis of kitchen wastes in two-phase anaerobic digestion. Environmental Technology, 26(3): 329-340. https://doi.org/10.1080/09593332608618563
[18] Gómez, R.R. (2011). Up-flow anaerobic sludge blanket reactor: Modeling. Royal Institute of Technology (KTH), Sweden. https://kth.diva-portal.org/smash/get/diva2:394741/FULLTEXT02.pdf.
[19] Tandukar, M., Ohashi, A., Harada, H. (2007). Performance comparison of a pilot-scale UASB and DHS system and activated sludge process for the treatment of municipal wastewater. Water Research, 41(12): 2697-2705. https://doi.org/10.1016/j.watres.2007.02.027
[20] Seghezzo, L., Zeeman, G., van Lier, J.B., Hamelers, H.V.M., Lettinga, G. (1998). A review: The anaerobic treatment of sewage in UASB and EGSB reactors. Bioresource Technology, 65(3): 175-190. https://doi.org/10.1016/S0960-8524(98)00046-7
[21] Elmitwalli, T.A., Shalabi, M., Wendland, C., Otterpohl, R. (2007). Grey water treatment in UASB reactor at ambient temperature. Water Science and Technology, 55(7): 173-180. https://doi.org/10.2166/wst.2007.142