I Made Agus Putrawan | Samuel Alfred Manumpil | I Nyoman Suprapta Winaya* | Made Suarda | I Ketut Gede Wirawan | I Putu Angga Yuda Pratama | I Gusti Ngurah Putu Tenaya
© 2026 The authors. This article is published by IIETA and is licensed under the CC BY 4.0 license (http://creativecommons.org/licenses/by/4.0/).
OPEN ACCESS
The increasing global demand for energy, combined with the finite supply of fossil fuels, has accelerated the search for renewable alternatives. Refuse-derived fuel (RDF), recovered from the combustible fraction of municipal solid waste (MSW), is an attractive option because it simultaneously advances energy diversification and waste management; its high moisture content (MC), however, remains the principal barrier to efficient utilization. This study experimentally evaluates the influence of RDF MC on the combustion performance of coal–RDF co-firing in a laboratory-scale bubbling fluidized bed (BFB) incinerator fabricated from an SS304 pipe with a nominal diameter of 55 mm and height of 700 mm. Fluidizing air was supplied through an 8.5-mm inlet pipe, in which the measured air velocity was maintained at approximately 9 m/s. RDF was prepared at target MC of 25% and 40%, corresponding to measured values of 23.65% and 43.16%, and blended with coal at a 10:90 as-received mass ratio. Increasing the RDF MC reduced the solid-fuel gross calorific value (GCV) from 5.96 to 4.32 MJ/kg. Consequently, the net plant heat rate (NPHR) rose by 27.5% (from 926.1 to 1180.6 kcal/kWhth), while the combustion efficiency declined from 92.92% to 72.89%. This deterioration is attributed to the additional latent-heat demand for water evaporation, which delays ignition and promotes incomplete combustion, as confirmed by the higher CO and CH₄ emissions and the longer burnout time. The higher-moisture condition produced a deeper temperature decrease at T2 in the splash zone, where the temperature declined by approximately 369.4 ℃. This result indicates that higher RDF MC increases temperature fluctuations and can reduce thermal stability during co-firing. Therefore, RDF MC should be properly controlled to maintain stable co-firing operation.
refuse-derived fuel, moisture content, bubbling fluidized bed, coal–RDF co-firing optimization, combustion efficiency, net plant heat rate
Energy is a fundamental requirement of modern civilization and the principal driver of global industrial activity. Despite the growing scarcity of fossil resources, global energy systems remain heavily dependent on them, and demand continues to rise with population growth. Indonesia, with a population of approximately 280 million and an annual growth rate of 0.62%, is projected to reach 335 million inhabitants by 2050 [1]. This trajectory intensifies the search for alternative and, in particular, renewable energy sources capable of averting a future energy crisis.
Although the Indonesian government has targeted a renewable share of 23% in the national energy mix by 2025 and at least 31% by 2050 [2], the current contribution remains around 12.3%. Coal therefore continues to dominate national energy supply, yet its combustion is a major source of the greenhouse-gas emissions that aggravate global warming [3]. Among the available mitigation strategies, biomass co-firing is attractive because it reduces net emissions without requiring substantial modification of existing power-generation systems [4].
Fluidized bed combustion (FBC) offers high efficiency through the intimate mixing of bed material and fuel, together with the flexibility to burn a wide range of fuels, including refuse-derived fuel (RDF) produced from municipal solid waste (MSW). The use of RDF supports both energy diversification and waste management: Indonesia generated approximately 69.9 million tons of waste in 2023, dominated by food residues (41.60%) and plastics (18.71%) [5]. Globally, MSW is increasingly recognized as a substantial waste-to-energy resource [6, 7], and RDF recovered from its combustible fraction has been characterized as a viable solid fuel for thermochemical conversion [8, 9]. Fuel moisture content (MC) is also an important parameter in solid-fuel combustion, as increasing moisture can alter ignition, temperature development, and combustion stability [10].
Moisture in RDF affects fluidized-bed combustion through several coupled mechanisms. Before devolatilization and char oxidation can proceed, part of the available energy is consumed in heating and vaporizing the contained water. This additional thermal demand can delay ignition, lengthen burnout, reduce locally available heat, and influence gas–solid heat transfer and fluidization behavior [11-14]. These effects are particularly important when a coal–RDF blend is prepared on an as-received basis because increasing the RDF MC also reduces the dry combustible RDF mass at a fixed wet fuel charge.
The Indonesian Standard SNI 8966:2021 specifies an RDF MC range of 15-25% [15]. Although previous coal–RDF studies have examined co-firing ratio, bed hydrodynamics, emissions, and plant-scale performance [16], fewer laboratory investigations have isolated the effects of selected RDF MC conditions on fuel energy density, burnout behavior, combustible-gas release, and derived thermal-performance indicators in a bubbling fluidized bed (BFB). A focused comparison is therefore needed for RDF produced from organic-rich municipal waste, which commonly exhibits MC above the recommended range.
To address this gap, the present study experimentally quantifies how RDF MC governs the combustion performance of coal–RDF co-firing in a laboratory-scale BFB incinerator. Two target RDF MC conditions, 25% and an elevated 40%, are compared under identical operating conditions. The novelty of this work lies in linking proximate, thermogravimetric, gross calorific value (GCV) and flue-gas data to the net plant heat rate (NPHR) and combustion efficiency within a single co-firing experiment, thereby establishing a direct, quantitative relationship between RDF MC and the thermal and energy performance of the incinerator. The findings provide practical guidance on the maximum admissible RDF MC for efficient co-firing operation.
2.1 Materials and sample preparation
Two solid fuels were used in this study: RDF produced from MSW and coal, the latter serving as the primary fuel. The RDF feedstock was obtained from the TPST Kertalangu integrated solid-waste processing facility, which was selected because it is representative of the urban MSW generated in a tourism-driven region, where the waste stream is highly heterogeneous and rich in organic and plastic fractions. At the facility, the combustible fraction of the MSW – mainly paper, wood and plastic residues – was separated from non-combustible materials such as metals, glass and inert debris.
The RDF preparation comprised several mechanical stages, illustrated in Figure 1. The raw MSW (Figure 1(a)) was first manually pre-sorted to remove bulky and clearly non-combustible items. The waste was then size reduced in a mechanical shredder (Figure 1(b)) to obtain smaller, more uniform particles and subsequently screened (Figure 1(c)) to remove oversized and inert fractions and improve fuel homogeneity. The resulting RDF (Figure 1(d)) consisted predominantly of combustible plastic, paper and wood residues.
The RDF was prepared at two target MC, 25% and 40%, to compare their influence on combustion performance. As shown in Figure 2, sample preparation was conducted using a laboratory oven and a digital balance to determine and adjust the RDF MC gravimetrically. Representative samples were initially weighed using the digital balance and subsequently dried in the oven at 105 ± 5 ℃ until a constant mass was achieved. The MC was calculated using Eq. (1), and the samples were then adjusted to the specified target moisture conditions.
$M C=\frac{m_i-m_d}{m_i} \times 100 \%$ (1)
where, MC is the moisture content of the RDF (%), miis the initial (as-received) mass of the sample (g), and md is the oven-dried mass (g). The wet mass required to reset each sample to its target MC was then obtained from Eq. (2):
$m_t=\frac{m_d}{1-M C_t}$ (2)
where, mt is the target mass of RDF at the desired moisture content (g), and MCt is the target moisture content expressed as a fraction (0.25 or 0.40). Immediately before combustion, the prepared RDF was blended with coal at 10 wt.% RDF and 90 wt.% coal on an as-received (wet) basis, giving a total wet fuel charge of 100 g. Consequently, the two charges did not contain identical dry RDF masses.
Quartz sand was used as the inert bed material, with the same characteristics as in the authors’ previous work on a dual reactor fluidized bed [17]. The sand consisted of 99.4%–99.9% SiO₂ and had a particle density of 2.18 g/cm³, a specific heat of 0.20 cal/g·℃ and a particle size of 0.4–0.5 mm. Its high melting point of about 1800 ℃ makes it well suited to fluidized bed applications. The preparation of the bed material is shown in Figure 3. The proximate composition and calorific value of the prepared fuels are reported in Sections 3.1 and 3.2, respectively.
Figure 2. Moisture content (MC) determination of the refuse-derived fuel (RDF) samples by the gravimetric oven-drying method, (a) drying of the samples in a laboratory oven and (b) measurement of the sample mass with a digital balance
Figure 3. Preparation of the quartz sand bed material (adapted from Winaya et al. [17]), (a) raw silica sand, (b) sieving to obtain a uniform particle size, and (c) weighing prior to loading into the reactor
2.2 Proximate and thermogravimetric analysis
Proximate analysis of the RDF samples was performed using a LECO TGA 701 thermogravimetric analyzer, as shown in Figure 4, following ASTM D7582 [18] and the standard procedure applied by the testing laboratory. The nominal MC of 25% and 40% represents the target conditions established during sample preparation, whereas the corresponding measured MC obtained from the analysis was 23.65% and 43.16%, respectively. The programmed analysis comprised three stages. For moisture determination, the furnace temperature was increased from 25 to 107 ℃ at 6 ℃/min under nitrogen and held for 15 min or until constant mass, using the instrument's high-flow setting (10.0 L/min). For volatile-matter determination, the temperature increased from 107 to 950 ℃ at 43 ℃/min under nitrogen and was held for 7 min at the same high-flow setting. For ash determination, the programmed setpoint was changed from 950 to 750 ℃ at 3 ℃/min under oxygen with a stated purity of 98%, using the low-flow setting (3.5 L/min), and the analysis continued until constant mass without a fixed holding period. Moisture, volatile matter, and ash were determined from successive mass changes, whereas fixed carbon was calculated by difference. All proximate-analysis values were reported on an as-received (wet) basis. Each moisture condition was analyzed once (n = 1). Therefore, the reported values represent individual measurements and are presented without standard deviations or inferential statistical analysis.
2.3 Reactor configuration and experimental procedure
The experiments were conducted in a laboratory-scale BFB incinerator fabricated from stainless steel SS304 and operated through direct co-firing of 10 wt.% RDF and 90 wt.% coal. The cylindrical reactor had a total height of 700 mm and a diameter of 55 mm. Quartz sand containing 99.4%–99.9% SiO₂, with a particle-size range of 0.4–0.5 mm, was used as the inert bed material. The initial static bed height was maintained at 150 mm. Fluidizing air was supplied through an 8.5-mm-diameter bottom inlet pipe at an inlet velocity of approximately 9 m/s. Before fuel feeding, the bed was heated to an operating temperature of approximately 800 ℃. The axial temperature distribution was measured using three thermocouples positioned at T1 in the lower bed, T2 in the splash zone, and T3 in the freeboard. The dimensional configuration and temperature-measurement locations are presented in Figure 5.
Figure 5. Schematic of the laboratory-scale bubbling fluidized bed (BFB) incinerator
The main components of the experimental system are shown in Figure 5. The initial bed height was set at 150 mm in the lower section of the cylindrical reactor. Three axial side ports were used for the T1, T2, and T3 temperature measurements. The thermocouples (1) were connected to a control panel (2), which was used to monitor the combustion chamber temperature. Fluidizing air (3) entered through a line located beneath the reactor to drive the fluidization process. The flue gas left the reactor through a flue-gas nozzle (4), passed through a filter (5), and was then cooled by a cooler (6) before entering the gas analyzer (7), where it was analyzed. Fuel was introduced into the reactor for combustion through a fuel feeder (8). Before fuel feeding, the reactor was preheated by a heater (9) until the operating temperature of 800 ℃ was reached. A distributor plate (10) supported the silica sand bed and ensured uniform air distribution and fluidization. The fluidizing air was supplied by an air-supply blower (11) through the bottom inlet, allowing the bed to reach the bubbling fluidization regime during combustion.
One combustion run was conducted for each target moisture condition (n = 1). The combustion gases were analyzed with a Gasboard-3100P gas analyzer, which recorded the lower heating value (LHV) together with the CO, CO₂, and CH₄ concentrations. At the selected reference temperature of 0 ℃ and with the result expressed in MJ/m3, the LHV was calculated using the factory coefficients given in the instrument manual [19]: LHVgas = 12.620 yCO + 35.818 yCH4 + 91.180 yCnHm + 10.777 yH2, where each y is the measured gas volume fraction expressed as a decimal. The principal operating conditions are summarized in Table 1.
Table 1. Operating conditions of the bubbling fluidized bed (BFB) incinerator
|
Parameter |
Value |
|
Reactor material |
Stainless steel SS304 |
|
Reactor height |
700 mm |
|
Diameter |
55 mm |
|
Initial static bed height |
150 mm |
|
Bottom air-inlet diameter |
8.5 mm |
|
Bed material |
Quartz sand (99.4–99.9% SiO₂) |
|
Bed-material particle size |
0.4–0.5 mm |
|
Air velocity in inlet pipe |
9 m/s |
|
Bed operating temperature |
800 ℃ |
|
Temperature measurement positions |
T1 (lower bed), T2 (splash zone), T3 (freeboard) |
|
Fuel blend, coal: RDF |
90: 10, as-received mass basis |
|
Total fuel charge |
100 g |
|
RDF target moisture content (MC) |
25% and 40% |
2.4 Net plant heat rate calculation
The NPHR was calculated from the ratio of the fuel-energy input rate to the useful thermal power released during combustion. Following the definition widely adopted for coal-fired thermal systems [20, 21], it is expressed as:
$N P H R=\frac{m_{\dot{fuel}} \cdot L H V_{\text {in}}}{P_{\text {th}}}$ (3)
where, $\dot{m}_{\text {fuel}}$ is the fuel consumption rate $\left(\mathrm{kg} \cdot \mathrm{h}^{-1}\right), L H V_{\text {in}}$ is the lower heating value of the incoming fuel $\left(\mathrm{kcal} \cdot \mathrm{kg}^{-1}\right)$, and $P_{\mathrm{th}}$ is the useful thermal power output (kWth) derived from the net thermal energy released during combustion, defined as the difference between the chemical energy supplied by the fuel and the residual chemical energy carried by the outlet gas.
$P_{\text {th}}=\frac{Q_{\text {net}}}{t_{\text {comb}}}$ (4)
$Q_{\text {net}}=\dot{m}_{\text {fuel}} \cdot L H V_{\text {fuel}}-V_{\text {gas}} \cdot L H V_{\text {gas}}$ (5)
where, $V_{\text {gas}}$ is the total gas volume discharged during combustion $\left(\mathrm{m}^3\right)$, $L H V_{\text {gas}}$ is the lower heating value of the outlet gas $\left(\mathrm{kcal} . \mathrm{m}^{-3}\right)$, and $t_{\text {comb}}$ is the combustion duration. Appropriate unit conversion was applied to express $P_{\text {th}}$ in $\mathrm{kW}_{\text {th}}$. Accordingly, the NPHR reported in this study represents a thermal-equivalent heat rate based on combustion and outlet-gas parameters rather than a conventional plant-level NPHR based on measured net electrical power.
2.5 Combustion efficiency
Combustion efficiency is defined, following the energy-balance approach used for fluidized bed combustors [20], as the ratio of the heat energy effectively utilized during combustion to the total heat energy available in the fuel supplied to the combustion chamber:
$\eta=\frac{Q_{\text {in}}-Q_{\text {out}}}{Q_{\text {in}}} \times 100 \%$ (6)
where, Qin is the total heat energy supplied (MJ), and Qout is the heat energy lost (MJ). The result, expressed as a percentage, reflects the proportion of fuel energy converted into useful energy.
3.1 Proximate analysis
A proximate analysis was performed on an as-received (AR) basis to characterize the prepared RDF in terms of its moisture, volatile matter, fixed carbon and ash contents; the results are summarized in Table 2. The RDF fractions with target MC of 25% and 40% were analyzed using the same programmed temperature sequence and gas-flow settings described above. One run was performed for each condition (n = 1). The exported mass data were converted to percentage weight loss and plotted against test time and heating temperature.
Table 2. Proximate composition of refuse-derived fuel (RDF) samples at the two target moisture conditions
|
Parameter (as Received Basis) |
Target MC 25% |
Target MC 40% |
|
Measured moisture content (%) |
23.65 |
43.16 |
|
Volatile matter (%) |
14.73 |
10.57 |
|
Fixed carbon (%) |
7.76 |
5.54 |
|
Ash (%) |
53.86 |
40.73 |
Increasing the measured RDF MC from 23.65% to 43.16% reduced the as-received volatile-matter and fixed-carbon fractions because water occupied a larger share of the sample mass. The lower as-received ash fraction at the higher-moisture condition reflects dilution of the dry solid components rather than ash decomposition. The thermogravimetric analysis (TGA) curves in Figure 6 corroborates this interpretation.
As shown in Figure 6, the target MC 40% blend exhibits a larger initial weight loss of about 30%, compared with the target moisture 25% blend; this low-temperature stage is dominated by moisture evaporation and confirms that the higher-moisture fuel must shed a greater quantity of water before the main thermal decomposition can begin. During the higher-temperature stage, devolatilization and char combustion produce further mass loss, with the target MC 40% blend reaching a final weight loss of about 58% against about 52% for the target moisture 25% blend. The delayed rise of the weight-loss curve for the 40% blend indicates that moisture evaporation postpones the principal combustion stage and reduces the effective thermal response of the fuel, in agreement with the proximate results.
3.2 Calorific value
The solid-fuel GCV was determined using a Parr 1341 oxygen bomb calorimeter in accordance with ASTM D5865 [22]. ASTM D5865 reports GCV; therefore, the bomb-calorimeter results are identified as GCV rather than LHV. No conversion from GCV to LHV was applied to the solid-fuel values in Table 3. All measurements were performed at the Materials Analysis Laboratory, Faculty of Engineering, Udayana University.
Table 3. Bomb calorimeter gross calorific value (GCV) results
|
Parameter |
Target MC 25% |
Target MC 40% |
|
Sample mass (g) |
1.25 |
1.40 |
|
Initial temperature T1 (℃) |
23.55 |
26.05 |
|
Final temperature T2 (℃) |
24.64 |
27.02 |
|
Mean gross calorific value (cal/g) |
1,424.67 |
1,030.75 |
|
Gross calorific value (MJ/kg) |
5.96 |
4.32 |
The GCV decreased by 27.6%, from 5.96 to 4.32 MJ/kg, between the target MC conditions of 25% and 40%. The corresponding measured RDF MC were 23.65% and 43.16%. This comparison reflects both the increased water fraction and the reduced dry RDF mass associated with wet-basis blending. The trend is consistent with earlier observations that elevated moisture lowers both the calorific value and the combustion efficiency of solid fuels, because a portion of the fuel energy is expended in vaporizing the contained water before oxidation can proceed [11].
3.3 Flue-gas composition
The flue-gas composition was recorded during combustion to assess combustion completeness. The reported flue-gas LHV values were taken directly from the analyzer’s online composition-based calculation; the measured values are listed in Table 4.
The higher-moisture blend required substantially longer to burn out (651 s compared with 427 s). The CO, CO₂, and CH₄ concentrations all increased at 40% moisture; in particular, the CO and CH₄ levels rose from 0.069% and 0.0004% to 0.323% and 0.0106%, respectively. The simultaneous rise in CO and CH₄ is a clear indicator of incomplete combustion, driven by the lower bed temperature and the delayed ignition associated with the higher moisture loading. The elevated concentrations of these combustible species also account for the higher volumetric heating value measured in the flue gas of the 40% blend.
Table 4. Gas analyzer measurement results
|
Parameter |
Target MC 25% |
Target MC 40% |
|
Burnout time (s) |
427 |
651 |
|
CO (%) |
0.0690 |
0.3228 |
|
CO₂ (%) |
0.0697 |
0.4450 |
|
CH₄ (%) |
0.0004 |
0.0106 |
|
Calculated flue-gas LHV (MJ/m³) |
0.0268 |
0.0494 |
3.4 Effect of refuse-derived fuel moisture content on net plant heat rate
The NPHR increased from 926.1 kcal/kWhth at the target MC of 25% to 1180.6 kcal/kWhth at the target MC of 40%, as shown in Figure 7. Since a lower NPHR indicates more efficient energy conversion, the observed increase demonstrates a deterioration in thermal performance. At the higher MC, a greater proportion of the released energy was consumed in heating and evaporating the fuel-bound water rather than being converted into useful thermal output. A similar inverse relationship between heat rate and energy-conversion efficiency has been reported in coal-fired thermal systems, where an increase in fuel energy consumption or a reduction in useful energy output results in a higher NPHR [20, 21].
Figure 7. Net plant heat rate (NPHR) at target moisture content (MC) 25% and 40%
3.5 Combustion efficiency
Applying the energy-balance approach described in Eq. (6) to the data presented in Tables 3 and 4, the combustion efficiency decreased from 92.92% at the target MC of 25% to 72.89% at the target MC of 40%, as shown in Figure 8. This pronounced decline confirms that the increased latent-heat demand at higher moisture, together with the associated incomplete combustion, substantially lowers the fraction of fuel energy that is usefully recovered. The result is consistent with the heat-release behavior reported for BFB combustors, where a higher moisture (and the correspondingly lower bed temperature) reduces the heat transferred to the bed relative to the fuel input [14].
Figure 8. Combustion efficiency at target moisture content (MC) 25% and 40%
3.6 Overall performance assessment
Table 5 summarizes the principal results for the two selected target moisture conditions. The target MC 40% case showed lower GCV and reported combustion efficiency and higher NPHR and burnout time. These comparisons should be interpreted together with the wet-basis blending limitation: the higher-moisture charge contained both more water and less dry RDF. The results therefore describe the combined response of the two as-received fuel charges rather than an isolated moisture effect at constant dry-fuel input.
Table 5. Summary of combustion performance indicators
|
Indicator |
Target MC 25% |
Target MC 40% |
Change |
|
Gross calorific value (MJ/kg) |
5.96 |
4.32 |
−27.6% |
|
Net plant heat rate (NPHR) (kcal/kWhth) |
926.1 |
1180.6 |
+27.5% |
|
Combustion efficiency (%) |
92.92 |
72.89 |
−21.6% |
|
Burnout time (s) |
427 |
651 |
+52.5% |
3.7 Axial temperature distribution
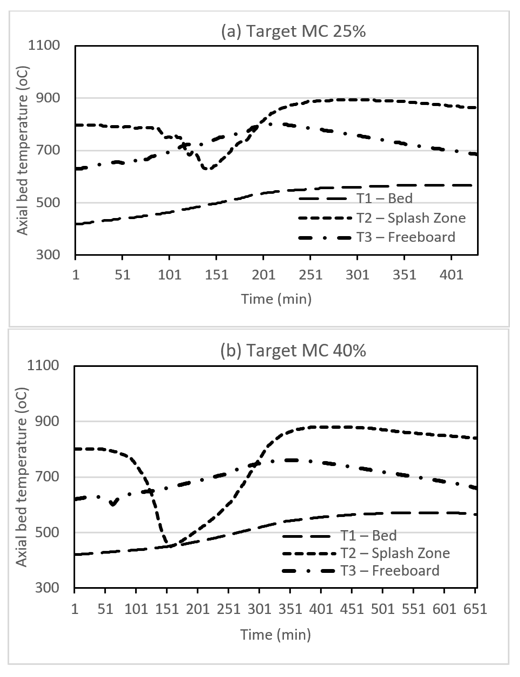
Figure 9 presents the axial temperature histories at T1, T2, and T3 under the two target RDF moisture conditions. In the target MC 25%, splash zone area T2 decreased from approximately 796.7 ℃ to 626.7 ℃, corresponding to a temperature reduction of 170.0 ℃, before recovering to a maximum of approximately 893.3 ℃. For target MC 40%, T2 declined more substantially from approximately 850.0 ℃ to 480.6 ℃, representing a reduction of 369.4 ℃, and subsequently recovered to approximately 800 ℃ by the end of the combustion period. The deeper and longer temperature depression at the higher moisture condition indicates greater local heat consumption for heating and evaporating the water contained in the RDF during the initial fuel–bed interaction. The delayed responses observed at T1 and T3 further indicate axial redistribution of heat as devolatilization and combustion progressed from the splash zone toward the bed and freeboard regions.
Figure 9. Axial temperature-time profiles at T1 (lower bed), T2 (splash zone), and T3 (freeboard) for (a) target moisture content (MC) 25% and (b) target MC 40% conditions
This study quantified the influence of RDF MC on the combustion performance of coal–RDF co-firing in a laboratory-scale BFB incinerator. Increasing the RDF target MC from 25% to 40% lowered the peak bed temperature and reduced the fuel GCV by 27.6%, increased the NPHR by 27.5% (from 926.1 to 1180.6 kcal/kWhth) and decreased the combustion efficiency from 92.92% to 72.89%. The higher moisture level also promoted incomplete combustion, as evidenced by the elevated CO and CH₄ emissions and the 52.5% longer burnout time.
Taken together, these results identify MC as a critical parameter governing the thermal performance, reaction stability and energy efficiency of fluidized bed co-firing systems. The best performance was obtained at target moisture 25%, consistent with the upper limit recommended by SNI 8966:2021; maintaining the RDF moisture at or below this value is therefore essential for efficient operation. Future work should extend the investigation to a wider range of moisture levels and co-firing ratios and incorporate detailed emission and ash-behavior analyses to support the scale-up and design of full-scale co-firing systems.
The authors gratefully acknowledge the Institute for Research and Community Service (Lembaga Penelitian dan Pengabdian Masyarakat, LPPM), Udayana University, for funding this work through the 2026 Doctoral Postgraduate Research Grant Scheme Contract No. B/325.50/UN14.4.A/PT.01.03/2026, and in particular the New and Renewable Conversion of Energy (NRCE) Research Group, for their support of this research.
I Made Agus Putrawan: Conceptualization, methodology, investigation, data curation, formal analysis, visualization, and writing-original draft. Samuel Alfred Manumpil: Investigation, data curation and validation. I Nyoman Suprapta Winaya: Conceptualization, methodology, supervision, project administration, funding acquisition, and Writing-review and editing. Made Suarda: Validation, supervision, and writing-review and editing. I Ketut Gede Wirawan: Methodology, validation, and resources. I Putu Angga Yuda Pratama: Investigation, data curation, and visualization. I Gusti Ngurah Putu Tenaya: Formal analysis, validation, and writing-review and editing.
|
GCV |
gross calorific value, cal·g⁻¹ or MJ·kg⁻¹ |
|
LHV |
lower heating value of flue gas, MJ·m⁻³ |
|
MC |
moisture content, % |
|
MCt |
target moisture content, fraction |
|
ṁ |
fuel mass, kg |
|
md |
oven-dried mass of sample, g |
|
mi |
initial (as-received) mass of sample, g |
|
mt |
target mass at desired moisture content, g |
|
NPHR |
net plant heat rate, kcal·kWhth⁻¹ |
|
Q |
heat energy, MJ |
|
Greek symbols |
|
|
η |
combustion efficiency, % |
|
Subscripts |
|
|
in |
supplied / inlet |
|
out |
lost / outlet |
|
Abbreviations |
|
|
BFB |
bubbling fluidized bed |
|
FBC |
fluidized bed combustion |
|
MSW |
municipal solid waste |
|
RDF |
refuse-derived fuel |
[1] Prasodjo, E., Nurzaman, H., Walujanto, D.R., et al. (2016). Indonesia energy outlook 2016. Secretariat General National Energy Council, Jakarta.
[2] Setyono, A.E., Kiono, B.F.T. (2021). Dari energi fosil menuju energi terbarukan: Potret kondisi minyak dan gas bumi Indonesia tahun 2020 – 2050. Jurnal Energi Baru dan Terbarukan, 2(3): 154-162. https://doi.org/10.14710/jebt.2021.11157
[3] Lorenzini, E., Cardinale, T. (2022). Economy, pollution, energy, environment, climate: From the past to the future. International Journal of Heat and Technology, 40(3): 661-664. https://doi.org/10.18280/ijht.400301
[4] Suganal, S., Hudaya, G.K. (2019). Bahan bakar co-firing dari batubara dan biomassa tertorefaksi dalam bentuk briket (Skala laboratorium). Jurnal Teknologi Mineral dan Batubara, 15(1): 31-48. https://doi.org/10.30556/jtmb.Vol15.No1.2019.971
[5] Ministry of Environment and Forestry. (2023). National Waste Management Information System (SIPSN): Data on waste management and green open space. Jakarta, Indonesia. https://sipsn.menlhk.go.id/.
[6] Liu, J., Iwakin, O., Romero, C.E., et al. (2025). Rapid characterization of MSW and RDF feedstocks for waste-to-energy process using LIBS and ML techniques. Waste Management, 206: 115079. https://doi.org/10.1016/j.wasman.2025.115079
[7] Han, D., Li, N., Xia, S., et al. (2026). From waste to efficient energy: Multidimensional additive-mediated regulation of aged garbage-based refuse derived fuel (RDF) performance. Fuel, 417: 138628. https://doi.org/10.1016/j.fuel.2026.138628
[8] Maj, I., Kalisz, S., Wejkowski, R., Pronobis, M., Gołombek, K. (2022). High-temperature corrosion in a multifuel circulating fluidized bed (CFB) boiler co-firing refuse derived fuel (RDF) and hard coal. Fuel, 324: 124749. https://doi.org/10.1016/j.fuel.2022.124749
[9] Jena, S., Singh, V., Nemalipuri, P., Das, H.C., Pradhan, M.K., Vitankar, V. (2026). Computational study on co-combustion of coal and blast furnace gas in an industrial fluidized bed boiler. International Journal of Heat and Technology, 44(2): 717-732. https://doi.org/10.18280/ijht.440224
[10] Lai, Y., Liu, X., Davies, M., et al. (2024). Characterisation of wood combustion and emission under varying moisture contents using multiple imaging techniques. Fuel, 373: 132397. https://doi.org/10.1016/j.fuel.2024.132397
[11] Fadhili, M.A., Ansosry, A. (2019). Analisis pengaruh perubahan nilai total moisture, ash content dan total sulphur terhadap nilai kalori batubara Bb-50 di Tambang Banko Barat Pt. Bukit Asam, Tbk. Tanjung Enim, Sumatra Selatan. Bina Tambang, 4(3): 54-64. https://garuda.kemdiktisaintek.go.id/documents/detail/1551804.
[12] Suleimenova, B., Aimbetov, B., Zhakupov, D., Shah, D., Sarbassov, Y. (2022). Co-firing of refuse-derived fuel with Ekibastuz coal in a bubbling fluidized bed reactor: Analysis of emissions and ash characteristics. Energies, 15(16): 5785. https://doi.org/10.3390/en15165785
[13] Liang, D. (2024). Numerical study on inter-particle effects for multiple reacting biomass and coal particles based on Micro-CT morphology. Heliyon, 10(22): e40419. https://doi.org/10.1016/j.heliyon.2024.e40419
[14] Müller, D., Plankenbühler, T., Karl, J. (2020). A methodology for measuring the heat release efficiency in bubbling fluidised bed combustors. Energies, 13(10): 2420. https://doi.org/10.3390/en13102420
[15] National Standardization Agency of Indonesia (BSN). (2021). SNI 8966:2021: Bahan bakar jumputan padat untuk pembangkit listrik. BSN, Jakarta, Indonesia. https://pesta.bsn.go.id/produk/detail/13199-sni89662021.
[16] Fadli, M., Kamal, D.M., Adhi, P.M. (2019). SWOT analysis for direct co-firing of coal with waste pellets in CFBC type boilers. Journal of the Electric Power Generation Study Program, 272-279.
[17] Winaya, I.N.S., Wirawan, I.K.G., Darma, I.W.A., Lokantara, I.P., Hartati, R.S. (2018). An increase in bed temperature on gasification of dual reactor fluidized bed. E3S Web of Conferences, 67: 02059. https://doi.org/10.1051/e3sconf/20186702059
[18] ASTM International. (2024). ASTM D7582-24: Standard test methods for proximate analysis of coal and coke by macro thermogravimetric analysis. ASTM International, West Conshohocken, PA, USA. https://doi.org/10.1520/D7582-24
[19] Cubic Instruments (Wuhan) Ltd. (n.d.). Gasboard-3100P Portable Infrared Syngas Analyzer: User Manual. https://envilife.co.id/user-manual-gasboard-3100p-portable-infrared-syngas-analyzer/, accessed on Jul. 15, 2026.
[20] Utama, T.Y., Ruhyat, N. (2024). Analysis of boiler efficiency and NPHR with the use of sootblower in a 315 MW coal-fired power plant. SINTEK JURNAL: Jurnal Ilmiah Teknik Mesin, 18(2): 80-89. https://doi.org/10.24853/sintek.18.2.80-89
[21] Djaeni, M., Windarta, J., Muqorrobin, R. (2025). The analysis of changes in calorific value of coal in the coal flow coal feeder and net plant heat rate (NPHR). ASTONJADRO, 14(1): 339-348. https://doi.org/10.32832/astonjadro.v14i1.18136
[22] ASTM International. (2013). ASTM D5865: Standard test method for gross calorific value of coal and coke. ASTM International, West Conshohocken, PA, USA. https://doi.org/10.1520/D5865_D5865M-19