Zainab G. Sadeq* | Sarah J. Jalil | Yasser Alzawy
© 2026 The authors. This article is published by IIETA and is licensed under the CC BY 4.0 license (http://creativecommons.org/licenses/by/4.0/).
OPEN ACCESS
This study investigates the variation in pollen shape and size among the eight taxa belonging to Brassicaceae using a scanning electron microscope (SEM). Five pollen characters were measured: polar axis length, equatorial axis length, P/E ratio, lumen diameter, and muri width. Data analysis included descriptive statistics, principal component analysis (PCA), and hierarchical cluster analysis. Significant differences were found within the examined specimens; Sinapis arvensis had the largest pollen grains, while Lepidium draba had the smallest. The P/E ratio varied with pollen shape, with higher values in Sisymbrium irio and Brassica nigra. The first two principal components from the PCA explained 94.28% of the total variation; PC1 was mainly associated with pollen size and exine ornamentation, while PC2 was strongly related to pollen shape. Cluster analysis supported the PCA result and separated Sinapis arvensis from the other taxa. Hence, SEM-based quantitative pollen analysis can serve as valuable supporting evidence for the taxonomic evaluation of Brassicaceae taxa when integrated with other morphological characters.
pollen grains, Scanning Electron Microscope, Brassicaceae, principal component analysis
The Brassicaceae (Cruciferae) family, known as the mustard family, is considered one of the most significant plant families globally. With numerous economically valuable species, such as Eruca sativa Mill., Raphanus raphanistrum subsp. sativus (L.) Schmalh and Brassica nigra (L.) W.D.J. Koch, while Rapistrum rugosum (L.) All., Sinapis arvensis L, Sisymbrium irio L., Lepidium draba L., and Sinapis alba L. are treated as wild plants or plants growing in disturbed habitats, with more than 338 genera and 3,709 species around the world. In Iraq, more than 75 genera and 18 species are mentioned in the flora. This family has the tendency to withstand ecological stress, making it resilient under global warming. A great importance for agriculture and food security; by doing research on this family, some species are used in pharmaceutical and industrial production [1, 2].
The species within this family have a high degree of similarity in vegetative and floral characters, especially in the cruciform yellow flowers and fruits of the siliqua or silicula type. Hence, external morphology can’t be relied on alone and may not be sufficient for accurate taxonomic delimitation, particularly among closely related genera such as Eruca, Raphanus, Rapistrum, Sinapis, Brassica nigra [3].
Pollen grain morphology has been used as a supportive and helpful character in solving taxonomical problems, especially by Scanning Electron Microscope (SEM), because it reveals the external ornamentation, for example, lumen and muri, which can’t be observed by a light microscope. Some studies mentioned the importance of pollen morphology to solve taxonomical issues at the level of family, genus, and species [4].
The selected species in this study represent a group of closely related and taxonomically important genera within local or regional flora. They all belong to the family Brassicaceae, but differ in genus, fruit type, economic or wild status, and degree of taxonomic affinity. Therefore, they provide a suitable model for evaluating the taxonomic worth of pollen characters in distinguishing species and genera within this family [5].
Although several regional studies have examined Brassicaceae pollen morphology, for example, Mathree and Aliwy [6] studied pollen grains and fruits of eleven Brassicaceae species in Iraq, including Eruca sativa, Sinapis arvensis, and Brassica nigra, but with only a light microscope. As well, Erden and Menemen [5] examined pollen grain morphology in several Brassicaceae taxa, including Sisymbrium irio and Lepidium draba. The family is generally considered stenopalynous, with pollen grains typically described as tricolpate and reticulate. As a result, the taxonomic value of pollen characters relies on detailed quantitative and micromorphological features, especially those observed using SEM. In the local flora, closely related or morphologically similar taxa include Eruca sativa Mill., Raphanus raphanistrum subsp. sativus (L.) Schmalh, Rapistrum rugosum (L.) All., Sinapis arvensis L., Sisymbrium irio L., Lepidium draba L., Brassica nigra (L.) W.D.J. Koch have not been thoroughly compared as a single palynological group.
1.1 Aim of the study
Therefore, the research gap is not the absence of palynological studies, but the lack of an integrated comparative SEM-based study on the selected taxa as one group, supported by quantitative morphometric measurements and exploratory multivariate analyses. This study aims to evaluate the usefulness of pollen micromorphological characters for distinguishing the examined Brassicaceae taxa.
2.1 Plant specimens
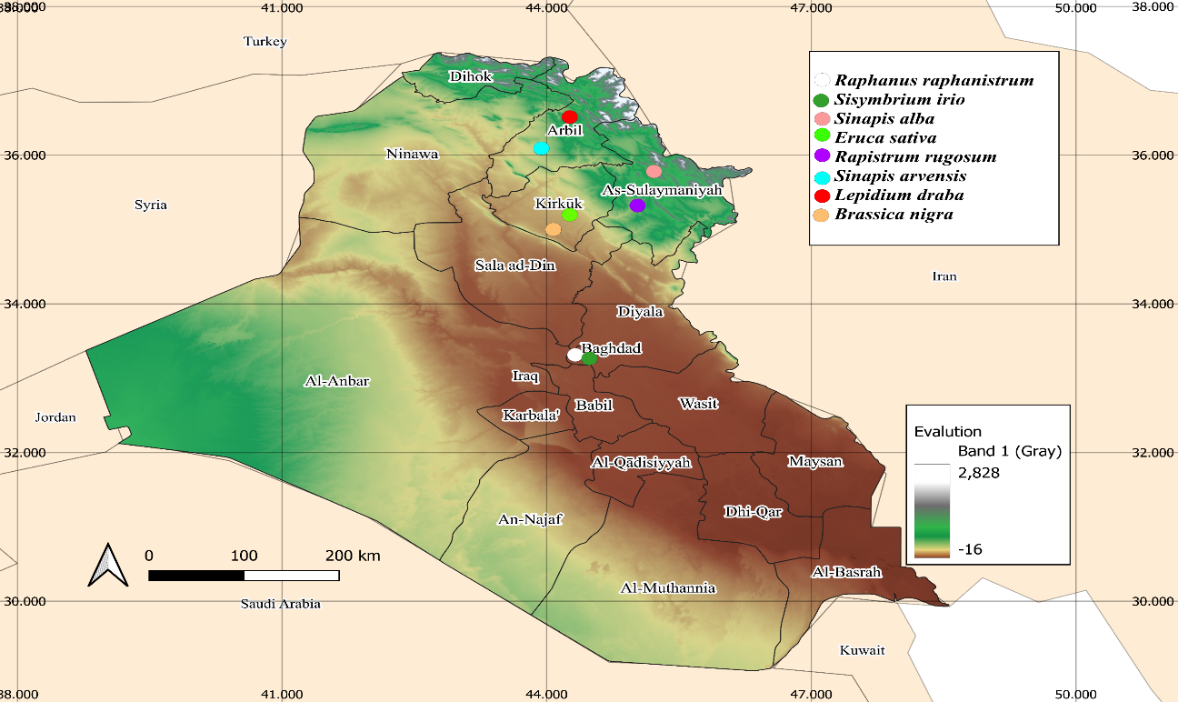
It is representing eight taxa of Brassicaceae were collected from different locations in Iraq (Table 1 and Figure 1), selected by Sarah J. Jalil and Sadeq, Z.G., and verified by Sadeq, Z.G. (Department of Botany and Environment, Natural History Research Centre and Museum). Plant specimens were collected from the study localities between mid-March and late April. As voucher specimens were not deposited in a recognized herbarium, voucher numbers are unavailable, which is considered a limitation for this study.
The study's taxa included Eruca sativa, Raphanus raphanistrum subsp. sativus (L.) Schmalh, Sinapis alba, Rapistrum rugosum, Sinapis arvensis, Sisymbrium irio, Lepidium draba and Brassica nigra. The specimens were identified according to Iraqi flora, available taxonomic keys, and relevant floristic references. For each taxon, pollen was obtained from a single morphologically identified plant specimen. Therefore, the measurements reflect within-specimen variation and should not be interpreted as representing the full range of species-level variation.
2.2 Pollen preparation for Scanning Electron Microscope
Pollen from the selected flowers was mounted together on an SEM stub to provide an adequate representation of the pollen morphology of the examined specimen. Pollen grains were examined using SEM at an accelerating voltage of 20.0 kV using a secondary electron (SE) detector. SEM micrographs were acquired at different magnifications according to the morphological character examined, ranging from 200× to 5,000×.
2.3 Pollen measurements
Twelve pollen grains for each taxon were measured when feasible, including polar axis length, equatorial diameter, P/E ratio, lumen diameter, and muri width. All measurements were in micrometres (µm). Fine exine characters, including lumen diameter and muri width, were measured from high-magnification SEM micrographs (5,000×). Image calibration was performed using the scale bars incorporated into the original SEM micrographs. Scale bars are provided on all SEM images.
For each pollen grain, 5 well-defined lumina and 5 adjacent muri were measured, and the mean value was calculated for that grain. The measurements were taken from the central region of the visible exine surface, avoiding the apertural regions, grain margins, damaged areas, and obliquely orientated portions of the exine.
The multiple pollen grain measurements were used to characterize the morphometric variability observed within each examined plant specimen.
2.4 Terminology
For pollen terminology, standard palynological references have been used for size, shape, aperture type, and exine ornamentation [7-9].
2.5 Statistical analysis
Each quantitative pollen character was calculated using descriptive statistics (mean and standard deviation (SD), minimum, maximum). Both principal component analysis (PCA) and cluster analysis were performed to evaluate the relationships within the examined specimens based upon quantitative pollen characters. PAST software version 4.03 was used for all statistical analyses [10].
The input matrix for PCA and hierarchical cluster analysis consisted of eight taxa (rows) and five quantitative pollen characters (columns): polar axis length (P), equatorial axis length (E), P/E ratio, lumen diameter, and muri width.
Table 1. List of localities of the studied Brassicaceae taxa
|
No. |
Taxon |
Collection Locality |
Coordinates |
Collector |
|
1 |
Raphanus raphanistrum subsp. sativus (L.) Schmalh |
University of Baghdad Bab Al-Muadham campus in Al-Rusafa, Baghdad |
33.35478° N and 44.39286° E (33° 21′ 17″ N, 44° 23′ 34″ E) |
Sarah J. Jalil |
|
2 |
Sisymbrium irio L. |
University of Baghdad Bab Al-Muadham campus in Al-Rusafa, Baghdad |
33.35478° N, 44.39286° E |
Sarah J. Jalil |
|
3 |
Sinapis alba L. |
Kirkuk, Iraq |
35.3028° N, 44.3286° E |
Sadeq, Z.G. |
|
4 |
Eruca sativa Mill. |
Daquq district of the Kirkuk Governorate, Iraq |
35.216667° N, longitude 44.400000° E |
Sadeq, Z.G. |
|
5 |
Rapistrum rugosum (L.) All. |
Qaradagh District, Sulaymaniyah Governorate, Iraq |
35.331111° N, 45.290278° E |
Sadeq, Z.G. |
|
6 |
Sinapis arvensis L. |
Bekhal, Kurdistan Region, northern Iraq |
36.619° N, 44.497° E |
Sadeq, Z.G. |
|
7 |
Lepidium draba L. |
Shaqlawa, Kurdistan Region, northern Iraq |
36.40° N, 44.31° E |
Sadeq, Z.G. |
|
8 |
Brassica nigra (L.) W.D.J. Koch |
Kirkuk Governorate of Iraq, south of Kirkuk |
35.3028° N, 44.3286° E |
Sadeq, Z.G. |
Figure 1. Geographic distribution of the collection sites of the eight Brassicaceae taxa examined in this study across Iraq
3.1 Overview of pollen morphology
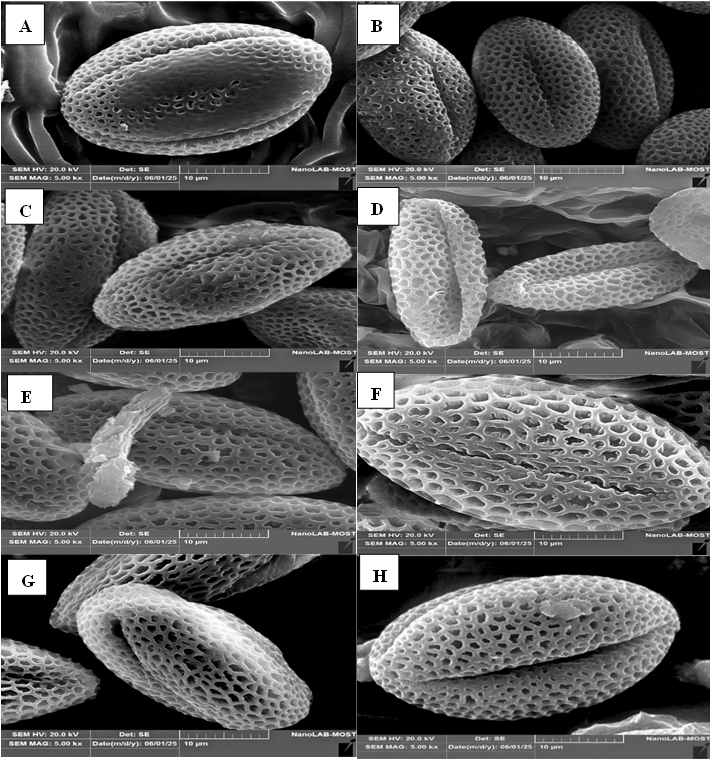
The morphological pattern of pollen grains is generally consistent within the examined taxa. The pollen grains of all taxa studied are monads, with radial symmetry, and are mainly isopolar. The aperture was tricolpate for all taxa and characterized by three elongated colpi. The general shape of the pollen grains ranged from 1.56 to 2.29, which gives them prolate and perprolate shapes, as determined by the P/E ratio [11, 12].
SEM showed that exine ornamentation was reticulate in the taxa studied (Figure 2). However, significant differences were identified in the size and arrangement of the lumina and in the thickness of the muri. These micromorphological variations facilitated the differentiation of certain taxa, especially among closely related genera. While the species shared common palynological features characteristic of Brassicaceae, variation in pollen size, shape, lumen diameter, and muri width offered additional characters with potential taxonomic significance.
3.2 Quantitative pollen characters
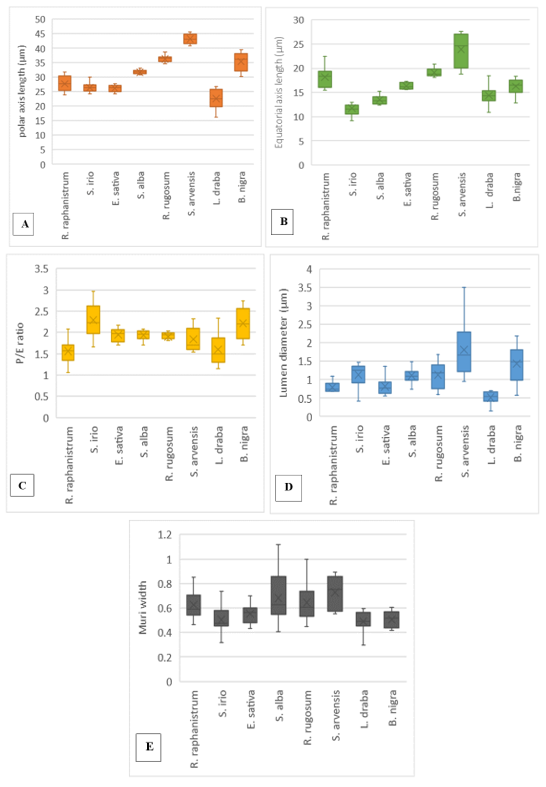
Quantitative pollen characteristics exhibited substantial variation within the examined specimens. S. arvensis demonstrated the greatest mean polar axis length (43.23 ± 1.69 µm), while L. draba had the lowest (22.61 ± 3.52 µm). S. arvensis also possessed the highest mean equatorial axis length (23.93 ± 3.38 µm), in contrast to S. irio, which had the lowest value (11.76 ± 1.76 µm). The highest P/E ratio was found in S. irio (2.29 ± 0.42), followed by B. nigra (2.21 ± 0.37). The lowest ratio was observed in R. raphanistrum (1.56 ± 0.28) and L. draba (1.60 ± 0.35), as shown in Table 2.
Exine ornamentation characteristics also varied substantially among the taxa. The largest mean lumen diameter was recorded in S. arvensis (1.81 ± 0.75 µm), followed by B. nigra (1.43 ± 0.52 µm), while L. draba had the smallest lumina (0.51 ± 0.17 µm). The greatest muri width was observed in S. arvensis (0.73 ± 0.13 µm), whereas L. draba had the lowest value (0.49 ± 0.08 µm). Notable within-taxon variation in lumen diameter was detected in several taxa, particularly S. arvensis, E. sativa, and B. nigra.
Table 2. Mean values and standard deviations (SD) of quantitative pollen morphological characters in the studied taxa
|
Taxon |
Character |
Mean ± SD |
Min |
Max |
CV (%) |
|
Raphanus raphanistrum subsp. sativus (L.) Schmalh. |
P length (µm) |
27.69 ± 2.65 |
23.86 |
31.83 |
9.56 |
|
E length (µm) |
18.15 ± 2.06 |
15.50 |
22.46 |
11.32 |
|
|
P/E ratio |
1.56 ± 0.28 |
1.05 |
2.07 |
17.73 |
|
|
Lumen diameter (µm) |
0.79 ± 0.13 |
0.67 |
1.09 |
17.00 |
|
|
Muri width (µm) |
0.62 ± 0.11 |
0.46 |
0.84 |
18.34 |
|
|
Sisymbrium irio L. |
P length (µm) |
26.33 ± 2.11 |
21.84 |
30.05 |
8.00 |
|
E length (µm) |
11.76 ± 1.76 |
9.18 |
16.06 |
14.94 |
|
|
P/E ratio |
2.29 ± 0.42 |
1.65 |
2.96 |
18.40 |
|
|
Lumen diameter (µm) |
1.13 ± 0.31 |
0.42 |
1.46 |
27.56 |
|
|
Muri width (µm) |
0.50 ± 0.11 |
0.31 |
0.73 |
22.73 |
|
|
Sinapis alba L. |
P length (µm) |
31.63 ± 1.08 |
28.92 |
33.17 |
3.41 |
|
E length (µm) |
16.33 ± 0.66 |
15.57 |
17.25 |
4.05 |
|
|
P/E ratio |
1.94 ± 0.11 |
1.70 |
2.08 |
5.75 |
|
|
Lumen diameter (µm) |
1.02 ± 0.37 |
0.73 |
1.48 |
17.91 |
|
|
Muri width (µm) |
0.68 ± 0.21 |
0.405 |
1.11 |
31.53 |
|
|
Eruca sativa Mill. |
P length (µm) |
26.15 ± 1.20 |
24.22 |
27.75 |
4.60 |
|
E length (µm) |
13.50 ± 0.92 |
12.38 |
15.28 |
6.81 |
|
|
P/E ratio |
1.95 ± 0.17 |
1.70 |
2.17 |
8.06 |
|
|
Lumen diameter (µm) |
0.81 ± 0.23 |
0.553 |
1.35 |
28.04 |
|
|
Muri width (µm) |
0.55 ± 0.079 |
0.43 |
0.69 |
14.34 |
|
|
Rapistrum rugosum (L.) All. |
P length (µm) |
36.25 ± 1.70 |
32.12 |
38.61 |
4.68 |
|
E length (µm) |
19.11 ± 0.87 |
18.07 |
20.85 |
4.54 |
|
|
P/E ratio |
1.90 ± 0.13 |
1.54 |
2.02 |
6.96 |
|
|
Lumen diameter (µm) |
1.12 ± 0.35 |
0.58 |
1.67 |
31.11 |
|
|
Muri width (µm) |
0.64 ± 0.15 |
0.44 |
0.99 |
23.64 |
|
|
Sinapis arvensis L. |
P length (µm) |
43.23 ± 1.69 |
40.84 |
45.69 |
3.92 |
|
E length (µm) |
23.93 ± 3.38 |
18.74 |
27.62 |
14.13 |
|
|
P/E ratio |
1.84 ± 0.28 |
1.54 |
2.31 |
15.35 |
|
|
Lumen diameter (µm) |
1.81 ± 0.75 |
0.95 |
3.51 |
41.70 |
|
|
Muri width (µm) |
0.73 ± 0.13 |
0.55 |
0.89 |
17.82 |
|
|
Lepidium draba L. |
P length (µm) |
22.61 ± 3.52 |
16.17 |
26.82 |
15.57 |
|
E length (µm) |
14.41 ± 2.10 |
10.93 |
18.45 |
14.56 |
|
|
P/E ratio |
1.60 ± 0.35 |
1.15 |
2.32 |
21.90 |
|
|
Lumen diameter (µm) |
0.51 ± 0.17 |
0.14 |
0.68 |
32.61 |
|
|
Muri width (µm) |
0.49 ± 0.08 |
0.29 |
0.59 |
16.80 |
|
|
Brassica nigra (L.) W.D.J.Koch. |
P length (µm) |
35.44 ± 3.18 |
30.13 |
39.52 |
8.96 |
|
E length (µm) |
16.26 ± 1.73 |
12.86 |
18.32 |
10.62 |
|
|
P/E ratio |
2.21 ± 0.37 |
1.69 |
2.74 |
16.76 |
|
|
Lumen diameter (µm) |
1.43 ± 0.52 |
0.57 |
2.17 |
36.37 |
|
|
Muri width (µm) |
0.51 ± 0.07 |
0.41 |
0.60 |
13.03 |
Note: P = polar axis; E = equatorial axis; SD = standard deviation; CV = coefficient of variation.
Figure 2. The pollen morphology and exine ornamentation of (A) Raphanus raphanistrum, (B) Eruca sativa, (C) Sinapis alba, (D) Sisymbrium irio, (E) Rapistrum rugosum, (F) Sinapis arvensis, (G) Brassica nigra, and (H) Lepidium draba
3.3 Statistical analysis among taxa
For each taxon, descriptive statistics were calculated from the 12 measured pollen grains, including the mean and SD. These statistics were used to summarize grain-level morphometric variation within each examined plant specimen. Boxplots were used to visualize the distribution and variability of the measured pollen characters within the examined specimens (Figure 3).
PCA was conducted as an exploratory multivariate analysis using standardized taxon-level mean values of the quantitative pollen characters. The input matrix comprised eight taxa and five quantitative variables. Hierarchical cluster analysis was similarly performed on the standardized taxon-level mean data using Euclidean distance and Unweighted Pair Group Method with Arithmetic Mean (UPGMA) clustering. Both multivariate analyses were interpreted as exploratory approaches for visualizing morphometric and phenetic similarity within the examined specimens.
3.4 Principal component analysis
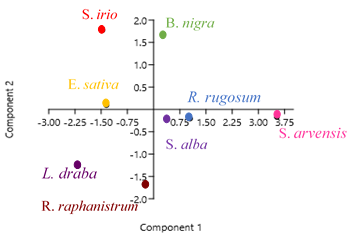
PCA using the correlation matrix revealed that the first two principal components accounted for 94.28% of total quantitative pollen variation within the examined specimens (Table 3 and Figure 4). PC1 explained 64.22% of the total variance and exhibited strong positive loadings for polar axis length (0.967), equatorial axis length (0.924), lumen diameter (0.845), and muri width (0.841). Thus, PC1 primarily reflected variation in overall pollen size and dimensions of exine ornamentation.
Table 3. Component loadings of quantitative pollen morphological characters on the first two principal components
|
Character |
PC1 |
PC2 |
|
Polar axis length (P) |
0.967 |
0.198 |
|
Equatorial axis length (E) |
0.924 |
-0.338 |
|
P/E ratio |
-0.004 |
0.986 |
|
Lumen diameter |
0.845 |
0.501 |
|
Muri width |
0.841 |
-0.356 |
|
Eigenvalue |
3.211 |
1.503 |
|
(%) Variance explained |
64.218 |
30.058 |
|
(%) Cumulative variance |
64.218 |
94.276 |
|
Absolute loading values ≥ 0.40 are shown in bold. |
||
Note: PC1: Principal Componen 1; PC2: Principal Component 2.
PC2 accounted for an additional 30.06% of the variance and was strongly associated with the P/E ratio (0.986), followed by lumen diameter (0.501). These results indicate that PC2 primarily represented variation in pollen shape, with a secondary contribution from lumen size. The negligible loading of the P/E ratio on PC1 (-0.004) further supports that pollen shape is largely independent of the size-related characteristics represented by PC1.
The exploratory PCA score plot revealed a distinct pattern of morphometric differentiation among the examined specimens (Figure 4). S. arvensis occupied the most positive position along PC1, consistent with its comparatively large polar and equatorial dimensions and with the quantitative characters contributing positively to this component. R. rugosum also showed a positive PC1 score, whereas L. draba was positioned on the negative side of PC1. Along PC2, S. irio and B. nigra were positioned on the positive side, consistent with their relatively high P/E ratios and the strong positive loading of P/E on PC2. In contrast, R. raphanistrum and L. draba showed negative PC2 scores, corresponding to comparatively lower P/E ratios. S. alba, E. sativa, and R. rugosum were positioned closer to the centre of the ordination space, indicating comparatively greater similarity in their combined quantitative pollen characters.
3.4 Hierarchical cluster analysis
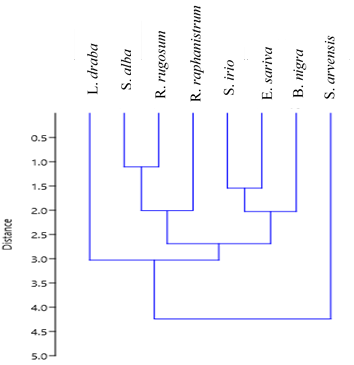
This hierarchical cluster analysis revealed patterns of morphometric similarity among the eight taxa (Figure 5). The closest pair occurred between R. rugosum and S. alba, indicating the greatest similarity in the five quantitative pollen characters included in the analysis. R. raphanistrum subsequently joined this subgroup, followed by L. draba at a greater Euclidean distance. A second grouping was formed by S. irio and E. sativa, with B. nigra subsequently joining this cluster.
Figure 5. Hierarchical cluster dendrogram of eight examined Brassicaceae taxa based on standardized mean values of five quantitative pollen morphological characters using Euclidean distance and UPGMA clustering
The two major groups merged at a higher distance level. In contrast, S. arvensis showed the greatest separation from all other examined specimens, reflecting its distinctive combination of comparatively large polar and equatorial dimensions and lumen diameter. The cophenetic correlation coefficient (r = 0.776) indicated a reasonably good correspondence between the dendrogram and the original distance matrix. Overall, the clustering pattern was broadly consistent with the exploratory PCA, particularly in showing the marked morphometric separation of S. arvensis from the remaining examined specimens.
The results revealed appreciable variation in pollen size, shape, and exine ornamentation within the examined Brassicaceae specimens [9]. Polar axis length and equatorial axis length provided comparatively clear morphometric differentiation, whereas P/E ratio, muri width, and lumen diameter showed greater overlap among several specimens. Yet, the overlap of certain traits within the examined specimens led to the conclusion that no single measurement is enough for complete differentiation. Therefore, the assessment combination of multiple pollen characters presents a more reliable method for distinguishing these eight taxa [13, 14].
The most useful features were polar and equatorial axes length. Pollen size represented one of the most prominent sources of morphometric variation in the present dataset. The strong positive loadings of polar axis length (0.967) and equatorial axis length (0.924) on PC1 support the importance of overall pollen dimensions in structuring the observed variation. S. arvensis displayed comparatively large pollen dimensions, whereas L. draba, E. sativa, and S. irio occupied the smaller range of the observed size; the P and E lengths are helpful characters but should not be used separately or solely for taxonomic separation [15]. S. arvensis showed bigger pollen size (P = 43.23 ± 1.69), while L. draba had the lowest (22.61 ± 3.52 µm). S. arvensis also possessed the highest mean equatorial axis length (23.93 ± 3.38 µm), in contrast to S. irio, which had the lowest value (11.76 ± 1.76 µm). However, direct numerical equivalence should be interpreted cautiously because published measurements may have been obtained from differently prepared pollen using LM, whereas the present measurements were obtained from SEM material. Differences in preparation, hydration state, grain orientation, and measurement procedure can influence apparent pollen dimensions [16].
The notable separation of S. arvensis showed extreme positive PC1 and was not associated with a single character, but with a combination of comparatively large pollen dimensions and exine measurements. Thus, its positions reflects its combined morphometric profile rather than pollen size alone. Its separation in the UPGMA dendrogram is consistent with this multivariate pattern. Nevertheless, lumen diameter revealed a substantial intra-taxon variability in some taxa, likely affected by the measurement site on the surface of pollen and the visibility of the reticulate pattern in SEM images [13]. Collectively, these findings indicate that PCA effectively summarized the combined effects of pollen size, shape, and exine ornamentation, providing clearer taxonomic separation than analysis based on individual traits [17].
Pollen shape contributed a second and largely distinct dimension of variation. The P/E had a negligible loading on PC1 (-0.004) but a very strong positive loading on PC2 (0.986), indicating that PC2 was primarily associated with differences in pollen proportions rather than overall size. The positive PC2 positions of S. irio and B. nigra therefore correspond to their comparatively higher P/E value. Whereas R. raphanistrum and L. draba occupied more negative positions. Previous Brassicaceae studies have documented variation from spheroidal or prolate to sub-prolate and prolate pollen forms. For example, a combined LM-SEM study reported sub-prolate pollen in S. irio [18], while palDat describes prolate pollen for B. nigra and E. sativa. Consequently, pollen shape provides information complementary to pollen size, but the overlap observed among several examined specimens indicates that P/E should not be treated as an isolated diagnostic character.
Our results showed that the loading of both lumen diameter and muri width on PC1 was strong, while PC2 showed lumen diameter contribution. These loadings suggest that quantitative differences in the reticulate exine pattern, reticulate exine ornamentation, widely reported among Brassicaceae studies [13, 19], and differences in lumen and muri measurements should be interpreted more cautiously because its sensitive to select measurements position, local variation across the pollen surface, grain orientation, image quality, and the visibility of reticulate boundaries.
S. alba and R. rugosum formed the closest pair despite belonging to different genera; also, S. irio and E. sativa formed another close group, as shown in Figure 5. Such associations are expected in a phenetic analysis, because Euclidean distance and UPGMA group specimens according to similarity across the five numerical variables [20].
Taken together, the present results suggest that quantitative pollen morphology provides useful supplementary phenetic information for examined Brassicaceae taxa. Polar and equatorial dimensions contributed strongly to morphometric differentiation, whereas P/E represented an additional shape-related component, and lumen and muri measurements added information on exine variation.
The limited biological replication indicates that these pollen characters should not be interpreted as independent evidence of phylogenetic relationships or definitive taxonomic boundaries. The analysis used a selected set of quantitative SEM-derived features, and some detailed pollen characters may need further qualitative evaluation. As well, characters like lumen and muri measurements can change depending on where they are measured on the pollen surface and how the pollen grains are oriented in SEM images. For these reasons, these characters should be interpreted carefully and together with pollen size and shape characters when making taxonomic decisions.
This study suggests that quantitative pollen characters may provide supplementary phenetic information for examined Brassicaceae taxa, but these findings should be considered preliminary pending replication with larger sample sizes and multiple populations. Pollen size characters, practically polar and equatorial axis lengths, represent major contributors to morphometric variation, while the P/E ratio provided essentially shape-related information. Exine ornamentation, both lumen diameter and muri width, contributed to the differentiation within the examined specimens, although the observed within-specimen variability suggests cautious interpretation. The morphometric differentiation was supported by the combination of descriptive statistics, PCA, and hierarchical clustering, and noted the distinctive morphometric position of S. arvensis, summarizing exploratory morphometric patterns. Overall, this study suggests that quantitative pollen characters may provide supplementary phenetic information for Brassicaceae taxa, but these findings should be considered preliminary pending replication with larger sample sizes and multiple populations.
[1] Gharb, L.A. (2014). Morphological, anatomical and geographical distribution studies of species Strigosella africana (L.) Botsch. World Journal of Experimental Biosciences, 2(1): 6-12.
[2] Aliyeva, A.M. (2025). New research on the Brassicaceae Burnett. family: A systematic review. Research in Ecology, 7(5): 45-58. https://doi.org/10.30564/re.v7i5.10733
[3] German, D.A., Hendriks, K.P., Koch, M.A., et al. (2023). An updated classification of the Brassicaceae (Cruciferae). PhytoKeys, 220: 127. http://doi.org/10.3897/phytokeys.220.97724
[4] Gabr, D.G.I. (2018). Taxonomic importance of pollen morphology for some species of Brassicaceae. Pakistan Journal of Biological Sciences, 21: 215-223. http://doi.org/10.3923/pjbs.2018.215.223
[5] Erden, A., Menemen, Y. (2021). Comparative pollen morphology studies on some species of Brassicaceae in Turkey. Biological Diversity and Conservation, 14(1): 105-118. https://doi.org/10.46309/biodicon.2021.773419
[6] Mathree, M.K., Aliwy, S.A. (2024). Morphological characters study for eleven species belongs to Brassicaceae family in Iraq. Iraqi Journal of Agricultural Sciences, 55(Special): 43-51. https://doi.org/10.36103/ijas.v55iSpecial.1884
[7] Punt, W., Hoen, P.P., Blackmore, S., Nilsson, S., Le Thomas, A. (2007). Glossary of pollen and spore terminology. Review of Palaeobotany and Palynology, 143(1-2): 1-81. https://doi.org/10.1016/j.revpalbo.2006.06.008
[8] Hesse, M., Halbritter, H., Zetter, R., et al. (2009). Pollen terminology. An illustrated handbook. Annals of Botany, 105(2). https://doi.org/10.1093/aob/mcp289
[9] Erdtman, G. (2023). Pollen morphology and plant taxonomy: Angiosperms (an introduction to palynology). Brill.
[10] Hammer, Ø., Harper, D.A., Ryan, P.D. (2001). PAST: Paleontological statistics software package for education and data analysis. Palaeontologia Electronica, 4(1): 9. https://paleo.carleton.ca/2001_1/past/past.pdf.
[11] PINAR, M., Duran, A., Ceter, T., TUĞ, G.N. (2009). Pollen and seed morphology of the genus Hesperis L. (Brassicaceae) in Turkey. Turkish Journal of Botany, 33(2): 83-96. http://doi.org/10.3906/bot-0807-15
[12] Othman, O.M., Hamad, R.M. (2022). Pollen micromorphological study of ten genera of brassicaceae in West Iraq Desert. IOP Conference Series: Earth and Environmental Science, 1060(1): 012103. http://doi.org/10.1088/1755-1315/1060/1/012103
[13] Amina, H., Ahmad, M., Bhatti, G.R., et al. (2020). Microscopic investigation of pollen morphology of Brassicaceae from Central Punjab-Pakistan. Microscopy Research and Technique, 83(4): 446-454. https://doi.org/10.1002/jemt.23432
[14] Noor, W., Zafar, M., Ahmad, M., et al. (2025). Taxonomic significance of palyno-morphic markers for the delimitation of some Brassicaceous taxa in Balochistan Province (Pakistan). Genetic Resources and Crop Evolution, 72(1): 587-614. https://doi.org/10.1007/s10722-024-01997-2
[15] Caner, H., Yılmaz Dağdeviren, R., Karlıoğlu Kılıç, N., Güngör, G. (2026). Morphometric and statistical analysis of pollen morphology in seven woody species of betulaceae. Plants, 15(6): 947. https://doi.org/10.3390/plants15060947
[16] Halbritter, H., Ulrich, S., Grímsson, F., et al. (2018). Pollen morphology and ultrastructure. In Illustrated Pollen Terminology, pp. 37-65. https://doi.org/10.1007/978-3-319-71365-6_3
[17] Qu, T.M., Chen, X.Y., Zheng, X.Y., et al. (2025). Pollen morphology and species differentiation in selected species of Inuleae (Asteraceae). PhytoKeys, 263: 215. https://doi.org/10.3897/phytokeys.263.165364
[18] Umber, F., Zafar, M., Ullah, R., et al. (2022). Implication of light and scanning electron microscopy for pollen morphology of selected taxa of family Asteraceae and Brassicaceae. Microscopy Research and Technique, 85(1): 373-384. https://doi.org/10.1002/jemt.23912
[19] Abdel Khalik, K., Van Den Berg, R.G., Van Der Maesen, L.J.G., El Hadidi, M.N. (2002). Pollen morphology of some tribes of Brassicaceae from Egypt and its systematic implications. Feddes Repertorium: Zeitschrift für botanische Taxonomie und Geobotanik, 113(3-4): 211-223. https://doi.org/10.1002/1522-239X(200208)113:3/4<211::AID-FEDR211>3.0.CO;2-A
[20] Nazish, M., Zubair, M., Shah, M.H., et al. (2026). Correlational analysis of halotolerant palynomorphs peculiarities by integrating morphological and morphometric characterization using scanning electron microscopy. Scientific Reports, 16(1): 7142. https://doi.org/10.1038/s41598-026-38101-w