Saad H. Farhan* | Ahmed F. Fayyadh
© 2026 The authors. This article is published by IIETA and is licensed under the CC BY 4.0 license (http://creativecommons.org/licenses/by/4.0/).
OPEN ACCESS
The Wadi Al-Ghadf basin is located in an arid region characterized by seasonal rainfall concentrated in the winter season. The basin lacks a meteorological station to measure rainfall, posing a challenge to hydrological assessment. Therefore, this study aims to estimate surface runoff in the Al-Ghadf Valley using the Soil Conservation Service Curve Number (SCS-CN) model and evaluate its suitability for water harvesting in western Iraq. Mathematical models were applied to determine the volume of surface runoff and propose water storage solutions through the construction of a dam along the seasonal wadi course. Surface runoff values were calculated based on annual rainfall data and the maximum soil water retention capacity (S) for 2025. The analysis included the basin's natural characteristics, such as slope, land use, and hydrological soil group (HSG). The study relied on rainfall data from the Al-Rutba station (124 mm/year). The calculated annual surface runoff volume (QV) using the SCS-CN model, based on annual rainfall data, ranged from 2.28 to 169.24 million m³/year, with a total of 346.81 million m³/year. A design storm of 60 mm over 12 hours was simulated using WMS software, yielding a peak discharge of approximately 40 m³/s for the day (March 18, 2025). This represents the maximum flow rate during a period of rainfall only. The study concluded that it is feasible to construct two reservoirs, one with a capacity of 10.3 million m³ and the other with a capacity of 12.4 million m³, which could be used during drought periods.
Soil Conservation Service Curve Number, Wadi Al-Ghadf basin, surface runoff, water harvesting, storage capacity
The importance of estimating the surface runoff in Wadi Al-Ghadf lies in its usefulness as an instrument in the realization of various interrelated goals. These involve measuring the amount of water, minimizing water losses, increasing the rate of groundwater recharge, lessening the intensity of runoff, and sustaining water supply to human activities like grazing and rain-fed farming. Rainfall and its surface flow are basic determinants in the soil erosion process and are vital in supporting life. Thus, the importance of investment in this sphere of knowledge cannot be overestimated [1].
The research problem is the lack of water sources in western Iraq because of the arid climate, which has put significant strain on the available water sources, especially groundwater. Lack of rainfall and runoff data is a major problem for researchers. One of the most effective methods to deal with such challenges is assumed to be the model created by the United States Department of Agriculture (USDA) [2]. Harsh climatic conditions, insufficient rainfall, and the infeasibility of the direct use of groundwater because of high salinity and depth are the main issues that arid areas of Iraq struggle with [3]. The Soil Conservation Service Curve Number (SCS-CN) approach forecasts runoff caused by rainfall by developing a correlation between the amount of runoff and land use properties. Its application in arid regions and in supporting dam construction to augment water storage has been widely reported in previous studies [4, 5]. The SCS-CN method is one of the most popular methods for estimating water harvesting potential. The Soil Conservation Service (SCS) of the USDA created it in 1970 and codified it in 1986. It is based on a set of mathematical equations that are applied to land cover, land use patterns, soil hydrology, vegetation type, and rainfall data [6]. This paper determines the depth and volume of surface runoff in the Wadi Al-Ghadf basin in order to determine the storage capacity of the proposed dams to collect rainwater.
The study area suffers from water shortage due to low rainfall [7]. Results indicate that the SCS-CN model can be adequately applied to predict surface runoff in the Wadi Al-Ghadf basin and to support water harvesting projects. This contributes to reducing the economic costs and time required to forecast runoff, particularly in distant locations where hydrological monitoring stations are not available, by using modern techniques such as remote sensing. This research can provide an estimated model for calculating surface water runoff in arid regions of western Iraq and maximizing the use of the rainy season during periods of drought [8].
This limits the availability of hydrological data necessary for direct surface runoff estimation. Furthermore, the basin's nature and high rates of evaporation and seepage loss necessitate the development of small-scale storage facilities and local water harvesting systems to support human activities and enhance the utilization of floodwater in this arid environment.
2.1 Study area
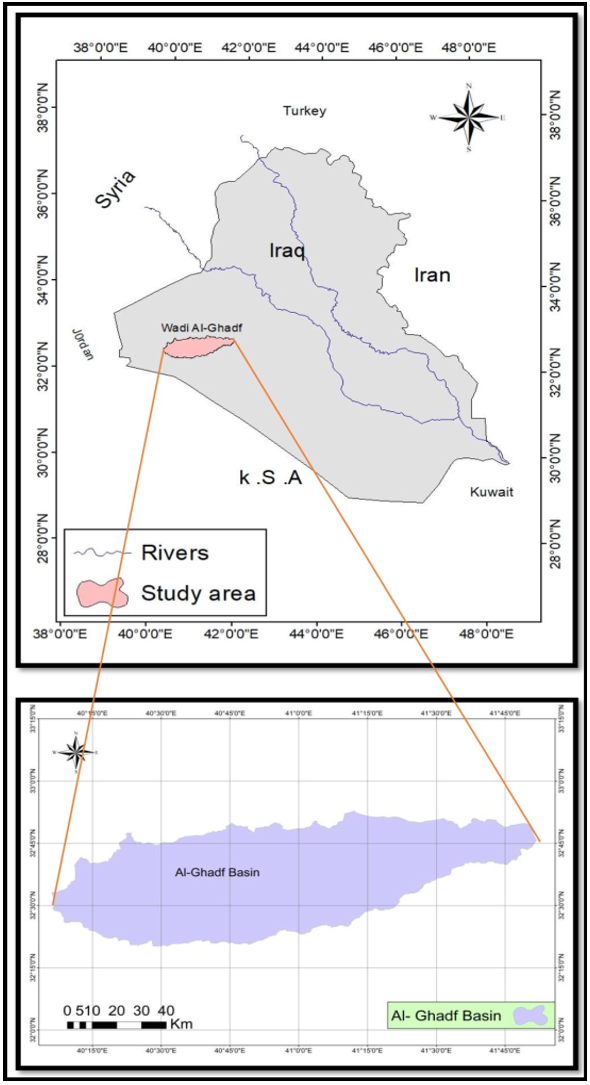
The study area is located in the Wadi al-Ghadf basin in western Iraq, within the western plateau of Anbar Governorate. The basin extends eastward, covering a total area of approximately 6,029.9 square kilometers. It is geographically bounded by longitudes 40°06′00″N to 41°51′50″N and latitudes 32°20′00″E to 32°52′40″E (Figure 1).
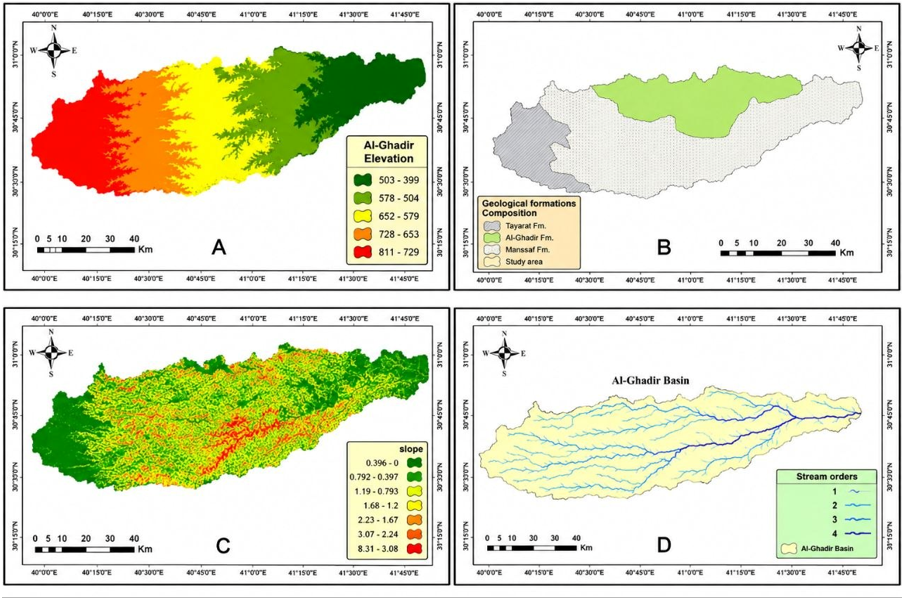
The difference in elevation between the highest and lowest points of the basin is about 422 meters above sea level. The basin is located in a tectonically stable area and has relatively stable geomorphological features [8]. There is a hot and dry climate in summer with minimal rainfall in winter. The basin geology is Pleistocene and Quaternary in age, with a system of valleys, alluvial sediments, and deposits formed by seasonal floods in the upstream regions. The soils are a blend of mineral, chemical, and organic compounds that have developed under climatic forces [9]. The drainage network classification reveals four stream orders (Figure 2).
Figure 1. Location of Wadi Al-Ghadf basin in Iraq
Figure 2. (A) Elevation, (B) geological maps, (C) slope, and (D) stream orders in the Wadi Al-Ghadf basin
2.2 Data
This paper was conducted within a Geographic Information System (GIS) environment by gathering data concerning the study region. It used Landsat 9 OLI satellite imagery, as of March 18, 2025, and a Digital Elevation Model (DEM). In addition, climatic information from the Rutba meteorological station was included, as shown in Tables 1 and 2.
Table 1. Study area data
|
Data Type |
Path |
Row |
Date / Period |
Sensor |
|
Landsat |
170 |
37-38 |
March 18, 2025 |
OLI-19 |
|
DEM |
N/A |
670 settings |
4/4/2025 |
ALOS L-Band |
|
Land Use |
- |
- |
2025 |
Digital |
|
Soil Map |
- |
- |
2025 |
Digital |
|
Climate Data |
- |
- |
March |
Data reported by the weather station |
Table 2. Data sources and software used
|
Software Used |
Source |
Image Date/Release |
Spatial Resolution |
Data Source |
|
ArcGIS 10.8 |
National Authority for Remote Sensing |
2025/5/18 |
30 m |
Landsat 9 OLI/TIRS |
|
Global Mapper 25 |
Alaska Satellite Facility (ASF) |
2021 |
12.5 m |
Digital Elevation Model (DEM) |
|
ArcGIS 10.8 |
Iraqi Geological Survey |
2020 |
1: 250000 |
Geological Maps |
|
|
Iraqi Geological Survey |
2020 |
1:100000 |
Topographic Maps |
2.3 Climate data
The basin is approximately 167.6 km long within the desert plateau of western Iraq, and its elevation reaches 422 meters above sea level. This elevation has affected rainfall amounts and made measurement difficult. Therefore, data from the Rutba station were relied upon. Rainfall is absent during the summer months, while it begins in October and continues until May, with an average annual rainfall of 124.8 mm/year (Table 3).
Table 3. Average rainfall for the Rutba station for the period (2000-2025)
|
Month |
Jan |
Feb |
Mar |
Apr |
May |
June |
July |
Aug |
Sep |
Oct |
Nov |
Dec |
Average |
|
Rainfall rate/mm |
21.2 |
14.4 |
21.1 |
13.5 |
4.7 |
0 |
0 |
0 |
0 |
14.1 |
17.3 |
18.5 |
124.8 |
2.4 Soil Conservation Service Curve Number model
A number of mathematical models have been constructed to approximate surface runoff in drainage basins, specifically in arid areas. One of the most popular ones is the SCS-CN model, which was created by the SCS of the USDA [10].
This model is based on a series of mathematical formulas that are based on the availability of data associated with land cover, soil features, types of vegetation, and the quantity of rainfall [11]. The model used in this research was applied through the incorporation of the necessary data within a GIS environment using ArcGIS 10.8, in addition to the analysis of spatial changes with the help of remote sensing and satellite images [12]. The mathematical description of the SCS-CN model according to the USDA (1986) is as follows:
$Q=(P-I a)^2 /(P-I a)+S$ (1)
where,
Q = surface runoff depth (inches);
P = precipitation depth (inches);
Ia = initial abstraction (inches), representing losses before runoff begins (including infiltration, evaporation, and interception by vegetation);
S = potential maximum retention after runoff begins (inches).
Since the initial abstraction (Ia) is typically assumed to be 20% of S, it is calculated using:
$I a=0.2 \times S$ (2)
The value of S is calculated using the following equation:
$S=1000 / C N-10$ (3)
Because the original units are in inches, they are converted into millimeters to match the metric system by multiplying by 25.4. Thus, Eq. (3) becomes:
$S=25400 / C N-254$ (4)
After obtaining the values of S, $I a$, and Q, these layers are processed within ArcGIS 10.8 to estimate the surface runoff volume using:
$Q V=(Q \times A) \times 1000$ (5)
where,
QV = annual surface runoff volume (m³);
Q = surface runoff depth (mm);
A = basin area (km²).
To determine the Curve Number (CN), the weighted average is calculated based on land use/land cover (LULC) classes using [13]:
$\begin{gathered}C N=(A 1 \times C N 1)+(A 2 \times C N 2)+\ldots . /(A 1+A 2+A 3+\ldots)\end{gathered}$ (6)
where,
A = area of each land use/land cover type;
CN = Curve Number corresponding to each land cover type.
2.5 Land cover classification
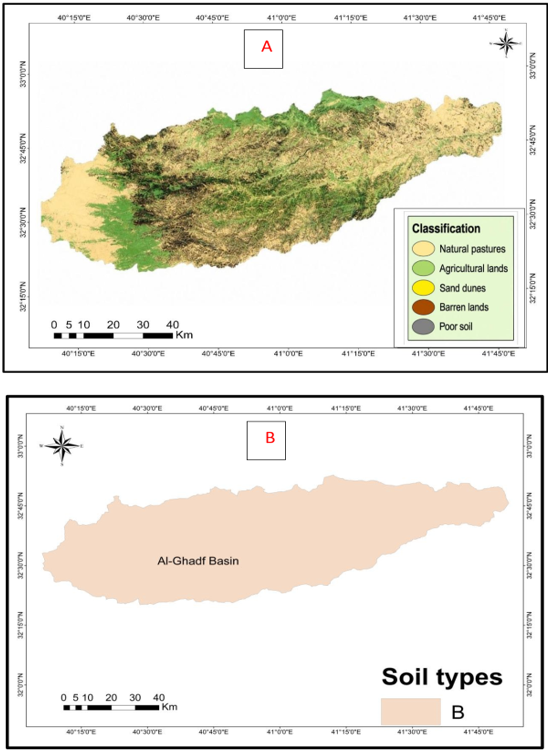
In the study area, LULC was classified using advanced geospatial methods to identify land associated with human activities, with the objective of determining the demands of agricultural and grazing activities. This helps in sustainable planning and resource management [14]. One of the most significant variables that were included in the development of the model is land cover. The analysis was based on the satellite image obtained from Landsat 9 OLI, and the supervised classification method was employed, which is also based on previous knowledge of the study area with the help of field observations. This classification led to five major classes as shown in Figure 3.
Figure 3. (A) Land cover classification and (B) hydrologic soil group
2.6 Land cover classes
Natural Rangelands: These are found in most parts of the study area and are mainly reliant on rain. Pastoralists make extensive use of them in the rainy season. The natural rangelands cover a total area of about 2,238.4 km2.
Agricultural Lands: Rainfed agriculture forms the basis of agriculture, and most agricultural lands are used to grow cereals. They are usually found in valley channels, and they consist of unconsolidated materials such as fine and coarse sand, small gravel, clay, and silt deposits that cover the valley floors. They have an approximate total area of 371.2 km2.
Sand Dunes: Sand dunes are distributed all across the basin and are created due to the deposition of materials carried by dust storms and the buildup of sediments owing to intermittent flows, which are then blown by wind. They have an area of about 53 km2.
Barren Lands: These are rocky areas, eroded spots, and remote valley channels where water erosion has stripped the soil cover, leaving behind sparse or no vegetation cover. The area of barren lands is about 675.5 km2.
Poor Soils: These are soils that have lost some of their vital elements because of erosion and weathering. They are mostly located on the slopes and are characterized by low potential for vegetation growth. They cover an area of about 2,691.8 km2.
2.7 Hydrologic soil group
According to the classification of the Food and Agriculture Organization [15], soils are divided into four hydrologic groups based on their infiltration rates and moisture conditions. In the study area, and based on the SCS classification system, only one hydrologic soil group was identified, namely Group B, as illustrated in Figure 3 and Tables 4 and 5.
Table 4. Hydrologic soil types in Wadi Al-Ghadf basin
|
Group |
Runoff Depth |
Soil Type |
Porosity |
Infiltration Rate (mm/h) |
|
B |
Medium |
Sandy layer, shallower than Group A, with moderate infiltration after wetting (silty-loam or loamy-silty mixture) |
Moderate |
Moderate infiltration, 3.81–7.62 |
Table 5. LULC-HSG-CN cross
|
LULC Class |
HSG |
Hydrologic Condition |
CN (AMC II) |
|
Sandy desert (Sand dunes) |
B |
Good |
69 |
|
Bare desert surface |
B |
Fair |
71 |
|
Rocky–gravel desert |
B |
Fair/Poor |
79 |
|
Wadi channels |
B |
Poor |
82 |
2.8 Peak discharge estimation using Water Management System
The Water Management System (WMS) software was used to simulate the hydrological response of a watershed and estimate the peak discharge resulting from a 60 mm rainfall storm over a 12-hour period in March 2025. The procedure began by extracting the basin boundaries, drainage network, and flow directions using a DEM. The Flow Direction algorithm was then applied to determine the flow direction between cells, followed by the Flow Accumulation algorithm to extract watercourses, divide the basin into sub-basins, and connect them to the hydrological network.
Next, the Time of Concentration for each sub-basin was calculated based on the basin's morphometric characteristics, particularly the length of the main channel, the mean gradient, and surface features. The Time of Concentration was then used to construct the hydrograph and determine the time of arrival of the peak flow. To estimate rainfall losses, the SCS-CN methodology was used. CN values were determined by integrating land use maps with soil hydrological datasets within a GIS environment.
These values were then used to calculate the effective surface runoff depth after subtracting primary losses, infiltration losses, and surface retention losses using standard SCS equations.
3.1 Estimation of surface runoff in the Wadi Al-Ghadf basin using the Soil Conservation Service Curve Number model
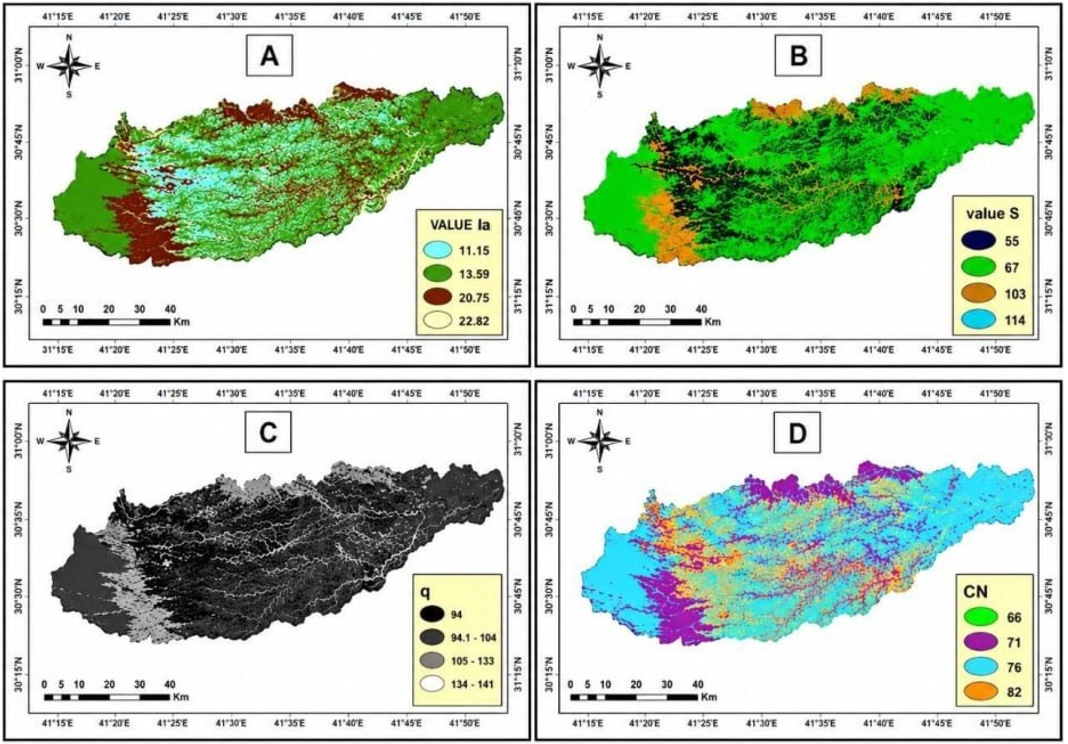
The CN value reflects the land cover and hydrologic conditions of the soil, indicating its water absorption capacity and, consequently, the basin’s response to surface runoff. CN values range from 0 to 100 [3]. In this study, CN values were obtained using tables prepared by the SCS, USA. After comparing these values with the conditions of the study area, the CN values for the Wadi Al-Ghadf basin were determined to range between 69 and 82 [16], as shown in Table 5 and Figure 4.
CN values were extracted using the SCS-CN method under the second pre-moisture condition (AMC II), which represents the average soil moisture before the storm. The study area is characterized by an arid desert environment; therefore, the second pre-moisture condition (AMC II) was chosen due to the lack of continuous monitoring data for soil moisture. CN values were determined based on land use and cover classifications, hydrological soil group (HSG B), and hydrological condition according to the National Engineering Manual issued by the Natural Resources Conservation Service (NRCS) (2004), Part 630, Chapter 9, Table 9-1, and SCS Report TR-55 (1986).
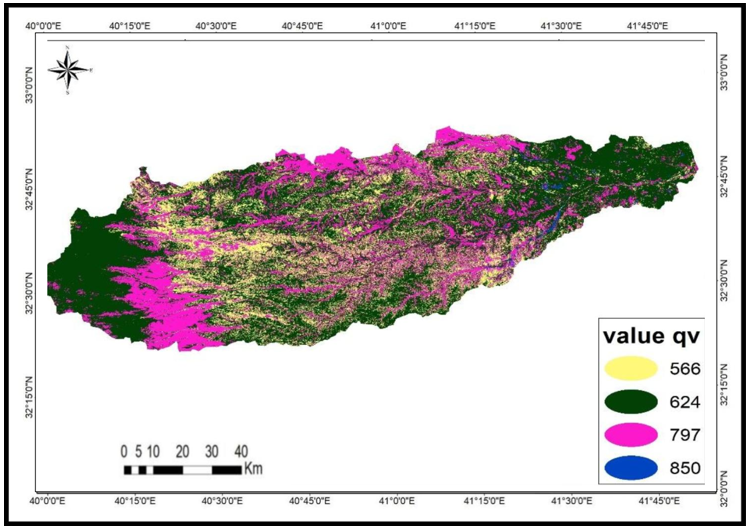
Using equations in ArcMap 10.8 and the Raster Calculator, a map was created to identify areas with similar criteria, as well as to determine their areas and percentages. Climatic data from the Rutba station were used, taking into account the natural characteristics of the Wadi Al-Ghadf basin, the length of the main channel, the length of the basin center, precipitation characteristics, and soil erosion potential. As shown in Table 6 and Figure 4, the maximum potential retention factor (S) values ranged from approximately 55.76 to 114.12 mm, corresponding to CN values between 69 and 82, respectively. The highest potential retention factor (S) values were recorded when the CN values decreased, reflecting a high potential soil capacity to retain rainwater, while high CN values were associated with low S values, indicating a low potential water retention capacity. The surface runoff depth (Q) was calculated using the SCS-CN equation, based on the amount of precipitation (P), the potential retention factor (S), and the initial abstraction (Ia) values [12]. The surface runoff depth (Q) ranged from approximately 48.12 to 76.24 mm, according to the results of the spatial analysis [17].
One of the most important elements of any hydrological research is to estimate annual surface runoff volume (QV) per year [18]. The results of calculating QV for the studied basins showed values ranging from 2.28 to 169.24 million m³/year, with a total of 346.81 million m³/year. These values represent the total surface water volume resulting from rainfall during the water year and do not reflect peak discharge, which represents the instantaneous flow rate measured in m³/s. Each hydrological indicator was treated according to its physical unit (Figure 5).
Table 6. Surface runoff Curve Number (CN) for the Wadi Al-Ghadf basin
|
QV (million m³/year) |
Q (mm) |
Ia (mm) |
S (mm) |
CN |
Area (km2) |
Rainfall Volume (m3/year) |
|
56.94 |
48.12 |
22.82 |
114.12 |
69 |
1183.1 |
147650880 |
|
169.24 |
52.10 |
20.75 |
103.75 |
71 |
3248.2 |
405375360 |
|
118.36 |
75.45 |
13.50 |
67.52 |
79 |
1568.7 |
207005760 |
|
2.28 |
76.24 |
11.15 |
55.76 |
82 |
29.9 |
3731520 |
|
346.81 |
|
|
|
|
6029.9 |
763763520 |
Figure 4. Surface runoff parameters (A) Ia, (B) S, (C) Q, (D) CN of the Wadi Al-Ghadf basin
Figure 5. The Wadi Al-Ghadf basin annual surface runoff volume (QV)
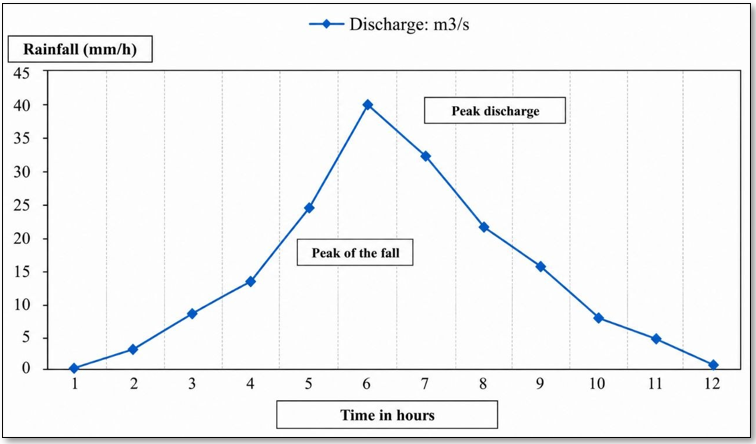
GIS served as the primary source for deriving the spatial characteristics of the basin and the CN values, while the SCS model calculated rainfall losses and converted rainfall to surface runoff. The WMS software then integrated these inputs with drainage network characteristics and concentration time to perform the final hydrological simulation and extract the peak discharge.
This analysis was conducted for a storm event having a total rainfall of 60 mm in 12 hours on March 18, 2025, leading to a peak discharge of 40 m³/s. Due to the fluctuation in rainfall and the region's exposure to periods of drought, the most suitable way to measure the quantity and volume of runoff is to rely on the rainstorm, which is characterized by speed and a high rate of rainfall in a dry region. This necessitates finding a suitable method to measure the amount of water flowing during the storm, considering that most of the rain is sudden, rapid, and heavy, in addition to the fact that the torrents coming from the upper levels need time to reach the peak of the drainage in most of the area of the Al-Ghadf basin (Figure 6).
The value of the annual rainfall volume listed in the table (approximately 763 million m³) represents the annual volume of rainfall over the basin, whereas the WMS simulation is based on a single rainfall event. Therefore, the difference in the baseline between the two analyses is intentional, as each has a different hydrological objective.
Figure 6. Hydrograph of the Wadi Al-Ghadf basin
The abundance of discharge in the basin is explained by the fact that the Wadi Al-Ghadf basin receives rainfall and directs it to the main channel and ultimately to the outlet [5]. In order to choose the appropriate locations where rainwater can be harvested, a number of steps were taken:
(1) Stage One: This is the most important stage since it dictates the heights of the areas where water would be stored. This was carried out using the DEM of the basin to determine the areas with gentle slopes using the contour lines.
(2) Stage Two: The stream order map was superimposed with contour lines to identify the flow direction of water channels.
(3) Stage Three: It involves finding the appropriate sites where water can be collected and distributed to the local groups, with proper storage facilities during the rainy season.
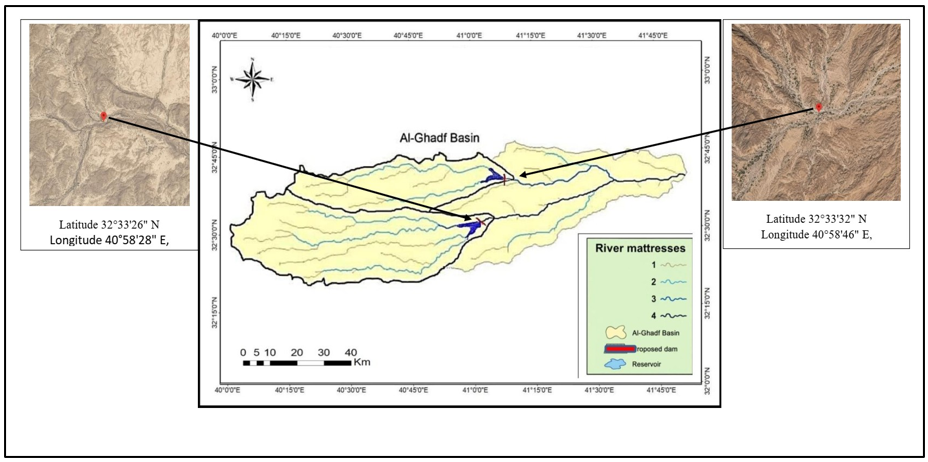
Two suggested dam locations were chosen in the Wadi Al-Ghadf basin:
The criteria for selecting the proposed dam sites were as follows:
A set of preliminary hydrological and geomorphological criteria was adopted to assess the suitability of the dam sites. These values were not used as fixed limits for all environments, but rather as comparative thresholds appropriate to the desert and semi-arid nature of the study area. These criteria were selected based on methodologies for evaluating the sites of water harvesting facilities in dry basins, which emphasize the importance of slope, catchment area, stream order, and expected runoff volume in determining site efficiency.
1-Slope: A slope value of 2.5 m/km was adopted by dividing the difference between the highest and lowest elevations of the catchment by the length of the channel, using a DEM and a GIS program.
2-Extracting the catchment area, determining the flow direction, and calculating runoff accumulation using GIS software, as well as determining the drainage network and the number of sub-basins.
3-Determining the number of levels in the watercourse according to the Strahler system [18].
To estimate the potential storage volume, the following relationship is used [19, 20]:
V = P × A × C × 106
where,
V = Annual collectable runoff volume (m³/year);
P = Annual rainfall (mm);
A = Catchment area (km²) ;
C = Surface runoff coefficient.
Given an annual rainfall of 0.12 m and a runoff coefficient of 0.26, the collectable runoff volumes are:
First basin:
V = 0.12 × 2,500 × 0.26 × 10⁶ = 78,000,000 m³/year
Second basin:
V = 0.12 × 3,500 × 0.26 × 10⁶ = 109,200,000 m³/year
According to the equation above, the annual runoff volume of the first secondary basin reached approximately 78 million m³/year, while it reached approximately 109.2 million m³/year in the second secondary basin. After accounting for losses due to evaporation, seepage, and other factors, the storage capacities of the two proposed reservoirs are (10,300,000 m³) for the first reservoir and (12,400,000 m³) for the second reservoir (Table 7).
This value represents the expected annual volume of water entering the dam site before accounting for evaporation, seepage, and spillway discharge [21].
The quality value, however, does not depend solely on storage capacity. It is a composite indicator for assessing site suitability, with storage capacity being one of the evaluation criteria alongside slope, catchment area, stream order, and geological characteristics. It is calculated using a system of relative weights of criteria, the method employed in evaluating the sites of water harvesting [22].
The sites were selected because of their high capacity to collect rainfall and eventually form a reservoir. Besides, the water stored can serve the surrounding agricultural lands and help stabilize local communities (Figure 7, Table 8).
The final location of any dam is only approved after the implementation of geological, geotechnical, hydrological, environmental, and economic surveys, and the results of this study represent a preliminary stage for identifying promising locations using GIS and remote sensing techniques.
Table 7. Required engineering standards for each site
|
Proposed Dam |
Dam Height |
Dam Length |
Reservoir Area (km²) |
Reservoir Volume (m³) |
|
First Dam |
5 metres |
250 metres |
1.3 km² |
10,300,000 |
|
Second Dam |
7 metres |
420 metres |
2.4 km² |
12,400,000 |
Table 8. Dam site suitability
|
Criterion |
Standard Values |
Assessment |
Suitability Result |
|
Slope |
2.5 m/km |
Ensure the stability of the dam structure and minimize excavation and backfilling work |
Suitable |
|
Catchment area |
6029.9 km² |
Sufficient water inflow for storage; Select a main channel with an appropriate discharge; Estimate. |
Suitable |
|
Stream order |
4th order |
The storage volume is based on a Digital Elevation Model (DEM); Achieve the optimal ratio for the dam. |
Suitable |
|
Estimated storage capacity |
3 million/m³ |
Height and storage volume. |
Suitable |
Figure 7. Proposed dams and reservoirs in the Wadi Al-Ghadf basin
This research paper presents a methodology that combines geomorphological and hydrological data with GIS and remote sensing techniques to identify the potential for rainwater harvesting in arid regions. The maps generated using this methodology provide spatial data indicating the most suitable locations for water collection and storage [7]. This type of mapping can contribute to achieving environmental sustainability at both the local and regional levels in water harvesting efforts [23]. The map of potential dam sites in Wadi Al-Ghadf shows several locations with varying capacities for rainwater storage. Most of the water catchment areas that feed the dams are located upstream of the proposed dam sites. These sites are expected to have high storage potential under the implemented water management plan [19]. These basins can contribute to groundwater recharge when suitable geological and hydrogeological conditions are present, and storing water behind the dams would be the best way to improve water resources. This work posits that the hydrological behavior of drainage basins, specifically the basin's hydrological response, is influenced by CN values, which depend on land use and HSG, and may be modified by the pre-moisture condition (AMC), indicating the impact of spatial variation in soil and vegetation cover [20]. A surface runoff estimation technique is provided for different rainfall scenarios in the Wadi Al-Ghadf basin. This technique enables researchers to obtain accurate surface runoff predictions at low, medium, and high rainfall levels and can be integrated with broader hydrological models when needed. The study concludes that the SCS-CN model can be effectively applied to estimate surface runoff in the Wadi Al-Ghadf basin, western Iraq, facilitating water harvesting projects. This approach reduces economic and financial costs and saves time required for surface runoff prediction within the basin environment, especially when combined with modern technologies and remote sensing in areas lacking hydrometric stations [24].
The study results demonstrate that the SCS-CN model can be effectively applied to estimate surface runoff in the Wadi Al-Ghadf basin, based on annual rainfall data, soil characteristics, and land use. The calculated surface runoff depth ranged from 55 to 114 mm during 2025. Using morphometric analysis and a DEM, two suitable sites were identified for the construction of earth dams for rainwater harvesting on watercourses with appropriate cross-sections. The estimated storage capacity of the first site was 12,450,000 m³, and that of the second site was 10,500,000 m³. Integrating the SCS-CN model with GIS and remote sensing techniques contributed to identifying suitable locations for water harvesting facilities and estimating their storage potential. However, the adoption of these sites requires detailed studies, including hydrological analysis of rainfall frequencies, geological and geotechnical studies, environmental assessment, economic feasibility analysis, and engineering safety requirements to ensure the efficiency and sustainability of the water harvesting projects.
[1] Ghayeb, A.M., Mohammed, K.S. (2024). Surface runoff volume estimation for water harvesting in Al-Shagrah valley basin, western Anbar plateau. International Journal of Design & Nature and Ecodynamics, 19(3): 1089-1097. https://doi.org/10.18280/ijdne.190338
[2] Al-Akkam, I.S., Al-Sultani, A.H. (2018). Surface runoff in the Wadi Al-Jabab basin using geographic techniques. Al-Qadisiyah Journal of Human Sciences, 32(4): 36-62. http://qu.edu.iq/journalart/index.php/QJHS.
[3] Al-Ansari, T.A., Katpatal, Y.B., Rishma, C. (2020). A historical review of slope based SCS method and its effect on CN and runoff potential globally. https://doi.org/10.20944/preprints202010.0024.v1
[4] Ramel, K.A., Mehemdi, Y.H.A., Awad, A.Y. (2024). Analysis of the trends of change in temperature and precipitation and their impact on water in Anbar Governorate (1980-2023). Dirasat: Human and Social Sciences, 51(5): 16-32. https://doi.org/10.35516/hum.v51i1.10019
[5] Ahmed, S., Jesson, M., Sharifi, S. (2023). Selection frameworks for potential rainwater harvesting sites in arid and semi-arid regions: A systematic literature review. Water, 15(15): 2782. https://doi.org/10.3390/w15152782
[6] Mohammed, I.Q., Farouk, S., Mousa, A., Lawa, F.A. (2022). Lithofacies types, mineralogical assemblages and depositional model of the Maastrichtian–Danian successions in the Western Desert of Iraq and eastern Jordan. Journal of African Earth Sciences, 186: 104397. https://doi.org/10.1016/j.jafrearsci.2021.104397
[7] Mohammad, K.S., Samat, N., Khalid, H.N. (2011). Using remote sensing and GIS for observation land use land cover changes and quantifying arable land loss in Penang Island-A case study of Balik Pulau. In 32nd Asian Conference on Remote Sensing, vol. 3, pp. 1697-1715.
[8] Gharbi, M.A., Salh, A.M., Khalaf, M.J. (2025). Estimation of water runoff and harvestability of the valley of Haliwat Basin, Western Desert using SCS-CN model. Journal of Degraded and Mining Lands Management, 12(4): 8149-8158. https://doi.org/10.15243/jdmlm.2025.124.8149
[9] Gupta, L., Dixit, J. (2022). Estimation of rainfall-induced surface runoff for the Assam region, India, using the GIS-based NRCS-CN method. Journal of Maps, 18(2): 428-440. https://doi.org/10.1080/17445647.2022.2076624
[10] Mohammed, S., FF Al-lahaibi, A., Abdullah, A. (2024). Evaluating temporal variations in soil deterioration in Iraq’s Karma district using spectral indicators. Anbar Journal of Agricultural Sciences, 22(2): 1397-1410. https://doi.org/10.32649/ajas.2024.184878
[11] Jassim, M.S., Gharbi, M.A., Hussein, A.N., Salh, A.M. (2025). Assessment of environmental degradation of land and its impact on agricultural production in western Iraq. Journal of Degraded and Mining Lands Management, 12(5): 8807-8820. https://doi.org/10.15243/jdmlm.2025.125.8807
[12] KN, J.H., Channavar, V.R., Malappanavar, N., Radder, V.S., Chandrakar, T., Basavaraj, D.B. (2024). Spatial analysis of surface runoff using SCS-CN technique integrated with GIS and remote sensing. International Journal of Environment and Climate Change, 14(5): 441-454. https://doi.org/10.9734/IJECC/2024/V14I54204
[13] Mohammed, J.F., Al-Akkam, I.S. (2022). Morphometric analysis of the Rania Alluvial Fan - Northern Iraq (geomorphological study). Journal of College of Education, 50(1): 313-332. https://doi.org/10.31185/eduj.Vol50.Iss1.3436
[14] Muneer, A.S., Afan, H.A., Kamel, A.H., Sayl, K.N. (2022). Runoff mapping using the SCS-CN method and artificial neural network algorithm, Ratga Basin, Iraq. Arabian Journal of Geosciences, 15(7): 666. https://doi.org/10.1007/s12517-022-09954-y
[15] Patil, N.D., Ayare, B.L., Bhange, H.N., Ingle, P.M., Tharkar, M.H., Gavit, S.B. (2024). Runoff estimation in Kajurli watershed using SCS-CN and GIS techniques. International Journal of Environment and Climate Change, 14(10): 547-556. https://doi.org/10.9734/IJECC/2024/V14I104507
[16] Al-Qayyssi, K.A., Mohammed, K.S., Al-Dulaimi, S.Z., Al-Rawi, M.K., Fayyadh, A.F. (2024). Estimating soil erosion in Al-Aubyth Valley using modern techniques and the RUSLE equation. International Journal of Design & Nature and Ecodynamics, 19(5): 1551-1561. https://doi.org/10.18280/ijdne.190509
[17] Ouda, S.A., Al-Lahaibi, A.F., Mohammed, M.I., Jasim, O.H. (2024). Assessing the efficiency of Injana clay for cadmium sorption: Implications for environmental sustainability. The Iraqi Geological Journal, 57(2F): 13-25. https://doi.org/10.46717/igj.57.2F.2ms-2024-12-12
[18] Strahler, A.N. (1964). Quantitative geomorphology of drainage basin and channel networks. In Handbook of Applied Hydrology, McGraw-Hill.
[19] United States Soil Conservation Service (US SCS). (1972). SCS National Engineering Handbook, Section 4: Hydrology. The Service.
[20] Farhan Shalal, H.M., Mohammed, K.S., Al-Kubaisi, M.H., Yusoff, I., Anees, M.T., Bin Abu Bakar, A.F. (2026). Analysis and assessment of surface water quality in Al-Habbaniyah, Iraq. Journal of University of Anbar for Pure Science, 20(1): 345-357. https://doi.org/10.37652/juaps.2025.162815.1529
[21] Chow, V., Maidment, D., Mays, L. (1988). Applied Hydrology. McGraw-Hill, New York.
[22] United States. Bureau of Reclamation. (1960). Design of Small Dams. US Government Printing Office.
[23] Hussain, F., Zhou, Z. (2025). National climate change policy, environmental regulation, and media attention: Implications for sustainable investment. Journal of Cleaner Production, 521: 146235. https://doi.org/10.1016/j.jclepro.2025.146235
[24] Dusengemungu, D.R., Zhou, Z., Liu, J. (2023). Overview of mineral reserves availability in Rwanda: Opportunities and challenges. Environment, Development and Sustainability, 25(10): 10599-10626. https://doi.org/10.1007/s10668-022-02548-4