Rishanthiny Bala Kirshnan | Arina Ismail | Khairi Firdaus Abdullah | Kamilia Sharir | Dwa Desa Warnana | Wien Lestari | Rodeano Roslee*
© 2026 The authors. This article is published by IIETA and is licensed under the CC BY 4.0 license (http://creativecommons.org/licenses/by/4.0/).
OPEN ACCESS
Spatial landslide susceptibility and site-level landslide severity describe related but distinct aspects of slope instability. This preliminary comparison examines Frequency Ratio (FR) susceptibility classes with previously calculated Proforma-based Landslide Severity Level (LSL) scores for twenty-five observed landslides along the Pekan Nabalu–Kundasang corridor, Sabah. The 25-site dataset used in this analysis contains the FR susceptibility class, final LSL score and class, and general locality for each site. Exact agreement between FR and LSL classes occurred at 13 of 25 sites (52%), with Cohen's kappa of 0.40 and linearly weighted kappa of 0.61. LSL scores increased significantly across increasing FR classes (Jonckheere-Terpstra J = 231, p < 0.001), although the Very High class showed substantial within-class variation. These statistics characterize the 25-site dataset and are not used as an independent validation of FR predictive accuracy. The results demonstrate partial correspondence between regional susceptibility and site-level severity and identify discordant records that warrant further field verification or geotechnical investigation. A fully reproducible follow-up assessment should preserve the original Proforma inputs, geotechnical source records, and a verified site crosswalk.
landslide susceptibility, landslide severity, Frequency Ratio, Landslide Hazard Identification Proforma, Kundasang, Sabah
Landslides are among the most significant geological hazards in Sabah, Malaysia, affecting communities, transportation infrastructure, and the natural environment. The Pekan Nabalu–Kundasang corridor is particularly susceptible to slope instability because of its steep topography, complex geological setting, tropical rainfall, and active tectonic environment. The effects of the 2015 Ranau earthquake further demonstrated the sensitivity of slopes surrounding Mount Kinabalu to earthquake-induced ground disturbance and mass movement [1-4].
Previous studies in the Kundasang region have primarily focused on landslide susceptibility mapping using statistical and GIS-based approaches. Researchers have applied Weights of Evidence and Frequency Ratio (FR) models to identify areas with different levels of spatial susceptibility [5-7]. Other studies have examined the influence of lithology, slope geometry, structural discontinuities, land use, runout characteristics, and debris-flow processes [8-11]. These studies provide valuable information on where landslides are more likely to occur but do not directly describe the severity characteristics of individual observed landslides.
Landslide susceptibility and landslide severity represent different concepts. Susceptibility describes the relative spatial likelihood that a landslide may occur, whereas a complete hazard assessment additionally considers temporal occurrence and landslide intensity. The severity or intensity of an observed landslide may be influenced by its magnitude, velocity, displacement, runout, slope geometry, and material characteristics [12, 13]. Therefore, the severity class assigned to an observed landslide does not necessarily correspond directly to the susceptibility class of its location.
The reliability of susceptibility assessments can also be affected by the completeness of landslide inventories, model-development procedures, sampling design, and uncertainty in the conditioning data [14-16]. Consequently, a severity rating should not be used as an independent measure of the predictive accuracy of a susceptibility map. Instead, comparison between the two can be used to identify areas of agreement and divergence.
The Landslide Hazard Identification (LHI) Proforma provides a structured approach for documenting geological, geomorphological, hydrological, land-use, and geotechnical characteristics of observed landslides. The recorded parameter ratings can be combined to calculate a Landslide Severity Level (LSL) [3].
Therefore, this study presents a preliminary comparison of FR-based landslide susceptibility classes and previously calculated Proforma-based LSL scores for twenty-five observed landslides along the Pekan Nabalu–Kundasang corridor. The objective is to quantify agreement, divergence, and ordered association within the 25-site dataset. The comparison is not used to validate FR predictive accuracy; instead, it identifies concordant and discordant records that can support prioritisation for field verification, geotechnical investigation, or monitoring. The analysis uses the final LSL scores because the original Proforma input matrices are not part of the dataset provided for this study.
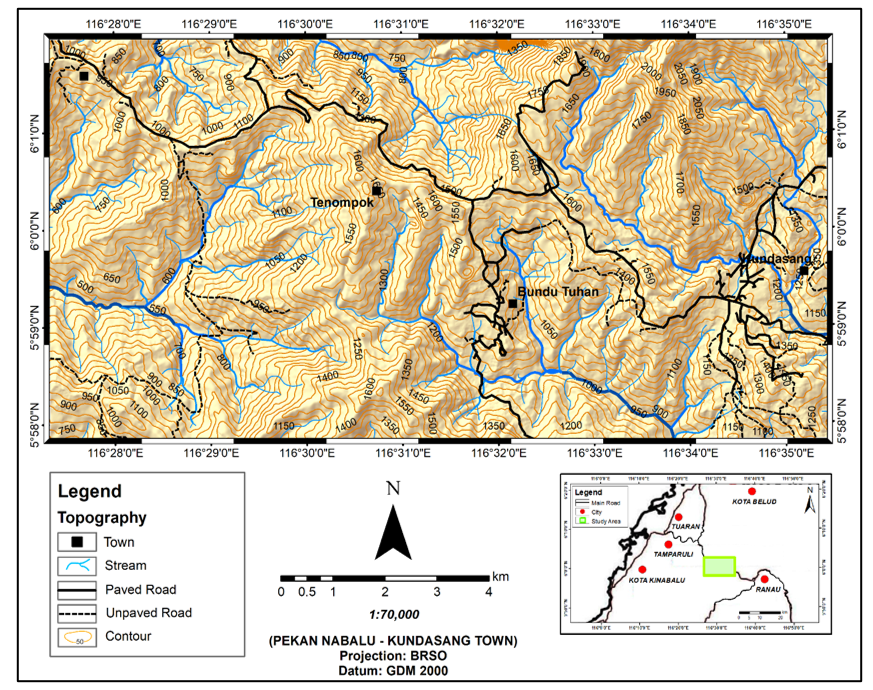
The study area is located in northwestern Sabah, Malaysia, and covers approximately 114 km² between latitudes 5° 57’ 50.02" N to 6°1’57.57" N and 116° 27’ 19.45" E to 116° 35’ 25.97" E. The corridor extends through Pekan Nabalu, Tenompok, Bundu Tuhan and Kundasang and reaches elevations of approximately 2,150 m near the foothills of Mount Kinabalu. Examples of landslide indicators observed along the corridor are shown in Figure 1. The location and topographic setting of the study area are presented in Figure 2.
Figure 1. Examples of landslide indicators observed along the Pekan Nabalu–Kundasang corridor, Sabah
Figure 2. Location and topographic setting of the Pekan Nabalu-Kundasang study area, Sabah
The combination of steep terrain, complex geological conditions, high tropical rainfall, and active tectonic processes contributes to widespread slope instability in the region [4]. The study area is underlain mainly by the Trusmadi Formation, Crocker Formation, and Pinosouk Gravel deposits [5].
The Trusmadi Formation, of Paleocene to Eocene age, consists mainly of dark phyllitic and slaty argillaceous rocks with sandstone and shale interbeds. The Late Eocene to Early Miocene Crocker Formation comprises interbedded sandstone, siltstone, shale, and mudstone. The younger Pinosouk Gravel deposits, of Pleistocene to Holocene age, consist of poorly consolidated gravel, granodiorite boulders, and finer materials within a muddy matrix [5]. Weathering, discontinuities, weak sedimentary layers, and unconsolidated deposits contribute to the variable slope conditions observed throughout the corridor.
This study analyses a 25-site dataset containing FR susceptibility classes and previously calculated LSL scores and classes. The analysis consists of three main components:
(1) compilation of the FR susceptibility class and final LSL score and class for each of the twenty-five analysed sites;
(2) descriptive comparison of the FR and LSL classifications, including class-wise LSL summaries;
(3) agreement and ordered-trend analyses applied to the 25-site dataset.
3.1 Frequency ratio susceptibility map and site selection
The existing FR map provides the regional susceptibility classification for the 25 site records analysed in this study. The LSL results are not used to validate the FR model because susceptibility and severity represent different landslide characteristics, and the 25-site dataset is not an independent validation inventory. The dataset contains five observed landslides in each FR susceptibility class, producing a balanced 25-site dataset. No reproducible probability-based random sampling procedure is documented for these records. The dataset is therefore treated as a balanced stratified sample by FR class, not as a random sample. Equal representation across the five FR classes supports class-to-class comparison but does not represent the natural frequency distribution of landslides in the mapped area. Sampling design and the completeness and spatial representativeness of landslide inventories can influence susceptibility modelling and interpretation [17-20]. Some sites occur within the same general road corridor and may exhibit spatial clustering. Each site identifier, L1–L25, represents one recorded slope-failure observation.
Appendix Table A1 reports a separate 25-record landslide inventory with approximate coordinates, landslide type, activity status, and origin; coordinates are rounded to three decimal places. The files provided for this study contain no verified crosswalk between the Appendix Table A1 records and manuscript site identifiers L1–L25. For this reason, the coordinates are not assigned to individual L1–L25 records. This limitation prevents site-by-site spatial replication.
3.2 Previously calculated Landslide Severity Level data and source records
The dataset contains final LSL scores and severity classes previously calculated using the LHI Proforma developed by Roslee [3]. This study does not repeat the original site-level Proforma assessment. Project documentation states that the original assessment used field observations, laboratory analyses, published literature, and geotechnical records.
Project documentation states that geotechnical and laboratory information supported parameters including Standard Penetration Test values, cohesion, friction angle, shear strength, point-load index, compressive strength, and Rock Quality Designation. However, the original report titles, borehole identifiers, sample identifiers, and site-by-site source records for these parameters were not available to the authors. Therefore, these details could not be reconstructed from the final LSL totals and were not inferred in this study.
Table 1. Parameters and sub-parameters of the Landslide Hazard Identification (LHI) Proforma adapted from Roslee [3]
|
Parameters |
Sub-Parameters |
|
Geological Characteristics |
Rock lithology |
|
Soil series |
|
|
Fracture opening (m) |
|
|
Surface roughness |
|
|
Length of fracture (m) |
|
|
Seepage rate |
|
|
Weathering rate |
|
|
Erosion |
|
|
Geodynamic Features |
State of landslide activity |
|
Distribution of landslide activity |
|
|
Styles of landslide activity |
|
|
Velocity of landslide activity |
|
|
Failure magnitude (m3) |
|
|
Runout distance (m) |
|
|
Geomorphometric Feature |
Slope type |
|
Slope angle (°) |
|
|
Slope height (m) |
|
|
Slope position |
|
|
Geometric slope profile |
|
|
Geometric slope plan |
|
|
Slope inclination height |
|
|
Slope drainage system |
|
|
Engineering structure |
|
|
Vegetation cover (%) |
|
|
Hydrology and Hydrogeology |
Distribution of daily precipitation |
|
Permeability rate (cm/s) |
|
|
Groundwater level (m) |
|
|
Landuse |
Landuse |
|
Soil Mechanical Characteristics |
Standard Penetration Test N-value |
|
Friction Angle ($\Phi$) (°) |
|
|
Cohesion (C) (kN/m2) |
|
|
Shear Strength $(\tau)\left(\mathrm{kN} / \mathrm{m}^2\right)$ |
|
|
Rock Mechanical Characteristics |
Point Load Index (P1) (Mpa) |
|
Compressive Strength ($\Sigma$) (MPa) |
|
|
Friction Angle ($\Phi$) (°) |
|
|
Rock quality designation (RQD) (%) |
The LHI Proforma framework contains seven major parameter groups: geological characteristics, geodynamic features, geomorphometric features, hydrology and hydrogeology, land use, soil mechanical characteristics and rock mechanical characteristics. Table 1 lists the sub-parameters defined in the source framework to document the method used in the original assessment; it does not represent recovered site-level input data.
Under the original LHI Proforma framework [3], individual sub-parameter ratings contribute to seven component scores (S1–S7), which are summed to obtain the total LSL score. The dataset contains the final LSL scores and classifications, but not the original site-specific sub-parameter scoring sheets or S1–S7 component matrices. The project files contain no record explaining the absence of these source records. Because a final LSL total does not uniquely determine its component scores, worked site examples and summary statistics cannot be reconstructed without introducing hypothetical values. No reconstructed values are reported.
3.3 Landslide Severity Level aggregation framework and classification
According to the original LHI-LSL framework [3], the total LSL is defined as the sum of the seven major parameter-group scores:
LSL = S1+S2+S3+S4+S5+S6+S7 (1)
where,
S1 = Geological characteristics
S2 = Geodynamic features
S3 = Geomorphometric feature
S4 = Hydrology and hydrogeology
S5 = Land use
S6 = Soil mechanical characteristics
S7 = Rock mechanical characteristics
The severity thresholds were adopted from the original LHI-LSL model developed by Roslee [3]. In this secondary analysis, the final LSL scores, reported to one decimal place, were classified using the explicit boundaries in Table 2. The scores were not recalculated from S1–S7 because the original component matrices are not part of the dataset.
The comparison examined agreement and divergence between the FR susceptibility class recorded for each site and the corresponding LSL class. Agreement statistics quantify correspondence within the 25-site dataset and are not interpreted as validation of FR predictive accuracy or as evidence that the two classifications measure the same construct.
Table 2. Landslide Severity Level (LSL) classification adapted from Roslee [3]
|
LSL Class |
Rating Value |
Classification |
|
I |
LSL < 13.02 |
Very Low |
|
II |
13.02 ≤ LSL < 19.54 |
Low |
|
III |
19.54 ≤ LSL < 26.06 |
Moderate |
|
IV |
26.06 ≤ LSL ≤ 32.58 |
High |
|
V |
LSL > 32.58 |
Very High |
3.4 Statistical analysis
Agreement between FR susceptibility classes and LSL classes was quantified using percentage exact agreement and Cohen's kappa (κ). Because both classifications consist of five ordered categories, linearly weighted Cohen's kappa was also calculated to reflect the magnitude of class disagreement. The ordered trend in LSL scores across increasing FR susceptibility classes was tested using the Jonckheere-Terpstra test, with p < 0.05 as the statistical threshold. Because the site-selection procedure was not probability-based, the statistics characterize the 25-site dataset and are not generalized to the wider landslide population.
Table 3 presents the final LSL scores and severity classifications for the twenty-five analysed sites. No site-level LSL recalculation was performed in this study. The scores ranged from 12.8 at L7 to 33.6 at L17; two sites were classified as Very Low severity, eleven as Low severity, seven as Moderate severity, three as High severity, and two as Very High severity.
Table 3. Final Landslide Severity Level (LSL) scores and severity classifications for the twenty-five analysed landslide sites
|
Landslide Sites |
Landslide Location |
Rating Value |
Classification |
|
L1 |
Jalan Tomis Tiong Lokos |
15.6 |
II (Low) |
|
L2 |
Jalan Tomis Tiong Lokos |
26.8 |
IV (High) |
|
L3 |
Jalan Tomis Tiong Lokos |
24.6 |
III (Moderate) |
|
L4 |
Jalan Tomis Tiong Lokos |
14.9 |
II (Low) |
|
L5 |
Jalan Tomis Tiong Lokos |
33.1 |
V (Very High) |
|
L6 |
Jalan Tomis Tiong Lokos |
19.4 |
II (Low) |
|
L7 |
Jalan Tomis Tiong Lokos |
12.8 |
I (Very Low) |
|
L8 |
Jalan Tomis Tiong Lokos |
14.3 |
II (Low) |
|
L9 |
Kiau Taburi |
19.5 |
II (Low) |
|
L10 |
Jalan Kiau |
21.0 |
III (Moderate) |
|
L11 |
Jalan Tamparuli-Ranau |
18.1 |
II (Low) |
|
L12 |
Jalan Tamparuli-Ranau |
20.0 |
III (Moderate) |
|
L13 |
Jalan Tamparuli-Ranau |
17.3 |
II (Low) |
|
L14 |
Jalan Kinasaraban, Bundu Tuhan |
16.7 |
II (Low) |
|
L15 |
Jalan Cinta Mata Mesilou |
15.8 |
II (Low) |
|
L16 |
Jalan Kundasang Kaulan |
16.9 |
II (Low) |
|
L17 |
Jalan Kundasang Kaulan |
33.6 |
V (Very High) |
|
L18 |
Kampung Dumpiring |
12.9 |
I (Very Low) |
|
L19 |
Zen Garden Resort, Kundasang |
20.0 |
III (Moderate) |
|
L20 |
Klinik Kesihatan Bundu Tuhan |
27.6 |
IV (High) |
|
L21 |
Bundu Tuhan |
27.4 |
IV (High) |
|
L22 |
Jalan Tamparuli - Ranau |
19.7 |
III (Moderate) |
|
L23 |
Bundu Tuhan |
23.7 |
III (Moderate) |
|
L24 |
Jalan Tenompok Bundu Tuhan |
16.6 |
II (Low) |
|
L25 |
Jalan Tenompok Bundu Tuhan |
20.0 |
III (Moderate) |
Table 4 compares the FR susceptibility class with the corresponding LSL score and severity class for each of the twenty-five sites. Table 5 summarizes the LSL scores according to FR susceptibility class. The mean LSL score increased from 14.14 in the Very Low FR class to 27.80 in the Very High FR class.
Table 4. Comparison of Frequency Ratio (FR) susceptibility classes and previously calculated Landslide Severity Level (LSL) outputs for the 25 analysed sites
|
FR Susceptibility Class |
Site |
General Location |
LSL Score |
LSL Class |
|
Very Low |
L4 |
Jalan Tomis Tiong Lokos |
14.9 |
II-Low |
|
Very Low |
L7 |
Jalan Tomis Tiong Lokos |
12.8 |
I-Very Low |
|
Very Low |
L8 |
Jalan Tomis Tiong Lokos |
14.3 |
II-Low |
|
Very Low |
L15 |
Jalan Cinta Mata Mesilou |
15.8 |
II-Low |
|
Very Low |
L18 |
Kampung Dumpiring |
12.9 |
I-Very Low |
|
Low |
L1 |
Jalan Tomis Tiong Lokos |
15.6 |
II-Low |
|
Low |
L6 |
Jalan Tomis Tiong Lokos |
19.4 |
II-Low |
|
Low |
L9 |
Kiau Taburi |
19.5 |
II-Low |
|
Low |
L11 |
Jalan Tamparuli–Ranau |
18.1 |
II-Low |
|
Low |
L24 |
Jalan Tenompok, Bundu Tuhan |
16.6 |
II-Low |
|
Moderate |
L12 |
Jalan Tamparuli–Ranau |
20.0 |
III-Moderate |
|
Moderate |
L14 |
Jalan Kinasaraban, Bundu Tuhan |
16.7 |
II-Low |
|
Moderate |
L16 |
Jalan Kundasang Kaulan |
16.9 |
II-Low |
|
Moderate |
L22 |
Jalan Tamparuli–Ranau |
19.7 |
III-Moderate |
|
Moderate |
L25 |
Jalan Tenompok, Bundu Tuhan |
20.0 |
III-Moderate |
|
High |
L2 |
Jalan Tomis Tiong Lokos |
26.8 |
IV-High |
|
High |
L3 |
Jalan Tomis Tiong Lokos |
24.6 |
III-Moderate |
|
High |
L10 |
Jalan Kiau |
21.0 |
III-Moderate |
|
High |
L19 |
Zen Garden Resort, Kundasang |
20.0 |
III-Moderate |
|
High |
L23 |
Bundu Tuhan |
23.7 |
III-Moderate |
|
Very High |
L5 |
Jalan Tomis Tiong Lokos |
33.1 |
V-Very High |
|
Very High |
L13 |
Jalan Tamparuli–Ranau |
17.3 |
II-Low |
|
Very High |
L17 |
Jalan Kundasang Kaulan |
33.6 |
V-Very High |
|
Very High |
L20 |
Klinik Kesihatan Bundu Tuhan |
27.6 |
IV-High |
|
Very High |
L21 |
Bundu Tuhan |
27.4 |
IV-High |
Table 5. Descriptive statistics of final Landslide Severity Level (LSL) scores according to Frequency Ratio (FR) susceptibility class
|
FR Susceptibility Class |
Number of Sites |
Mean LSL ± SD |
LSL Range |
Observed Severity Distribution |
|
Very Low |
5 |
14.14 ± 1.29 |
12.8-15.8 |
2 Very Low; 3 Low |
|
Low |
5 |
17.84 ± 1.72 |
15.6-19.5 |
5 Low |
|
Moderate |
5 |
18.66 ± 1.70 |
16.7-20.0 |
2 Low; 3 Moderate |
|
High |
5 |
23.22 ± 2.75 |
20.0-26.8 |
4 Moderate; 1 High |
|
Very High |
5 |
27.80 ± 6.56 |
17.3-33.6 |
1 Low; 2 High; 2 Very High |
Exact agreement between FR susceptibility and LSL classification occurred at 13 of the 25 sites (52%). Cohen’s kappa was κ = 0.40 and linearly weighted kappa was κw = 0.61, indicating partial correspondence beyond chance. Eleven of the twelve discordant sites differed by one class, whereas one site differed by three classes. The Jonckheere-Terpstra test showed a significant ordered increase in LSL scores across increasing FR susceptibility classes (J = 231, p < 0.001).
These results characterize correspondence within the 25-site dataset and are not interpreted as validation of FR predictive accuracy. Because site selection was not probability-based, the statistical results are not generalized to the wider landslide population. The Very High susceptibility class showed the greatest internal variation, with LSL scores ranging from 17.3 to 33.6.
Within the Very Low susceptibility class, two landslides showed Very Low severity and three showed Low severity. All five landslides in the Low susceptibility class showed Low severity. Within the Moderate susceptibility class, two landslides showed Low severity and three showed Moderate severity. The High susceptibility class comprised one High-severity landslide and four Moderate-severity landslides. The Very High susceptibility class showed the greatest variation, comprising one Low-severity, two High-severity, and two Very High-severity landslides.
The classifications show partial correspondence between FR susceptibility and LSL severity. Sites in the Low susceptibility class showed complete class agreement, whereas the Moderate and High classes contained sites with lower LSL classifications. The Very High susceptibility class showed the greatest internal variation, ranging from Low to Very High severity. The kappa values quantify this correspondence within the 25-site dataset and do not constitute independent validation of either classification.
The observed divergence is consistent with the conceptual distinction between susceptibility and severity. Susceptibility represents the spatial predisposition of terrain to landslide occurrence, whereas the LSL scores summarize site-level characteristics rated through the Proforma framework. The dataset does not contain the underlying sub-parameter values, so this analysis cannot determine which geological, geomorphological, hydrological, land-use, or mechanical components produced the LSL score at an individual site.
The Jonckheere-Terpstra result shows a clear ordered pattern in the 25-site dataset, with higher LSL scores generally occurring in higher FR susceptibility classes. This relationship characterizes the 25-site dataset; it is not generalized to the wider landslide population because the site-selection procedure is not documented as probability-based and the original LSL component data are not part of the dataset. The within-class variation, especially in the Very High class, further shows that the FR class cannot be used to infer an individual site's LSL severity and that LSL scores should not be used as a validation measure of FR predictive accuracy.
Differences between susceptibility and LSL severity may reflect local slope geometry, material properties, weathering, drainage, vegetation, engineering conditions, or timing of observation. These mechanisms are not tested because the dataset does not contain the site-specific Proforma component matrices, temporal records, or geotechnical source records required for causal analysis.
One site within the Very High susceptibility class has a Low LSL severity classification. The dataset does not support attribution of this divergence to mitigation, local material conditions, or any other specific cause; no causal conclusion is drawn.
The comparison indicates that regional FR susceptibility and site-level LSL scores provide complementary screening information. Concordant records show alignment between regional susceptibility and site-level severity, whereas discordant records identify sites for targeted field verification or geotechnical follow-up. Future applications should use a dataset that preserves the original Proforma inputs, geotechnical source records, verified site coordinates, and documented sampling procedure.
4.1 Study scope and limitations
This study uses a balanced 25-site dataset with five sites from each FR susceptibility class. No documented probability-based site-selection procedure accompanies these records; therefore, the results characterize this dataset and are not generalized to the natural landslide population within the mapped area.
The dataset contains the final LSL scores and classes, but not the site-specific LHI Proforma sub-parameter scores or S1–S7 component matrices. The project files contain no record explaining the absence of these source records. Because multiple combinations of component scores can produce the same final LSL total, worked scoring examples and summary statistics cannot be reconstructed without inventing data. Consequently, this study does not audit the internal arithmetic of the original site-level LSL totals.
Project documentation states that some soil- and rock-mechanical ratings were supported by laboratory and geotechnical information, but the files provided for this study do not contain the report titles, borehole details, sample identifiers, or site-by-site source records. Their reliability and representativeness therefore cannot be independently assessed. Appendix Table A1 provides a separate 25-record inventory with approximate coordinates and descriptive landslide attributes. The files contain no verified crosswalk linking those inventory rows to L1–L25, which prevents site-level spatial matching.
The agreement and trend analyses quantify patterns within the 25-site dataset. They do not validate the FR model, verify the original LSL calculations, or establish causality. A fully reproducible follow-up study should preserve and report the original Proforma inputs, S1–S7 matrices, geotechnical source records, verified site crosswalk, and documented sampling procedure.
This preliminary comparison compared FR landslide susceptibility classes with previously calculated Proforma-based LSL scores for twenty-five landslide records along the Pekan Nabalu-Kundasang corridor. The analysis used the FR classes, final LSL scores and classes, and locality information recorded for these sites. It did not recalculate the original Proforma component scores.
Within the 25-site dataset, two sites were classified as Very Low LSL severity, eleven as Low, seven as Moderate, three as High, and two as Very High. The Very Low FR class contained two Very Low- and three Low-severity sites; the Low class contained five Low-severity sites; the Moderate class contained two Low- and three Moderate-severity sites; the High class contained four Moderate- and one High-severity site; and the Very High class contained one Low-, two High-, and two Very High-severity sites.
Exact class agreement occurred at 13 of 25 sites (52%), with Cohen's kappa of 0.40 and linearly weighted kappa of 0.61. LSL scores also showed a significant ordered increase across FR classes (Jonckheere-Terpstra J = 231, p < 0.001). These results demonstrate partial correspondence and an ordered relationship within the 25-site dataset. They do not independently verify the original LSL calculations or validate FR predictive accuracy.
The comparison supports preliminary screening by distinguishing sites where regional susceptibility and site-level severity are concordant from sites where they diverge. The study does not verify the original LSL arithmetic or serve as an independent validation of the FR model because the original Proforma score matrices, detailed geotechnical source records, and verified site crosswalk are not part of the dataset. Future work should use fully documented source data and a reproducible sampling procedure.
The authors gratefully acknowledge Universiti Malaysia Sabah for providing facilities and support for the fieldwork and laboratory analyses. This study was supported by the Skim Dana Khas (SDK), Universiti Malaysia Sabah (Grant No. SDK-0120).
Table A1. Landslide inventory (25 records)
|
Record No. |
Approx. Latitude (°N) |
Approx. Longitude (°E) |
Landslide Type |
Activity Status |
Origin |
|
1 |
6.003 |
116.528 |
Slide |
Active |
Natural |
|
2 |
6.000 |
116.528 |
Flow |
Active |
Natural |
|
3 |
5.999 |
116.528 |
Creep |
Active |
Natural |
|
4 |
6.003 |
116.529 |
Creep |
Active |
Natural |
|
5 |
5.994 |
116.551 |
Slide |
Active |
Natural |
|
6 |
5.993 |
116.554 |
Slide |
Active |
Natural |
|
7 |
5.982 |
116.560 |
Slide |
Active |
Natural |
|
8 |
5.991 |
116.577 |
Slide |
Active |
Natural |
|
9 |
6.014 |
116.599 |
Slide |
Active |
Natural |
|
10 |
6.022 |
116.604 |
Creep |
Active |
Natural |
|
11 |
6.015 |
116.602 |
Slide |
Active |
Natural |
|
12 |
5.970 |
116.576 |
Slide |
Active |
Natural |
|
13 |
6.020 |
116.496 |
Slide |
Inactive |
Anthropogenic |
|
14 |
6.018 |
116.500 |
Slide |
Inactive |
Anthropogenic |
|
15 |
6.020 |
116.502 |
Slide |
Active |
Natural |
|
16 |
6.020 |
116.503 |
Slide |
Inactive |
Anthropogenic |
|
17 |
6.015 |
116.513 |
Flow |
Active |
Natural |
|
18 |
6.010 |
116.516 |
Slide |
Active |
Anthropogenic |
|
19 |
6.007 |
116.522 |
Slide |
Active |
Anthropogenic |
|
20 |
6.003 |
116.529 |
Slide |
Inactive |
Anthropogenic |
|
21 |
5.977 |
116.579 |
Slide |
Inactive |
Anthropogenic |
|
22 |
5.978 |
116.579 |
Creep |
Inactive |
Natural |
|
23 |
5.979 |
116.577 |
Creep |
Active |
Natural |
|
24 |
5.980 |
116.578 |
Slide |
Inactive |
Natural |
|
25 |
5.978 |
116.581 |
Slide |
Inactive |
Natural |
[1] Komoo, I., Lim, C.S. (2003). Kompleks gelinciran tanah kundasang: Pemetaan terperinci di kawasan sekolah menengah kebangsaan Kundasang (kundasang landslide complex: Detailed mapping in the Kundasang National Secondary School area). Geological Society of Malaysia, 46: 387-392. https://doi.org/10.7186/bgsm46200362
[2] Sharir, K., Adnan, A.A., Soo, E.Z.X. (2026). Structural Lineament Orientation Patterns in Eastern Sabah Derived from Sentinel-1 SAR Data. Sains Malaysiana, 55(7): 1119-1131. https://doi.org/10.17576/jsm-2026-5507-02
[3] Roslee, R. (2015). Pembangunan model pengurusan risiko gelinciran tanah: Kajian kes dari Kota Kinabalu, Sabah, Malaysia. PhD Thesis, Institute for Environment and Development (LESTARI), Universiti Kebangsaan Malaysia, Bangi, Malaysia. Pusat Sumber Lestari, TP00050. https://www.ukm.my/lestari/wp-content/uploads/2020/07/Data-tesis-lestari-Sarjana-dan-Phd-Pusat-Sumber.pdf.
[4] Soo, E.Z.X., Chin, R.J., Koo, C.H., Tan, O.K., Lew, Y.L., Sharir, K., Sulaiman, M.F. (2026). Spatial modelling of soil erosion and sediment vulnerability in a tropical basin: Integrating RUSLE with GIS and remote sensing. Earth Systems and Environment, 10: 10769-10783. https://doi.org/10.1007/s41748-026-01191-7
[5] Collenette, P. (1958). The geology and mineral resources of Jesselton-Kinabalu area, North Borneo. British Borneo Geological Survey Memoir, 6.
[6] Krishnan, R.B., Sharir, K., Baba, M.F., et al. (2025). Landslide susceptibility mapping using weights of evidence model: A case study from Pekan Nabalu to Kundasang, Sabah, Malaysia. International Journal of Design and Nature and Ecodynamics, 20(5): 1029-1036. https://doi.org/10.18280/ijdne.200508
[7] Dos, J.P., Roslee, R., Sharir, K., Warnana, D.D. (2024). Quantitative landslide hazard assessment using frequency ratio model: A case study from SMK Kundasang, Sabah, Malaysia. International Journal of Design and Nature and Ecodynamics, 19(3): 1007-1018. https://doi.org/10.18280/ijdne.190330
[8] Sharir, K., Roslee, R., Ern, L.K., Simon, N. (2017). Landslide factors and susceptibility mapping on natural and artificial slopes in Kundasang, Sabah. Sains Malaysiana, 46(9): 1531-1540. https://doi.org/10.17576/jsm-2017-4609-23
[9] Shahabi, H., Hashim, M. (2015). Landslide susceptibility mapping using GIS-based statistical models and remote sensing data in tropical environment. Scientific Reports, 5: 9899. https://doi.org/10.1038/srep09899
[10] Sharir, K., Lai, G.T., Simon, N., et al. (2022). Debris flow susceptibility analysis using a bivariate statistical analysis in the Panataran River, Kg Melangkap, Sabah, Malaysia. IOP Conference Series: Earth and Environmental Science, 1103(1): 012038. https://doi.org/10.1088/1755-1315/1103/1/012038
[11] Angillieri, M.Y.E. (2020). Debris flow susceptibility mapping using frequency ratio and seed cells, in a portion of a mountain international route, Dry Central Andes of Argentina. Catena, 189: 104504. https://doi.org/10.1016/j.catena.2020.104504
[12] Corominas, J., van Westen, C., Frattini, P., et al. (2014). Recommendations for the quantitative analysis of landslide risk. Bulletin of Engineering Geology and the Environment, 73: 209-263. https://doi.org/10.1007/s10064-013-0538-8
[13] Fell, R., Corominas, J., Bonnard, C., et al. (2008). Guidelines for landslide susceptibility, hazard and risk zoning for land use planning. Engineering Geology, 102(3-4): 85-98. https://doi.org/10.1016/j.enggeo.2008.03.022
[14] Corominas, J., Guzzetti, F., Lan, H.X., et al. (2023). Revisiting landslide risk terms: IAEG commission C-37 working group on landslide risk nomenclature. Bulletin of Engineering Geology and the Environment, 82: 450. https://doi.org/10.1007/s10064-023-03474-z
[15] Oliveira, S.C., Zêzere, J.L., Garcia, R.A.C., Pereira, S., Vaz, T., Melo, R. (2024). Landslide susceptibility assessment using different rainfall event-based landslide inventories: Advantages and limitations. Natural Hazards, 120: 9361-9399. https://doi.org/10.1007/s11069-024-06691-1
[16] Feizizadeh, B., Blaschke, T. (2014). An uncertainty and sensitivity analysis approach for GIS-based multicriteria landslide susceptibility mapping. International Journal of Geographical Information Science, 28(3): 610-638. https://doi.org/10.1080/13658816.2013.869821
[17] Sameen, M.I., Pradhan, B., Bui, D.T., Alamri, A.M. (2020). Systematic sample subdividing strategy for training landslide susceptibility models. Catena, 187: 104358. https://doi.org/10.1016/j.catena.2019.104358
[18] Dou, J., Yunus, A.P., Merghadi, A., et al. (2020). Different sampling strategies for predicting landslide susceptibilities are deemed less consequential with deep learning. Science of the Total Environment, 720: 137320. https://doi.org/10.1016/j.scitotenv.2020.137320
[19] Lima, P., Steger, S., Glade, T., Murillo-García, F.G. (2022). Literature review and bibliometric analysis on data-driven assessment of landslide susceptibility. Journal of Mountain Science, 19: 1670-1698. https://doi.org/10.1007/s11629-021-7254-9
[20] Loche, M., Alvioli, M., Marchesini, I., Bakka, H., Lombardo, L. (2022). Landslide susceptibility maps of Italy: Lesson learnt from dealing with multiple landslide types and the uneven spatial distribution of the national inventory. Earth-Science Reviews, 232: 104125. https://doi.org/10.1016/j.earscirev.2022.104125