Asaad K. Abdullah* | Sajid H. Essa
© 2026 The authors. This article is published by IIETA and is licensed under the CC BY 4.0 license (http://creativecommons.org/licenses/by/4.0/).
OPEN ACCESS
Salinity is a significant abiotic stress that impairs wheat plant performance and grain yield by disrupting ion balance and causing oxidative damage. This study examined how brassinolide (BR) and jasmonic acid (JA), applied individually or together, improve wheat's ability to withstand salt stress. The experiment followed a randomized complete block design (RCBD) with two salinity (S) conditions (0 and 100 mM NaCl), three (BR) levels (0, 5, and 10 µg L⁻¹), and three (JA) levels (0, 50, and 100 µg L⁻¹). Salt stress increased the activity of antioxidant enzymes and proline content (PRO) while negatively affecting yield-related traits. Spraying plants with BR and JA helped counteract these adverse effects by boosting antioxidant defenses and improving yield performance. The most beneficial results were observed with the combination of 10 µg L⁻¹ BR and 100 µg L⁻¹ JA, which maximized the activity of catalase (CAT), peroxidase (POD), and superoxide dismutase (SOD), enzymes while reducing PRO, improving grain yield and its components, and enhancing salt tolerance indicators: Mean Tolerance Index (TOL), Productivity (MP), Geometric Mean Productivity (GMP), Harmonic Mean (HM), Stress Tolerance Index (STI), Yield Index (YI), Yield Stability Index (YSI) and lowering Stress Susceptibility Index (SSI). Overall, the results indicate that applying BR and JA together demonstrated the possibility of mitigating the negative effects of salinity under greenhouse experimental conditions.
salinity stress, brassinolide, jasmonic acid, proline, antioxidant enzymes, salt tolerance indicators
Salinity is a major abiotic stress factor that significantly restricts the growth and yield of wheat (Triticum aestivum L.) globally, particularly in arid and semi-arid areas. The buildup of salt in the root environment lowers osmotic potential and disrupts ion balance primarily due to excessive accumulation of Na+ and Cl− ions [1, 2]. Salinization is one of the most critical issues that affect the sustainability of agriculture and food security, especially in dryland areas. Various factors, such as natural salinity and anthropogenic factors such as increased water demand, inadequate irrigation and drainage practices, are correlated with increased salinity. This can be further aggravated by climate change and growing drought. With recent estimates showing salt-affected land occupies over 1.38 billion hectares globally, it is evident that there is an urgent need to find sustainable management solutions for salt-affected environments and improve the tolerance of crops to salinity. It is a very crucial problem with regard to wheat being the staple food crop of the world, as it affects water and ionic balance, oxidative stress and growth and productivity. Improved agricultural and physiological practices to increase salt tolerance, breeding programs and soil and water management are therefore becoming of particular importance to increase the resilience of agricultural production in the context of climate change, in order to develop safe products and practices [1, 3, 4]. Additionally, it triggers oxidative stress by promoting the overproduction of reactive oxygen species (ROS), which leads to damage in cell membranes, proteins, nucleic acids and chlorophyll, thereby negatively affecting vegetative growth, photosynthetic efficiency, yield components and grain productivity [5-7]. Recent research indicates that wheat's ability to tolerate salt stress arises from a complex interplay of physiological, biochemical, and molecular mechanisms. These include hormonal signaling, activation of antioxidant defenses, and the regulation of stress-responsive genes, all of which are critical for coping with salinity, though plant growth still tends to be negatively affected [8-10]. To counteract oxidative stress, plants rely on a protective antioxidant system composed of key enzymes such as catalase (CAT), peroxidase (POD), superoxide dismutase (SOD), and ascorbate peroxidase (APX) alongside non-enzymatic compounds like proline, ascorbic acid and glutathione. This system helps neutralize ROS, maintaining cellular redox balance and protecting membranes and organelles from damage under saline conditions [11, 12]. In recent years, plant hormones such as brassinolide (BR) and jasmonic acid (JA) have gained growing recognition for their role in improving plant resilience to environmental stresses, including salinity. BR increases the efficiency of the antioxidant system, improves photosynthesis and maintains the integrity of cell membranes, while JA regulates stress-related signaling pathways and stimulates the activation of antioxidant defenses [13]. Recent evidence suggests that the regulatory interaction between BR and JA activates integrated signaling networks that stimulate the removal of free radicals and improve plant physiological and productive performance under stress conditions [14, 15]. Despite significant progress in understanding the individual effects of BR and JA, most recent research has examined the effects of these two hormones individually or under different types of stress. Research on the interaction of BR and JA in saline wheat remains limited and studies linking this interaction to proline accumulation and yield components are scarce. Furthermore, information on their positive or antagonistic relationships and their overall combined effect on wheat productivity is still limited and warrants further investigation. This study aimed to evaluate the individual and interactive effects of BR and jasmonate (JA) on antioxidant enzyme activities (CAT, POD, and SOD), proline levels, yield-associated characteristics, and salt tolerance indicators in wheat grown under saline conditions.
2.1 Experimental location
The experiment was conducted in the greenhouse of the Department of Biological Sciences, College of Education for Pure Sciences Ibn Al-Haitham, University of Baghdad, Iraq, throughout the 2025–2026 growing season. All plants were cultivated under uniform environmental conditions, with a temperature of 25 ± 2 ℃ and relative humidity ranging from 60% to 70%, exposed to natural daylight throughout their growth period.
2.2 Plant material, seed sterilization and germination
Wheat seeds of the Ibaa 99 variety, selected for uniformity and absence of mechanical damage or disease, were used in the experiment. To eliminate surface contaminants, the seeds were first washed with distilled water and then treated with a sodium hypochlorite NaOCl solution for 10 minutes to achieve surface sterilization. Afterward, they were rinsed several times with distilled water to remove any remaining disinfectant. A portion of the seeds received this sterilization treatment, while another portion did not. Sterilized seeds were incubated in moistened Petri dishes under controlled conditions for 3 to 4 days to obtain uniform germination. Then seedlings that were uniform in growth were selected for use in the experiment. The selected seedlings were transplanted into 25 cm diameter plastic pots comprising soil, loam and peat moss in the required proportions. They were prepared in a ratio of 2:1:1 vol% respectively. After a period of 21 days, the plants were maintained in a greenhouse until the experimental treatment was applied.
2.3 Salt stress treatment
Salt stress was induced after the vegetative stage by applying sodium chloride (NaCl) solutions to the plants in 2 concentrations: (0 mM) NaCl and (100 mM) NaCl. The symbols were S0 and S100.
2.4 Plant hormone treatments
Twenty-four hours after salt stress, the plants were sprayed foliarly with BR (0, 5, and 10 µg L⁻¹). The symbols were BR0, BR5 and BR10. Leaves were completely sprayed with and JA (0, 50, and 100 µg L⁻¹) and it was symbolized as (JA0, JA50 and JA100). Spraying was continued four times at 2-day intervals for 4 weeks. The hormonal treatments included eighteen formulations as follows (Table 1).
Table 1. Treatment combinations in the 2 × 3 × 3 factorial design
|
No. |
Sample |
|
1 |
BR0,JA0,S0 |
|
2 |
BR5,JA0,S0 |
|
3 |
BR10,JA0,S0 |
|
4 |
BR0,JA0,S100 |
|
5 |
BR5,JA0,S100 |
|
6 |
BR10,JA0,S100 |
|
7 |
BR0,JA50,S0 |
|
8 |
BR5,JA50,S0 |
|
9 |
BR10,JA50,S0 |
|
10 |
BR0,JA50,S100 |
|
11 |
BR5,JA50,S100 |
|
12 |
BR10,JA50,S100 |
|
13 |
BR0,JA100,S0 |
|
14 |
BR5,JA100,S0 |
|
15 |
BR10,JA100,S0 |
|
16 |
BR0,JA100,S100 |
|
17 |
BR5,JA100, S100 |
|
18 |
BR10,JA100,S100 |
2.5 Experimental layout
The study used a randomized complete block design (RCBD) with three experimental factors: two salinity concentrations (0 and 100 mM NaCl), three concentrations of BR, and three concentrations of JA (2S × 3BR × 3JA), resulting in 18 treatments. The treatments were replicated three times, yielding 54 experimental units; each pot served as an experimental unit and contained four plants. Biochemical measurements were carried out at the pot level as per the experimental unit tested.
2.6 The antioxidant enzyme activity was analyzed
The leaves from the four plants in each pot were collected and immediately mixed to form a single composite sample, representing one biological replicate per pot. Thus, the number of independent biological replicates per treatment was n = 3 according to the method described by Ahmad et al. [16].
In the first step, the enzymatic extract was prepared by adding 5 mL of 50 mM potassium phosphate buffer (pH 7.2) containing 1% polyvinylpyrrolidone (PVP) and 0.1 mM EDTA to 1 g of fresh leaf tissue from each composite sample. The buffer was used to prevent the oxidation of phenolic compounds. Tender leaves from each treatment were ground in a chilled ceramic mortar. The extract was then filtered and centrifuged at 12,000 rpm for 20 min at 4 ℃, and the resulting supernatant was used directly for the enzyme assays.
SOD activity was measured according to Giannopolitis and Ries [17], based on the enzyme’s ability to inhibit the photochemical reduction of nitro blue tetrazolium (NBT). CAT activity was determined following the method of Aebi [18], which measures the rate of hydrogen peroxide (H₂O₂) breakdown. POD activity was evaluated using the method of Chance and Maehly [19], with guaiacol as the substrate.
2.7 Total soluble protein
The concentration of total soluble protein (TSP) in the enzyme extract was assessed using the method described by Bradford [20].
2.8 Proline content estimation
To assess proline content (PRO), fresh leaf tissue was analyzed following the procedure of Bates et al. [21].
2.9 Yield component estimation
Plants were harvested at full physiological maturity and air-dried in each experimental unit. The yield components were then estimated as follows: number of grains per spike (GPS, grains spike⁻¹), total number of spikelets per spike (SPS, spikelets spike⁻¹), 1000-grain weight (g), biological yield (BY), and spike length including awns (SL, cm).
2.10 Salt tolerance indices
The salt tolerance of wheat plants was evaluated using a set of widely recognized indices based on the treatment mean grain weight per plant (GWP) obtained under both non-saline (Yp) and saline (Ys) conditions. The assessment included the Tolerance Index (TOL), Mean Productivity (MP), Geometric Mean Productivity (GMP), Harmonic Mean (HM), Stress Tolerance Index (STI), Yield Index (YI), Yield Stability Index (YSI), and Stress Susceptibility Index (SSI). The indices calculated were not used for statistical inference as they were descriptive comparisons between treatments and were not considered independent biological replicates. All index values were computed following established procedures as explained by Hoseini et al. [22].
2.11 Statistical analysis
The experimental data were statistically analyzed. We used IBM SPSS Statistics (Version 28) and R software (Version 4.3.2). Descriptive statistics were expressed as Mean and Standard error (SE) values. For significant differences, the Least Significant Difference (LSD) test was applied for pairwise comparisons among treatments at a significance level of P ≤ 0.05 and P ≤ 0.01.
3.1 Combined analysis of variance
The analysis of variance for the factorial experiment, designed as an RCBD with three replications, is given in Table 2. All antioxidants and yield-related traits studied were significant (P ≤ 0.01) for the main effects of BR, JA, and salinity stress (S). Salinity stress yielded the highest mean squares for all measured wheat physiological and agronomic attributes among all of the experimental factors, indicating that it had the largest mean square among the sources of variation for these traits.
Salinity stress had significant effects on antioxidant traits CAT, POD, SOD, and proline accumulation; mean squares were 4128.54, 5864.32, 17294.61, and 40186.74, respectively. BR and JA also had a significant effect on all antioxidant parameters. Furthermore, for most biochemical variables, all of the interactions (BR × S), (BR × JA), (JA × S), and (BR × JA × S) were significant, meaning the positive effects of the growth regulators were dependent on the interactions between both types of growth regulators and salinity.
In the same way, the three principal factors significantly influenced all yield-related traits. Salinity stress explained the highest percentage of variance in GWP, BY, GPS, SL, SPS, and thousand grain weight (TGW). Further striking interaction effects showed that the wheat performance in response to BR and JA depended on salinity condition, and the combined application of both growth regulators improved the wheat performance under salt stress.
The effect of the blocks (replication) on all the traits studied was not significant, indicating low block-to-block variation and high uniformity of the experimental field. The coefficient of variation varied from 1.41% to 2.37%, which corresponds to good experimental precision and high reliability of the measurements obtained.
Table 2. Combined analysis of variance (mean squares) for antioxidants and yield-related traits of wheat plants as affected by brassinolide (BR), jasmonate (JA), salinity stress (S), and their interactions
|
Trait |
Block |
BR |
JA |
S |
BR × S |
BR × JA |
JA × S |
BR × JA × S |
Error |
CV (%) |
|
df |
2 |
2 |
2 |
1 |
2 |
4 |
2 |
4 |
34 |
|
|
CAT |
0.91 ns |
152.61 ** |
214.84 ** |
4128.54 ** |
31.42 ** |
18.27 ** |
42.85 ** |
11.36 * |
0.361 |
2.03 |
|
POD |
1.46 ns |
298.42 ** |
558.16 ** |
5864.32 ** |
46.85 ** |
33.58 ** |
97.61 ** |
28.74 ** |
0.742 |
2.18 |
|
SOD |
2.08 ns |
486.73 ** |
638.22 ** |
17294.61 ** |
82.33 ** |
246.91 ** |
211.74 ** |
41.55 ** |
1.287 |
1.82 |
|
PRO |
2.84 ns |
118.52 ** |
165.71 ** |
40186.74 ** |
276.84 ** |
48.62 ** |
338.27 ** |
79.86 ** |
1.962 |
2.11 |
|
GWP |
0.011 ns |
0.71 ** |
1.26 ** |
56.87 ** |
0.18 ** |
0.12 ** |
0.23 ** |
0.07 * |
0.009 |
2.37 |
|
BY |
0.042 ns |
14.88 ** |
21.74 ** |
358.42 ** |
1.54 ** |
2.87 ** |
2.16 ** |
0.84 * |
0.036 |
1.79 |
|
GPS |
0.031 ns |
5.46 ** |
12.81 ** |
241.67 ** |
1.08 ** |
0.91 ** |
4.83 ** |
1.21 ** |
0.024 |
1.48 |
|
SL |
0.056 ns |
7.95 ** |
10.84 ** |
438.95 ** |
1.62 ** |
0.84 ** |
3.61 ** |
0.98 * |
0.047 |
1.63 |
|
SPS |
0.049 ns |
18.47 ** |
36.28 ** |
457.33 ** |
2.15 ** |
2.76 ** |
4.12 ** |
1.52 ** |
0.041 |
1.41 |
|
TGW |
0.773 ns |
121.56 ** |
149.81 ** |
2678.41 ** |
15.82 ** |
10.43 ** |
18.64 ** |
7.84 ** |
0.887 |
1.66 |
In general, the findings revealed that BR and JA were effective in reducing the negative impacts of salinity stress. Most antioxidants and yield traits showed significant interactions between these growth regulators, indicating that the use of these growth regulators together has a greater effect on the improvement of salt tolerance than the use of either one or the other alone.
3.2 Enzymatic antioxidants and proline content
The results showed that exposing wheat plants to salinity stress at (100 mM NaCl) led to a significant increase in the activity of all antioxidant defense enzymes compared to the non- saline control. The activity of the enzymes CAT, POD, SOD and PRO increased in the treatment (BR0,JA0,S100) by 161.4%, 115.2%, 83.5% and 198.5%, respectively, compared to the control treatment (BR0,JA0,S0) (Table 3). Spraying with BR10 under saline conditions significantly enhanced antioxidant defense enzymes activities compared with the salinity treatment without hormones (BR0,JA0,S100). CAT, POD and SOD activities increased by 13.4%, 31.1%, and 46.3%, respectively, while proline decreased by 8.0%. JA also showed a positive effect in increasing antioxidant enzyme activities under saline conditions, particularly in treatment (JA100), recording the highest rates for CAT, POD, and SOD at 13.6%, 38.4%, and 47.0%, respectively, compared to salinity treatment only, while proline decreased by 11.5%. The interaction between BR and JA in the presence of salinity is the best treatment, as treatment (BR10,JA100,S100) recorded the highest values for CAT, POD, and SOD enzymes, with an increase of 29.3%, 51.9%, and 51.1%, respectively, while the value of proline decreased, giving a decrease of 20.7%.
Table 3. Effect of brassinolide (BR), jasmonate (JA), and salinity stress (S) on antioxidant defense enzymes and proline content (PRO)
|
No. |
Sample |
CAT (Mean ± SE) U mg Protein-1 |
POD (Mean ± SE) U mg Protein-1 |
SOD (Mean ± SE) U mg Protein-1 |
PRO (Mean ± SE) µg g-1 FW |
|
1 |
BR0,JA0,S0 |
12.32 ± 0.18 h |
17.34 ± 0.27 k |
29.317 ± 0.38 l |
33.23 ± 0.49 i |
|
2 |
BR5,JA0,S0 |
15.61 ± 0.23 g |
23.58 ± 0.35 j |
43.172 ± 0.46 j |
35.32 ± 0.52 hi |
|
3 |
BR10,JA0,S0 |
17.21 ± 0.24 fg |
25.67 ± 0.37 i |
44.979 ± 0.48 ij |
36.89 ± 0.54 gh |
|
4 |
BR0,JA0,S100 |
32.20 ± 0.36 d |
37.32 ± 0.49 g |
53.815 ± 0.61 h |
99.21 ± 1.14 a |
|
5 |
BR5,JA0,S100 |
33.73 ± 0.37 cd |
39.89 ± 0.52 f |
73.694 ± 0.77 g |
95.54 ± 1.09 b |
|
6 |
BR10,JA0,S100 |
36.51 ± 0.40 b |
48.92 ± 0.59 c |
78.714 ± 0.83 de |
91.32 ± 1.02 c |
|
7 |
BR0,JA50,S0 |
16.10 ± 0.23 g |
26.74 ± 0.38 i |
35.341 ± 0.43 k |
35.79 ± 0.51 hi |
|
8 |
BR5,JA50,S0 |
18.32 ± 0.25 f |
30.21 ± 0.43 h |
37.951 ± 0.45 k |
35.12 ± 0.49 hi |
|
9 |
BR10,JA50,S0 |
23.86 ± 0.31 e |
38.10 ± 0.48 g |
39.558 ± 0.47 k |
34.76 ± 0.46 hi |
|
10 |
BR0,JA50,S100 |
35.21 ± 0.39 bc |
46.47 ± 0.56 d |
77.911 ± 0.81 de |
94.63 ± 1.07 b |
|
11 |
BR5,JA50,S100 |
35.89 ± 0.39 bc |
48.78 ± 0.58 c |
78.112 ± 0.82 cde |
88.79 ± 0.96 d |
|
12 |
BR10,JA50,S100 |
37.71 ± 0.41 b |
49.52 ± 0.61 c |
79.710 ± 0.84 bc |
83.86 ± 0.91 e |
|
13 |
BR0,JA100,S0 |
18.52 ± 0.26 f |
27.71 ± 0.39 i |
45.180 ± 0.51 ij |
36.32 ± 0.54 gh |
|
14 |
BR5,JA100,S0 |
24.10 ± 0.32 e |
30.10 ± 0.44 h |
46.385 ± 0.53 i |
37.84 ± 0.57 fg |
|
15 |
BR10,JA100,S0 |
27.21 ± 0.34 de |
34.11 ± 0.46 g |
49.196 ± 0.56 i |
38.23 ± 0.59 f |
|
16 |
BR0,JA100,S100 |
36.57 ± 0.40 b |
51.63 ± 0.63 b |
79.116 ± 0.83 bcd |
87.79 ± 0.94 d |
|
17 |
BR5,JA100,S100 |
38.31 ± 0.42 ab |
53.42 ± 0.65 ab |
79.317 ± 0.84 bcd |
84.69 ± 0.92 e |
|
18 |
BR10,JA100,S100 |
41.63 ± 0.45 a |
56.71 ± 0.69 a |
81.325 ± 0.87 a |
78.64 ± 0.85 f |
|
LSD (0.01) |
2.15** |
3.08** |
4.72** |
6.54** |
|
|
P-value |
P ≤ 0.001 |
P ≤ 0.001 |
P ≤ 0.001 |
P ≤ 0.001 |
|
3.3 Yield component traits
Salinity stress (100 mM NaCl) significantly reduced all measured yield components compared with the non-saline control. GWP, BY, number of GPS, SL, number of SPS and TGW decreased by 48.2%, 42.1%, 42.2%, 33.7%, 40.0% and 19.5%, respectively (Table 4). Application of BR10 significantly improved all yield traits under salinity stress compared with untreated saline (BR0,JA0,S100) GWP, BY, GPS, SL, SPS and TGW increased by 16.7%, 12.2%, 12.2%, 9.83%, 11.1% and 12.23%, respectively. Foliar JA100 also improved yield performance under NaCl. Relative to the untreated saline treatment GWP, BY, GPS, SL, SPS and TGW increased by 20.5%, 17.7%, 19.2%, 9.51%, 14.5% and 21.83%, respectively. The best results were obtained when BR, JA and salinity were combined (BR10,JA100,S100). This indicates a combined effect between the two hormones in mitigating salinity damage.
Table 4. Effect of brassinolide (BR), jasmonate (JA), and salinity stress (S) on yield component traits
|
No. |
Sample |
GWP (Mean ± SE) |
BY (Mean ± SE) |
GPS (Mean ± SE) |
SL (Mean ± SE) |
SPS (Mean ± SE) |
TGW (Mean ± SE) |
|
1 |
BR0,JA0,S0 |
4.15 ± 0.03 g |
11.41 ± 0.09 f |
11.17 ± 0.07 f |
14.26 ± 0.11 f |
14.46 ± 0.10 g |
57.38 ± 0.50 g |
|
2 |
BR5,JA0,S0 |
4.27 ± 0.04 fg |
11.92 ± 0.10 ef |
11.23 ± 0.08 ef |
14.69 ± 0.13 ef |
14.79 ± 0.11 fg |
59.74 ± 0.53 f |
|
3 |
BR10,JA0,S0 |
4.35 ± 0.05 f |
12.16 ± 0.11 e |
11.39 ± 0.09 e |
15.42 ± 0.14 e |
15.15 ± 0.12 f |
63.84 ± 0.59 d |
|
4 |
BR0,JA0,S100 |
2.15 ± 0.03 n |
6.62 ± 0.07 l |
6.46 ± 0.06 k |
9.46 ± 0.08 k |
8.68 ± 0.06 l |
46.21 ± 0.43 l |
|
5 |
BR5,JA0,S100 |
2.28 ± 0.04 mn |
6.72 ± 0.07 l |
6.59 ± 0.06 k |
9.75 ± 0.09 jk |
9.09 ± 0.08 k |
47.84 ± 0.45 k |
|
6 |
BR10,JA0,S100 |
2.51 ± 0.05 l |
7.43 ± 0.09 k |
7.25 ± 0.07 j |
10.39 ± 0.10 i |
9.64 ± 0.09 j |
49.25 ± 0.47 j |
|
7 |
BR0,JA50,S0 |
4.33 ± 0.05 f |
11.87 ± 0.10 ef |
11.28 ± 0.08 ef |
14.87 ± 0.12 ef |
15.33 ± 0.11 f |
59.67 ± 0.55 f |
|
8 |
BR5,JA50,S0 |
4.54 ± 0.06 de |
12.30 ± 0.12 de |
11.46 ± 0.09 e |
15.42 ± 0.13 e |
16.29 ± 0.14 e |
63.98 ± 0.61 d |
|
9 |
BR10,JA50,S0 |
4.64 ± 0.06 cd |
13.80 ± 0.14 c |
12.44 ± 0.11 c |
16.37 ± 0.17 c |
17.01 ± 0.16 d |
65.67 ± 0.65 c |
|
10 |
BR0,JA50,S100 |
2.32 ± 0.04 m |
6.68 ± 0.07 l |
7.18 ± 0.06 j |
9.82 ± 0.09 j |
9.58 ± 0.08 j |
47.35 ± 0.45 kl |
|
11 |
BR5,JA50,S100 |
2.78 ± 0.05 j |
7.58 ± 0.08 k |
7.31 ± 0.07 j |
10.49 ± 0.10 i |
11.29 ± 0.10 i |
50.21 ± 0.48 i |
|
12 |
BR10,JA50,S100 |
2.92 ± 0.06 i |
8.86 ± 0.10 i |
7.58 ± 0.08 i |
10.64 ± 0.11 hi |
12.38 ± 0.11 h |
51.23 ± 0.50 h |
|
13 |
BR0,JA100,S0 |
4.60 ± 0.07 cd |
12.60 ± 0.13 d |
11.90 ± 0.10 d |
16.28 ± 0.15 c |
16.89 ± 0.14 d |
64.47 ± 0.63 d |
|
14 |
BR5,JA100,S0 |
4.71 ± 0.07 bc |
14.26 ± 0.15 b |
12.05 ± 0.10 d |
16.57 ± 0.17 bc |
17.78 ± 0.17 c |
66.33 ± 0.68 bc |
|
15 |
BR10,JA100,S0 |
4.87 ± 0.08 a |
14.86 ± 0.17 a |
12.27 ± 0.12 cd |
17.61 ± 0.19 a |
18.28 ± 0.18 a |
68.47 ± 0.70 a |
|
16 |
BR0,JA100,S100 |
2.59 ± 0.05 k |
7.79 ± 0.09 j |
7.87 ± 0.08 h |
10.36 ± 0.10 i |
10.24 ± 0.09 j |
48.97 ± 0.48 j |
|
17 |
BR5,JA100, S100 |
2.85 ± 0.05 ij |
8.84 ± 0.10 i |
8.96 ± 0.09 g |
10.50 ± 0.11 i |
11.89 ± 0.10 h |
51.89 ± 0.52 h |
|
18 |
BR10,JA100,S100 |
2.96 ± 0.06 h |
9.76 ± 0.11 h |
10.04 ± 0.10 g |
10.70 ± 0.12 h |
12.98 ± 0.12 h |
53.25 ± 0.54 g |
|
LSD (0.01) |
0.23 |
0.78 |
0.52 |
0.61 |
0.74 |
2.34 |
|
|
P-value |
P ≤ 0.001 |
P ≤ 0.001 |
P ≤ 0.001 |
P ≤ 0.001 |
P ≤ 0.001 |
P ≤ 0.0001 |
|
3.4 Salt tolerance indices
Under saline conditions, there were distinct differences in salt tolerance indices among the BR and JA treatments (Table 5). TOL values ranged from 1.72 to 2.01 with BR10,JA50 showing the lowest value, representing the lowest absolute decrease in grain yield between salinity and non-salinity conditions. MP, GMP, and HM had relatively higher values under the combined BR and JA treatments, especially the BR10,JA50 and BR10,JA100 treatments, indicating relatively high productivity for these treatments under salinity conditions. The values of YSI ranged from 0.518 to 0.629, and the best value was obtained under BR10,JA50, suggesting a higher proportion of grain yield under salinity. Likewise, the treatment BR10,JA100 gave the highest YI (1.140) and STI (0.818), indicating that this treatment had a relatively high yield of grain under stress as compared to the mean for the stressed treatments. The SSI values were generally lower for the BR5,JA50; BR10,JA50 and BR5,JA100 treatments compared with the untreated treatment, thus showing lower relative susceptibility in terms of this index.
Table 5. Salt tolerance indices of wheat plants under different brassinolide (BR) and jasmonic acid (JA) Treatments
|
Salt Tolerance Indices |
Treatment |
||||||||
|
BR0,JA0 |
BR5,JA0 |
BR10,JA0 |
BR0,JA50 |
BR5,JA50 |
BR10,JA50 |
BR0,JA100 |
BR5,JA100 |
BR10,JA100 |
|
|
YP |
4.15 |
4.27 |
4.35 |
4.33 |
4.54 |
4.64 |
4.60 |
4.71 |
4.87 |
|
YS |
2.15 |
2.28 |
2.51 |
2.32 |
2.78 |
2.92 |
2.59 |
2.85 |
2.96 |
|
TOL |
2.00 |
1.99 |
1.84 |
2.01 |
1.76 |
1.72 |
2.01 |
1.86 |
1.91 |
|
MP |
3.15 |
3.28 |
3.43 |
3.33 |
3.66 |
3.78 |
3.60 |
3.78 |
3.92 |
|
GMP |
2.99 |
3.12 |
3.30 |
3.17 |
3.55 |
3.68 |
3.45 |
3.66 |
3.80 |
|
HM |
2.83 |
2.97 |
3.18 |
3.02 |
3.45 |
3.58 |
3.32 |
3.56 |
3.70 |
|
YSI |
0.518 |
0.534 |
0.577 |
0.536 |
0.612 |
0.629 |
0.563 |
0.605 |
0.608 |
|
YI |
0.828 |
0.878 |
0.967 |
0.894 |
1.071 |
1.125 |
0.998 |
1.098 |
1.140 |
|
STI |
0.442 |
0.481 |
0.540 |
0.497 |
0.682 |
0.751 |
0.661 |
0.745 |
0.818 |
|
SSI |
1.141 |
1.102 |
1.001 |
1.098 |
0.918 |
0.878 |
1.034 |
0.934 |
0.927 |
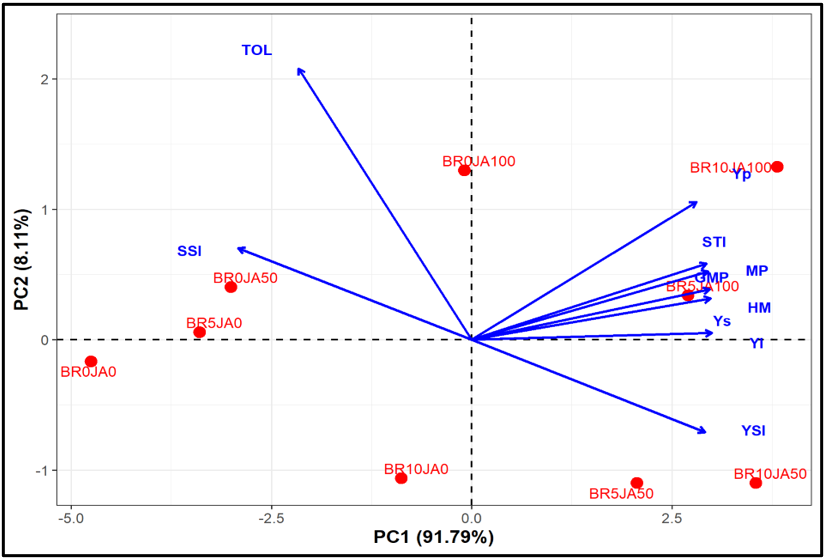
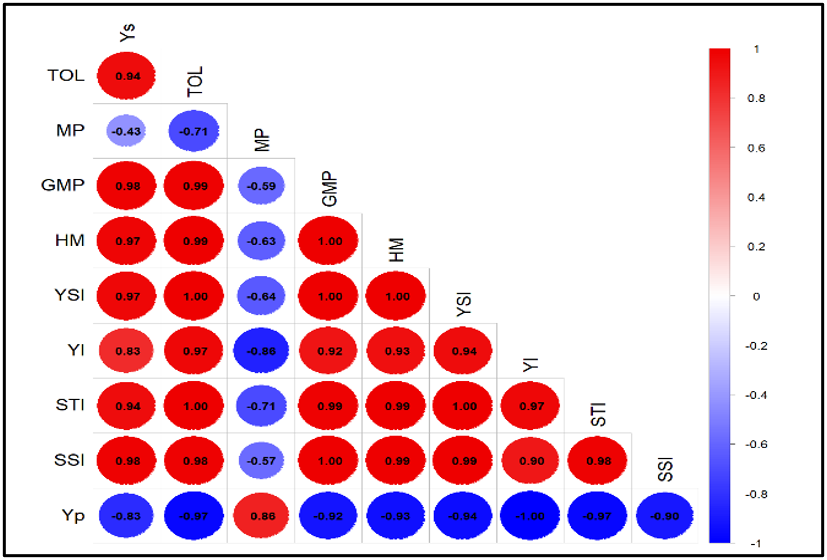
The Principal Component Analysis (PCA) plot shows a strong positive correlation between the MP, GMP, HM, STI, YI, and YS indices (Figure 1(a)). This is evident from the convergence of arrow directions, indicating that these indices measure a similar characteristic: the ability to maintain productivity under saline conditions. In contrast, the SSI and TOL indices move in the opposite direction, reflecting their negative correlation with productivity. This suggests that higher values for these two indices indicate increased susceptibility to salt stress. Several salt-tolerance and productivity-related indices showed high positive correlation with each other in Pearson correlation analysis (Figure 1(b)). In general, GMP had a strong positive correlation with the HM, YSI, YI and STI values, suggesting that these indices were closely related to the ability of the treatments to sustain and/or enhance grain yield under saline conditions. The high positive correlation between GMP and HM (r = 1.00) and between YSI and STI (r = 1.00) for the treatments tested implies that these indices measured closely related aspects of yield performance and stability. Several indices were also highly and positively correlated with both TOL and SSI, such as GMP, HM, YSI and STI. But the relations between these indices should be interpreted with reference to the biological meaning of each index. The higher the TOL, the higher the yield loss under saline conditions, so a high TOL should not be regarded as an increase in salt tolerance. The same applies to SSI, in that a higher value is indicative of greater stress susceptibility and generally implies increased susceptibility. Therefore, the positive relationships of TOL and SSI with some productivity indices may be partly due to the mathematical interdependence of these productivity indices and yield under non-stress and stress conditions. MP was, however, negatively correlated with TOL (r = -0.71), SSI (r = -0.57), and some other indices. MP reflects the average productivity under both non-saline and saline conditions, while TOL and SSI indicate yield loss or sensitivity to salinity. Therefore, these negative associations suggest that the treatments with relatively constant productivity tended to have lower yield-loss or susceptibility measures.
3.5 Principal Component Analysis and heatmap of enzymatic antioxidants and proline content
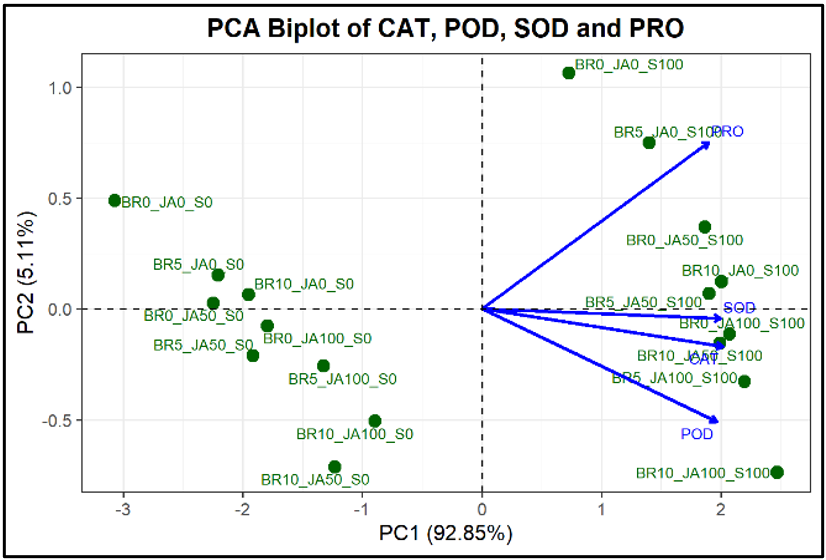
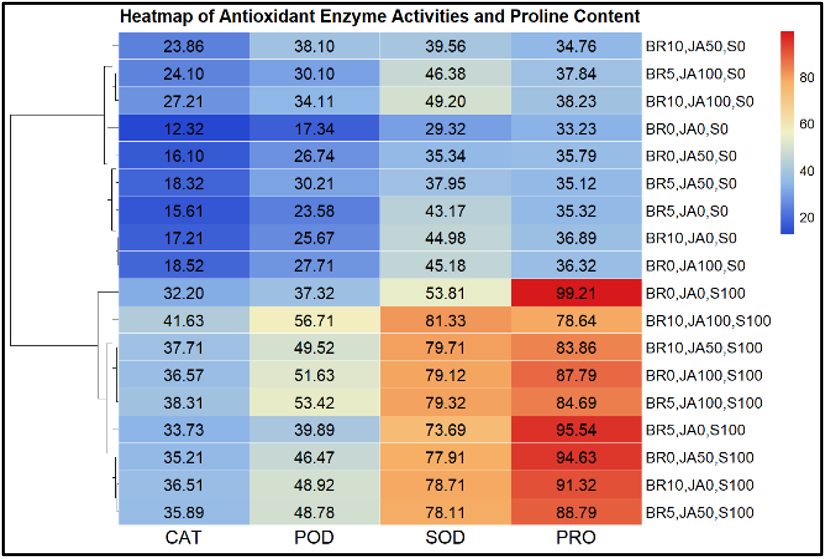
Table 6 shows the results of the PCA major component analysis for antioxidant enzyme activity (CAT, POD, SOD) and PRO content. All variables that loaded positively onto PC1 had very similar loads (0.512, 0.506, 0.495, and 0.486), respectively, suggesting that PC1 can be regarded as a general antioxidant defense axis and a marker for the strength of the plant's defensive response. For component PC2, there is a clear contrast, since PRO exhibits a high positive load (0.682), and the SOD enzyme exhibits a high negative load (-0.602). This means that there is an inverse relationship between them, whereas the POD and CAT enzymes had weak positive loads of 0.371 and 0.194, respectively. PCA showed that principal component 1 (PC1) explained 92.85% of the total variance, while principal component 2 (PC2) explained 5.11%, bringing the total explained variance to 97.96% (Figure 2(a)). This shows the clustering of salinity coefficients treated with BR and JA on the positive side of the first axis near the CAT, POD, SOD, and PRO vectors, indicating that the external application of these two hormones enhanced the antioxidant defense system and increased proline accumulation. Both SOD and CAT exhibited similar orientations and small angles, indicating a strong correlation between their activity. Similarly, the direction of the POD vector was close to that of the CAT and SOD vectors. However, PRO moved in almost the same direction as the enzyme vectors. In contrast, the comparative coefficients for the absence of added salt were concentrated on the negative side of the first axis and far from the enzyme and proline vectors reflecting a decrease in antioxidant activity due to the absence of oxidative stress. The non-salinity treatments (S0) were grouped together on the negative side of PC1 and the salinity treatments (S100) were grouped together on the positive side of PC1. This means the multivariate variability of the studied traits was predominantly due to salinity. In addition, the BR and JA treatments under S100 stress were distributed differently in the PCA component, indicating the difference in the integrated pattern of antioxidant response and osmotic adaptation between the two different hormonal treatments. The heatmap (Figure 2(b)) shows a clear difference in the activity of CAT, POD and SOD enzymes as well as PRO content between the different treatments. The treatments not exposed to salt showed relatively low values for most traits reflected in blue, while the treatments exposed to salt tended towards orange and red, indicating increased enzyme and proline activity in response to salt stress.
Figure 2. (a) Principal Component Analysis (PCA) biplot showing the relationships among CAT, POD, SOD, and PRO and the distribution of treatment combinations under different levels of JA, Br, and NaCl; (b) heatmap of catalase (CAT), peroxidase (POD), superoxide dismutase (SOD), and proline content (PRO) across wheat treatments under different experimental conditions
Table 6. Eigenvalues, variance explained, and loadings of antioxidant defense parameters on the first two principal components
|
Parameter |
PC1 |
PC2 |
|
Eigenvalue |
3.62 |
0.28 |
|
Variance explained (%) |
90.50 |
7.00 |
|
Cumulative variance (%) |
90.50 |
97.50 |
|
CAT |
0.512 |
0.194 |
|
POD |
0.506 |
0.371 |
|
SOD |
0.495 |
-0.602 |
|
PRO |
0.486 |
0.682 |
3.6 Principal Component Analysis and heatmap of yield component traits
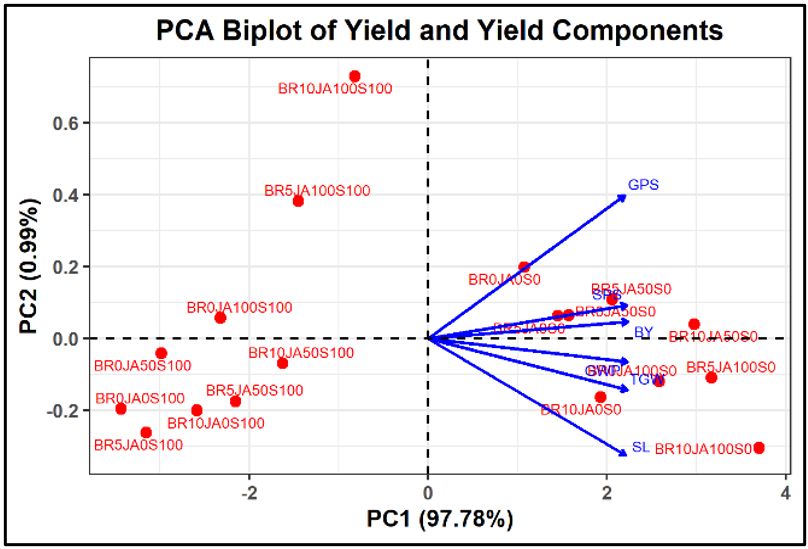
As indicated in Table 7, all the examined component attributes have positive and high load values on component PC1 ranging from 0.392 to 0.432. PC1 was a measure of productivity and growth since all traits were positively and strongly correlated, and BY and GWP were the two most important traits in this PC. But there was definite variation for component PC2. All seed number traits had positive loads on SPS (0.559), SL (0.481), and GPS (0.364), respectively, and the grain weight and yield traits had negative loads on GWP (-0.245), BY (-0.112), and TGW (-0.497), respectively. PCA showed that the first principal component (PC1) explained 97.78% of the total variance, while the second principal component (PC2) explained only 0.99%, bringing the total explained variance to 98.77% (Figure 3(a)). This high percentage indicates that the studied traits–GWP, BY, number of GPS, SL, spikes per spike, and TGW were sufficient to characterize the wheat plants' response to salinity and the effects of spraying with BR and JA, thus confirming the effectiveness of these traits in assessing salt stress.
Table 7. Eigenvalues, variance explained, and trait loadings of the first two principal components for growth and yield traits of wheat plants
|
Parameter |
PC1 |
PC2 |
|
Eigenvalue |
5.45 |
0.34 |
|
Variance Explained (%) |
90.8 |
5.7 |
|
Cumulative Variance (%) |
90.8 |
96.5 |
|
GWP |
0.421 |
-0.245 |
|
BY |
0.432 |
-0.112 |
|
GPS |
0.418 |
0.364 |
|
SL |
0.417 |
0.481 |
|
SPS |
0.416 |
0.559 |
|
TGW |
0.392 |
-0.497 |
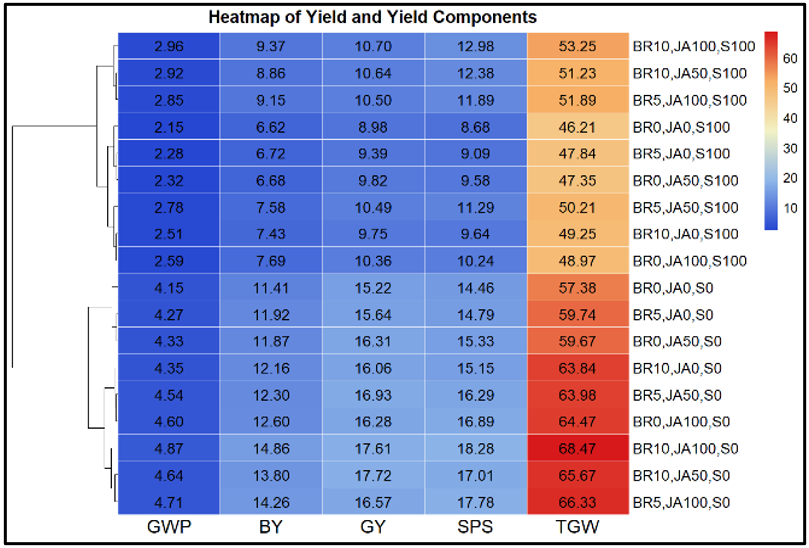
The graph showed that all the vectors of the product components were directed towards the positive side of the first axis, indicating positive correlations between most of the productivity traits, and the convergence of the vectors of these traits indicates a strong correlation between them. In contrast, the salinity coefficients for the non-hormone-treated plants were concentrated on the negative side of the first axis and far from the vectors of productive traits, indicating that salinity led to a clear decrease in yield components. It is also noted that SL and TGW were traits positively correlated with the first axis. In general, PCA analysis confirms that the combined application of BR and JA improved most yield components by enhancing positive relationships between productive traits and reducing the negative effects of salt stress. The heatmap (Figure 3(b)) illustrates a clear contrast in yield characteristics and components between the treatments for BR, JA, and salinity. The treatments without salt stress showed the highest values for most yield characteristics, while most characteristics decreased significantly under salt stress, as reflected by the cool colors in the figure. Treatments BR and JA under 100 NaCl improved most productive traits compared to the salinity treatment alone, as the values of GWP, BY, GPS, SL, SPS, and TGW increased. The figure shows that GWP was the trait that responded most to the treatments, while GPS and SPS also showed a positive response to spraying.
Figure 3. (a) Principal Component Analysis (PCA) showing the contribution of grain yield and yield-related traits under different JA, Br, and NaCl treatments; (b) heatmap of grain weight per pot (GWP), biological yield (BY), grains per spike (GPS), spike length (SL), spikelets per spike (SPS), and thousand grain weight (TGW) under different treatments
3.7 Discussion
Salinity stress markedly enhanced CAT, POD, and SOD activities together with proline accumulation, reflecting activation of the antioxidant defense system in response to excessive ROS. These findings agree with Farooq et al. [23] and Huang et al. [24], who reported similar increases in antioxidant enzyme activity and proline accumulation in wheat under saline conditions. BR application further enhanced antioxidant enzyme activities while reducing proline accumulation under salinity, indicating mitigation of stress severity, in agreement with Hassan et al. [25]. JA also promoted CAT, POD and SOD activities while lowering PRO, confirming its role in strengthening antioxidant defense under salt stress. A decrease in proline accumulation after the use of BR and JA may reflect a decrease in stress intensity; however, a decrease in proline alone cannot be considered conclusive evidence of increased salt tolerance. Similar responses have been reported by Zhu et al. [26] and Alam et al. [27]. The combined application of BR and JA produced the strongest response, indicating an enhanced interaction between the two hormones. These findings are consistent with recent studies by Nie et al. [28] and Tian et al. [29], which demonstrated that the interaction between BR and JA activates multiple stress-response pathways and enhances salt tolerance more effectively than either hormone alone.
Salt stress caused a significant decrease in grain weight, BY, number of GPS, SL, number of spikes and TGW of wheat, which shows that wheat is highly sensitive to salinity. These reductions are primarily linked to limited production and grain filling [30-32], which showed that salinity negatively affects wheat yield significantly depending on the intensity of the stress and the wheat cultivar. BR significantly improved yield components under saline conditions, showing its ability to overcome the growth inhibition caused by saline stress. This is due to an improvement in photosynthetic activity, better nutrient utilization, maintenance of membrane stability, and increased partitioning of assimilates to reproductive organs. The results are in conformity with Sharma et al. [33], who found that BR promoted more grain number and TGW under saline conditions. All yield-related traits were also improved by JA under salt stress. This improvement is probably linked to increased antioxidant activity, decreased oxidative damage and maintenance of metabolic activity throughout the grain development stage. Gao et al. [34] and Islam et al. [35] also noted the enhancement of wheat productivity under saline conditions by JA and BR, and that when applied with JA gave the highest increase in all the yield components, indicating a combined effect between the two hormones. This additive response seems to enhance physiological adaptation to salinity, which leads to a better physiological response in terms of maintaining plant growth and grain production than when the hormones were applied individually. This is similar to the result reported by Guo et al. [36], where BR and JA interact with each other in a hormone-crosstalk mechanism that promotes the productivity of crops under abiotic stress.
The improvement in salt tolerance indices following the application of BR and JA confirms the ability of plant hormones to enhance wheat's adaptation to salinity conditions. The increased values of MP, GMP, HM, YI, and STI, and the decreased SSI, indicate that both hormones contributed to mitigating the adverse effects of salt stress—an effect attributed to their role in enhancing antioxidant enzyme activity, which positively influenced plant growth under saline conditions [37]. This was further supported by researchers [25, 38] who demonstrated that plant growth regulators promote stress resistance and ensure wheat productivity under saline conditions.
PCA analysis and heat mapping confirmed the strong positive correlation between SOD, CAT, and POD enzymes and proline under stress, as well as the positive correlation between all crop traits, supporting the combined effect of the two hormones in improving salt tolerance and sustaining productivity. Similar relationships have been reported by Wang et al. [13], Ghosh et al. [39], and Abd and Abdullah [40].
This study was conducted under greenhouse conditions using a single wheat cultivar (Ibaa 99) and a single salinity concentration (100 mmol NaCl). Salinity stress induced clear physiological changes in the plants, including a significant increase in the activities of the antioxidant enzymes CAT, POD, and SOD and in proline accumulation, together with a significant decrease in most yield components and productivity indicators. Treatment with BR or JA alone proved capable of improving wheat plant response to salt stress by enhancing the efficiency of the antioxidant defense system, reducing oxidative damage, and improving yield components compared to salinity treatment alone. Furthermore, the decrease in PRO in hormone-treated plants under saline conditions indicated reduced stress intensity and improved plant physiology. The combined treatment of BR and JA, particularly at the highest concentrations used, showed the best results in improving enzyme activity, raising salt tolerance indices, and increasing most yield components, indicating the role of hormonal combination in enhancing wheat plants' tolerance to salt stress. Therefore, it can be concluded that foliar spraying with BR and JA represents a promising and beneficial effect for mitigating the negative effects of salinity and improving the physiological and productive performance of wheat plants. Further validation with several cultivars and under varying salinity and field or multi-environment experiments is also stressed.
The authors wish to express their sincere thanks and appreciation to the Advanced Plant Physiology Laboratory, Department of Biology, College of Education for Pure Sciences (Ibn Al-Haitham), University of Baghdad, Iraq, for providing all the laboratory facilities and technical support for completing this research. Thanks are also due to the assistance of the laboratory staff.
[1] AbuQamar, S.F., El-Saadony, M.T., Saad, A.M., et al. (2024). Halotolerant plant growth-promoting rhizobacteria improve soil fertility and plant salinity tolerance for sustainable agriculture—A review. Plant Stress, 12: 100482. https://doi.org/10.1016/j.stress.2024.100482
[2] Manhou, K., Hmouni, D., Moussadek, R., et al. (2026). Compost application enhances soil quality, growth, and yield of durum wheat under saline conditions. Scientific Reports, 16(1): 7643. https://doi.org/10.1038/s41598-026-36306-7
[3] FAO. (2024). Global status of salt-affected soils–Main report. https://doi.org/10.4060/cd3044en
[4] Jaafar, M.F., Abdullah, A.K. (2020). Impact of interaction between nano particles and bacterial and amino fertilizers on growth and yield of wheat plant. Plant Archive, 20(1): 2829-2835.
[5] Abdullah, A.K. (2019). The interaction effect of gamma ray and exogenous salicylic acid on antioxidant enzymes activity in safflower Carthamas tinctorius L. Biochemical & Cellular Archives, 19: 2229-2235. https://doi.org/10.35124/bca.2019.19.S1.2229
[6] Kesawat, M.S., Satheesh, N., Kherawat, B.S., et al. (2023). Regulation of reactive oxygen species during salt stress in plants and their crosstalk with other signaling molecules—Current perspectives and future directions. Plants, 12(4): 864. https://doi.org/10.3390/plants12040864
[7] Zhang, T., Jin, M., Ding, Y., et al. (2025). Research on the regulation mechanism of salt tolerance in wheat. Plant Stress, 19: 101172. https://doi.org/10.1016/j.stress.2025.101172
[8] Hmissi, M., García-Sánchez, F., Gimeno, V., Chaieb, M., Krouma, A. (2025). Physiological dissection of the genotypic differences in response of durum wheat (Triticum durum Desf.) to salinity stress. Russian Journal of Plant Physiology, 72(5): 157. https://doi.org/10.1134/s1021443725602538
[9] Teleb, A., Yassein, A., Serag, A. (2025). Impact of salinity stress on germination, growth, morphological traits, and genetic diversity in wheat (Triticum aestivum L.) genotypes. Labyrinth: Fayoum Journal of Science and Interdisciplinary Studies. https://doi.org/10.21608/ifjsis.2025.351429.1106
[10] Hmissi, M., Nsiri, K., Zagoub, R., et al. (2026). Salinity stress mitigation in durum wheat via seed hormonal priming. Plants, 15(7): 1103. https://doi.org/10.3390/plants15071103
[11] Hasanuzzaman, M., Bhuyan, M.B., Zulfiqar, F., et al. (2020). Reactive oxygen species and antioxidant defense in plants under abiotic stress: Revisiting the crucial role of a universal defense regulator. Antioxidants, 9(8): 681. https://doi.org/10.3390/antiox9080681
[12] Fahad, M.J., Abdullah, A.K. (2022). The relationship between sulphur dioxide and trehalose and their effect on some biochemical characteristics of tomato plants. Asian Journal of Water, Environment and Pollution, 19(4): 81-90. https://doi.org/10.3233/ajw220059
[13] Wang, C., Cui, H., Jin, M., et al. (2025). Enhancement of wheat resistance to dry–hot wind stress during grain filling by 24-epibrassinolide: Optimization of hormone balance and improvement of flag leaf photosynthetic performance. Frontiers in Plant Science, 16: 1552617. https://doi.org/10.3389/fpls.2025.1552617
[14] Liang, Z., Li, J., Feng, J., et al. (2025). Brassinosteroids improve the redox state of wheat florets under low-nitrogen stress and alleviate degeneration. Journal of Integrative Agriculture, 24(8): 2920-2939. https://doi.org/10.1016/j.jia.2024.03.035
[15] Majeed, W.H., Abdullah, A.K. (2025). Brassinolide and GABA synergistically upregulate iron-uptake genes in hydroponic wheat under iron deficiency. International Journal of Design & Nature and Ecodynamics, 20(11): 2581-2591. https://doi.org/10.18280/ijdne.201109
[16] Ahmad, S., Sharif, R., Feng, X., et al. (2026). Jasmonic acid and salicylic acid pretreatment differentially modulates photosynthesis-related transcription, redox homeostasis, and defense gene expression in mulberry against glyphodes pyloalis. Horticulturae, 12(9): 1136. https://doi.org/10.3390/horticulturae12091136
[17] Giannopolitis, C.N., Ries, S.K. (1977). Superoxide dismutases: I. Occurrence in higher plants. Plant Physiology, 59(2): 309-314. https://doi.org/10.1104/pp.59.2.309
[18] Aebi, H. (1984). [13] Catalase in vitro. In Methods in Enzymology, Academic Press, 105: 121-126. https://doi.org/10.1016/S0076-6879(84)05016-3
[19] Chance, B., Maehly, A.C. (1955). [136] Assay of catalases and peroxidases. In Methods in Enzymology, Academic Press, 2: 764-775. https://doi.org/10.1016/s0076-6879(55)02300-8
[20] Bradford, M.M. (1976). A rapid and sensitive method for the quantitation of microgram quantities of protein utilizing the principle of protein-dye binding. Analytical Biochemistry, 72(1-2): 248-254. https://doi.org/10.1016/0003-2697(76)90527-3
[21] Bates, L.S., Waldren, R.P.A., Teare, I.D. (1973). Rapid determination of free proline for water-stress studies. Plant and Soil, 39(1): 205-207. https://doi.org/10.1007/bf00018060
[22] Hoseini, M., Arzani, A., Saeidi, G., Araniti, F. (2024). Agro-physiological and DNA methylation responses to salinity stress in wheat (Triticum aestivum L.): Aegilops cylindrica host, and their introgressed lines. Plants, 13(19): 2673. https://doi.org/10.3390/plants13192673
[23] Farooq, M., Zahra, N., Ullah, A., et al. (2024). Salt stress in wheat: Effects, tolerance mechanisms, and management. Journal of Soil Science and Plant Nutrition, 24(4): 8151-8173. https://doi.org/10.1007/s42729-024-02104-1
[24] Huang, J.N., Wang, H.J., Ding, Y., et al. (2026). Integrative analysis of salt tolerance in wheat using multi-gradient phenotyping and molecular/physiological validation. Frontiers in Plant Science, 17: 1813443. https://doi.org/10.3389/fpls.2026.1813443
[25] Hassan, M.U., Guoqin, H., Nawaz, M., et al. (2025). The role of brassinosteroids in plant physiological and molecular responses to counter salt stress and ensure food security: A review and future perspectives. Turkish Journal of Agriculture and Forestry, 49(1): 1-23. https://doi.org/10.55730/1300-011x.3245
[26] Zhu, M., Liu, Y., Cai, P., Duan, X., Sang, S., Qiu, Z. (2022). Jasmonic acid pretreatment improves salt tolerance of wheat by regulating hormones biosynthesis and antioxidant capacity. Frontiers in Plant Science, 13: 968477. https://doi.org/10.3389/fpls.2022.968477
[27] Alam, P., Karabulut, F., Iqbal, J., et al. (2026). Role of jasmonic acid and salicylic acid in salinity stress mitigation in plants. Frontiers in Plant Science, 17: 1824082. https://doi.org/10.3389/fpls.2026.1824082
[28] Nie, R., Wu, C., Ji, X., et al. (2025). Methyl jasmonate orchestrates multi-pathway antioxidant defense to enhance salt stress tolerance in walnut (Juglans regia L.). Antioxidants, 14(8): 974. https://doi.org/10.3390/antiox14080974
[29] Tian, J., Sharma, P., Mao, W., et al. (2026). Brassinosteroids and jasmonic acid signaling: A molecular roadmap to abiotic stress resilience in crops. Plant Growth Regulation, 106(1): 1-54. https://doi.org/10.1007/s10725-026-01456-1
[30] Taybi, T., Alyahya, N. (2025). Comparative analysis of physiological and biochemical responses to salt stress reveals important mechanisms of salt tolerance in wheat. International Journal of Molecular Sciences, 26(8): 3742. https://doi.org/10.3390/ijms26083742
[31] Traye, I.D., Oli, N.M., Weng, X., et al. (2025). Salinity tolerance in wheat: Mechanisms and breeding approaches. Plants, 14(11): 1641. https://doi.org/10.3390/plants14111641
[32] Sleibi, A.T., Abdullah, A.K. (2025). Phenotypic, physiological and molecular changes of some wheat varieties under drought stress. Plant Science Today, 12(1): 1-10. https://doi.org/10.14719/pst.5593
[33] Sharma, A., Shahzad, B., Kumar, V., et al. (2019). Phytohormones regulate accumulation of osmolytes under abiotic stress. Biomolecules, 9(7): 285. https://doi.org/10.3390/biom9070285
[34] Gao, Y., Ma, X., Zhang, Z., Wang, X., Wang, Y. (2024). Brassinolides signaling pathway: Tandem response to plant hormones and regulation under various abiotic stresses. Horticulture Advances, 2(1): 27. https://doi.org/10.1007/s44281-024-00050-7
[35] Islam, M.M., Islam, S., Parvin, S., Haque, M.A. (2019). Mitigation of salt stress by foliar application of jasmonic acid in wheat. American Journal of Plant Biology, 4(1): 18-34.
[36] Guo, F., Lv, M., Zhang, J., Li, J. (2024). Crosstalk between brassinosteroids and other phytohormones during plant development and stress adaptation. Plant and Cell Physiology, 65(10): 1530-1543. https://doi.org/10.1093/pcp/pcae047
[37] Wang, X., Chai, J., Liu, W., Zhu, X., Liu, H., Wei, X. (2023). Promotion of Ca2+ accumulation in roots by exogenous Brassinosteroids as a key mechanism for their enhancement of plant salt tolerance: A meta-analysis and systematic review. International Journal of Molecular Sciences, 24(22): 16123. https://doi.org/10.3390/ijms242216123
[38] ur Rehman, S., Yang, J., Zhang, J., et al. (2025). Salt stress in wheat: A physiological and genetic perspective. Plant Stress, 16: 100832. https://doi.org/10.1016/j.stress.2025.100832
[39] Ghosh, T., Atta, K., Mondal, S., et al. (2025). Hormonal signaling at seed germination and seedling stage of plants under salinity stress. Plant Growth Regulation, 105(3): 583-600. https://doi.org/10.1007/s10725-025-01305-7
[40] Abd, S.F., Abdullah, A.K. (2020). Interaction effect of silicon and nitric oxide on the activity of enzyme and non-enzyme antioxidants on tomato plant exposed to cadmium stress. Biochemical & Cellular Archives, 20(1): 2473-2482. https://doi.org/10.35124/bca.2020.20.1.2473