Dung Nguyen Le Nguyen | Hien Thu Huynh* | Huong Minh Thi Nguyen
© 2026 The authors. This article is published by IIETA and is licensed under the CC BY 4.0 license (http://creativecommons.org/licenses/by/4.0/).
OPEN ACCESS
Foreign direct investment (FDI) remains central to regional development in emerging economies, but its sustainability contribution depends on the quality of the local investment environment. This study examines sustainability-oriented determinants of FDI intent in Quang Ngai Province, Vietnam, using interviews with 30 experts and survey data from 381 enterprise representatives. Here, sustainability-oriented refers to local conditions associated with long-term economic viability, administrative transparency, infrastructure readiness, workforce capacity, and public-service quality; the study does not directly measure realized environmental or social outcomes. The results reveal five significant predictors of investment intent (YDDT): investment attraction policies (CSTH; β = 0.377), local infrastructure (CSHT; β = 0.287), local human resources (NNL; β = 0.264), public services (DVC; β = 0.158), and new context (BCM; β = 0.099). Together, these variables explain 68.8% of the variance in FDI intent. CSTH are the strongest standardized predictor. The findings provide evidence on drivers of investment intention, not direct sustainability performance, and suggest that transparent governance, infrastructure upgrading, skilled labor, and efficient DVC can support higher-quality local investment attraction.
foreign direct investment, investment intent, local investment environment, sustainable development, Quang Ngai Province
Foreign direct investment (FDI) is widely recognized as a vital catalyst for economic transformation and sustainable development, particularly in developing economies striving to achieve inclusive and resilient growth [1-3]. Beyond its role in capital accumulation and technology transfer, FDI serves as a mechanism for industrial upgrading, employment generation, and cross-border innovation, thereby supporting the implementation of several United Nations Sustainable Development Goals (SDGs), including SDG 8 on Decent Work and Economic Growth, SDG 9 on Industry, Innovation and Infrastructure, and SDG 11 on Sustainable Cities and Communities. By integrating international capital with local resources, FDI contributes not only to economic efficiency but also to the structural transformation and sustainability of local economies.
For Vietnam, FDI has been a cornerstone of its transition from a centrally planned to a market-oriented economy, enhancing the nation’s competitiveness through global value chain integration and technological advancement [4, 5]. Over the past three decades, foreign investment has helped the country accelerate modernization and industrialization, generating substantial socio-economic benefits. In 2023 alone, Vietnam attracted USD 36.6 billion in FDI inflows—a 32.1 percent increase compared to the previous year—contributing approximately 8.51 percent of the national GDP [6]. The FDI sector has become an important driver of exports, budget revenues, and employment, thereby strengthening national resilience in the face of global economic fluctuations [7].
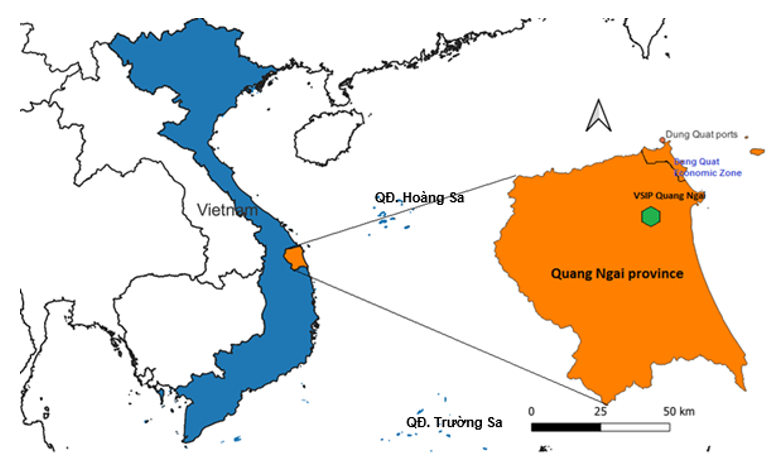
At the local level, the case of Quang Ngai Province (Figure 1) in Central Vietnam demonstrates how FDI can foster sustainable regional development. The province, home to the Dung Quat Economic Zone and Vietnam’s first oil refinery [8], has attracted 69 active FDI projects with total registered capital exceeding USD 2.1 billion [6]. These investments have stimulated industrial restructuring, improved infrastructure, and enhanced human capital formation, contributing to a more diversified and competitive economy. Yet, sustaining these gains requires careful attention to environmental stewardship, social inclusion, and transparent governance. In line with Vietnam’s National Green Growth Strategy (2021–2030), provincial governments are increasingly focusing on aligning investment attraction policies (CSTH) with sustainable development principles. This approach underscores that FDI should not only drive economic expansion but also support community well-being, ecological balance, and long-term institutional integrity—the three interdependent pillars of sustainability. Recent Vietnam-based studies further show that subnational FDI strategy and sustainable local governance require policy coordination, administrative transparency, and context-sensitive planning [9, 10].
Globally, the dynamics of FDI are being reshaped by rapid technological change, digital transformation, and evolving geopolitical tensions [11]. The Fourth Industrial Revolution (4IR) has accelerated the convergence of innovation, sustainability, and competitiveness, requiring host economies to adapt to new investment patterns that prioritize digitalization and low-carbon development [12]. At the same time, geopolitical events such as the U.S.–China trade war and the Russia–Ukraine conflict have prompted multinational corporations to diversify production bases and reconfigure global supply chains [13, 14]. For Vietnam, and particularly for provinces like Quang Ngai, these developments present both opportunities and challenges. Strategic advantages such as geographical location (VLDT), stable political conditions, and competitive labor costs make Quang Ngai a potential hub for sustainable investment. However, the province still faces limitations in digital infrastructure, energy efficiency, and high-tech industrial capacity. As the People’s Committee of Quang Ngai Province [15] emphasizes, attracting high-quality, environmentally friendly investment requires continued improvements in industrial policy, logistics systems, and environmental management frameworks. This interpretation is also consistent with recent evidence on Vietnam’s strategic adaptation to technological, geopolitical, and environmental challenges [16].
Understanding the determinants of FDI intent within this new context (BCM) is therefore essential for designing sustainable investment policies. By identifying the socio-economic, institutional, and contextual factors that shape investors’ decisions, local authorities can strengthen regional resilience and ensure that economic growth aligns with sustainability objectives. FDI attraction should not be viewed merely as a competition for capital inflows but as a strategic process to advance long-term development, environmental responsibility, and social welfare.
This study investigates the key determinants influencing FDI intent in Quang Ngai Province, focusing on how contextual dynamics, CSTH, infrastructure, local human resources (NNL), and public services (DVC) shape sustainable investment behavior. Employing a mixed-methods approach, the research integrates qualitative insights with quantitative analysis to provide a comprehensive understanding of FDI’s sustainable drivers at the local level. The study contributes to the literature by conceptualizing FDI intent as a mechanism for sustainable regional transformation rather than a purely economic phenomenon. It also provides empirical evidence to support the alignment of local investment strategies with Vietnam’s broader sustainable development agenda and the SDGs. Ultimately, the findings aim to assist policymakers in building adaptive, inclusive, and environmentally conscious investment frameworks that promote regional sustainability while enhancing competitiveness in a rapidly evolving global economy.
To avoid overstating the empirical scope of the study, sustainability is treated here as a policy orientation and interpretive framework rather than as a directly observed outcome variable. The dependent variable is investment intent (YDDT); therefore, the analysis evaluates which local factors are associated with investors’ willingness to invest in a sustainability-oriented provincial development context. Environmental and social outcomes of FDI projects are beyond the direct measurement scope of the current dataset and are identified as priorities for future research.
Vietnam’s economic transformation has been significantly driven by its open-door policy towards FDI [17, 18]. Numerous studies have examined the determinants and impacts of FDI in Vietnam, focusing on government policy, infrastructure development, trade openness, labor conditions, and economic reforms. Earlier evidence on Vietnam’s FDI shows that market size, labor availability, and infrastructure are important determinants of the spatial distribution of FDI across provinces [19]. This evidence reinforces the need to examine provincial-level conditions when assessing local YDDT.
Le and Pomfret [20] show that technology spillovers from FDI in Vietnam are not automatic. Their firm-level evidence indicates that domestic firms may benefit through vertical linkages with foreign firms, while horizontal foreign presence can have negative effects on domestic firm productivity. This suggests that Vietnam’s FDI benefits depend not only on attracting foreign capital but also on strengthening supplier linkages, absorptive capacity, and technology-transfer channels.
Recent provincial-level evidence further confirms that labor and infrastructure significantly affect the distribution of FDI across Vietnamese provinces [21]. This finding is relevant to Quang Ngai because the province has benefited from industrial-zone and infrastructure development but still faces challenges in competing with more developed localities for high-tech and higher-value investment. A directly related policy-evaluation study of Quang Ngai confirms that subnational FDI reform should combine policy transparency, infrastructure readiness, workforce upgrading, and responsiveness to global shifts [9].
2.1 Comparative foreign direct investment attraction in Southeast Asia
Southeast Asia has been a major destination for FDI, with countries like Singapore, Thailand, and Malaysia leading the way in attracting high-value investments [22, 23]. Comparative studies often highlight the differences in FDI strategies employed by these countries and Vietnam. In the Singapore case, evidence links FDI success to a supportive investment environment, regulatory efficiency, tax incentives, high-quality infrastructure, political stability, and active investment promotion [24]. These institutional conditions have helped Singapore remain an attractive destination for foreign investors and provide useful comparative lessons for Vietnam’s provincial-level investment strategies.
In contrast, countries like Thailand and Malaysia have focused on developing their manufacturing sectors, using FDI as a tool to diversify their economies [25, 26]. Thailand’s Eastern Economic Corridor (EEC) is a notable example of how government policies can successfully attract FDI into high-tech industries, such as robotics and digital technologies. Similarly, Malaysia has leveraged its well-developed infrastructure and skilled labor force to attract investments in electronics, biotechnology, and green energy [27].
Compared to its regional counterparts, Vietnam has focused primarily on labor-intensive industries, benefiting from its low labor costs. However, the OECD [28] argues that while this strategy has brought significant FDI inflows, it is not sustainable in the long term. As labor costs rise and the global economy shifts towards digitalization, Vietnam must move towards attracting more capital- and technology-intensive FDI to remain competitive in Southeast Asia. Quang Ngai, in particular, faces the challenge of improving its infrastructure and workforce skills to compete with more developed provinces and neighboring countries like Thailand and Malaysia.
2.2 Studies on foreign direct investment and economic development in emerging markets
The relationship between FDI and economic development in emerging markets has been the subject of extensive academic research. Studies in this area generally focus on how FDI contributes to economic growth, industrialization, and poverty reduction. According to Banh [29], FDI can play a catalytic role in the industrialization process of emerging economies by introducing new technologies, creating jobs, and enhancing productivity. This has been particularly true for Vietnam, where FDI has contributed significantly to the country’s rapid economic growth over the past two decades.
However, the benefits of FDI are not always evenly distributed. In many emerging markets, including Vietnam, FDI is often concentrated in certain sectors and regions, leading to uneven development. As Kim [30] demonstrates, while cities like Ho Chi Minh City and Hanoi have reaped significant benefits from FDI, rural and less developed provinces such as Quang Ngai have struggled to attract large-scale investments. This has led to a growing divide between the economic performance of urban and rural areas.
Moreover, the quality of FDI is crucial in determining its long-term impact on economic development. Studies by international organizations such as the World Bank [31] emphasize the importance of attracting “quality” FDI that promotes sustainable development, enhances environmental protection, and generates higher value-added production. Emerging markets like Vietnam must prioritize investments in green technologies and industries aligned with the global push towards sustainability. In this regard, Quang Ngai has the potential to attract FDI in sectors such as renewable energy, especially given its favorable VLDT for solar and wind power projects. Recent studies on Vietnam similarly show that provincial sustainability strategies increasingly integrate governance reform, digital capacity, environmental response, and social-welfare objectives, which supports the present study’s local-level sustainability framing [10, 32].
In sum, the literature on FDI attraction in Vietnam, comparative FDI strategies in Southeast Asia, and the relationship between FDI and economic development in emerging markets highlights both opportunities and challenges for regions like Quang Ngai. While FDI has been a significant driver of growth, adapting to new global trends and ensuring that FDI contributes to sustainable development will be key to maximizing its benefits in the future.
This framing is consistent with quality-FDI approaches that distinguish between attracting investment volume and attracting investment that supports productivity, decent employment, environmental management, and institutional upgrading. Accordingly, the present study narrows its claim from measuring sustainability outcomes to identifying local drivers that can support more sustainability-oriented investment attraction.
This study employed a mixed-methods design to investigate the determinants influencing FDI intent in Quang Ngai Province, Vietnam. The methodological approach integrated both qualitative and quantitative components to ensure a comprehensive understanding of the research problem and to validate findings through data triangulation.
The qualitative phase consisted of semi-structured interviews with 30 participants, including five senior officials from the Quang Ngai Department of Planning and Investment and 25 executives from foreign-invested enterprises. These interviews helped refine the conceptual framework and identify context-specific factors affecting investment decisions. A structured interview guide was used to ensure consistency, focusing on six thematic areas: infrastructure, policy environment, labor quality, DVC, geographic advantages, and global economic context.
For the quantitative phase, a structured questionnaire was designed based on insights from the qualitative interviews and prior literature. The survey employed a five-point Likert scale to measure perceptions of factors influencing YDDT. A stratified random sampling technique was used to select 400 representatives from FDI enterprises operating in the province. After excluding incomplete responses, a valid sample of 381 participants was obtained, covering diverse industries and company sizes.
The sampling frame consisted of enterprise representatives with direct knowledge of investment decisions or operational conditions in Quang Ngai. Responses were screened for completeness, consistency, and eligibility. Questionnaires with substantial missing responses, duplicated entries, or respondents outside the intended enterprise-representative profile were excluded. For retained questionnaires, item-level missing values were checked before scale construction; no imputation was used for incomplete questionnaires excluded during response filtering.
Data were analyzed using SPSS 26. Reliability of measurement scales was assessed using Cronbach’s Alpha, and exploratory factor analysis (EFA) was applied to identify latent constructs. Multiple linear regression was employed to determine the strength and significance of relationships between independent variables and YDDT. The model was validated using the Durbin-Watson statistic and multicollinearity diagnostics (variance inflation factor (VIF)).
Because all quantitative measures were collected from a single survey instrument at one point in time, common method bias was assessed using Harman’s single-factor diagnostic. The first unrotated factor explained 25.441% of the variance, which is below the commonly used 50% threshold, suggesting that a single general factor did not dominate the data. Additional robustness was evaluated through reliability refinement, factor-retention checks, Pearson correlation diagnostics, multicollinearity statistics, and model-fit diagnostics. As an additional sensitivity check, the final regression specification was interpreted after excluding the unreliable geographical-location construct and low-performing items identified during reliability refinement; the direction and statistical significance of the five retained predictors remained consistent with the bivariate correlation results, supporting the stability of the final model specification. These procedures do not eliminate all risks associated with cross-sectional self-reported data, but they reduce the likelihood that the main regression results are driven only by measurement artefacts.
All procedures adhered to ethical standards. Participants gave informed consent, and confidentiality was ensured. The research was approved by the Quang Ngai Department of Planning and Investment. The described methodology offers a transparent and replicable framework for analyzing FDI determinants in similar regional contexts.
4.1 Reliability analysis
The research model evaluates enterprises’ YDDT using six primary factor groups: CSHT, CSTH, NNL, VLDT, BCM, and DVC. To ensure the reliability of the measurement scales used in the study, two key methods were applied: Cronbach’s Alpha and factor analysis. Cronbach’s Alpha was initially used to identify and exclude variables that did not meet reliability standards. In this study, a measurement scale was considered reliable if it had a Cronbach’s Alpha coefficient of 0.6 or higher and an item-total correlation coefficient of 0.3 or higher.
Table 1. Reliability and item-total statistics for the local infrastructure (CSHT)
|
|
Cronbach’s Alpha |
N of Items |
||
|
|
0.796 |
5 |
||
|
Item |
Scale Mean if Item Deleted |
Scale Variance if Item Deleted |
Corrected Item-Total Correlation |
Cronbach’s Alpha if Item Deleted |
|
CSHT1 |
14.45 |
7.064 |
0.629 |
0.742 |
|
CSHT2 |
14.12 |
6.960 |
0.611 |
0.747 |
|
CSHT3 |
14.14 |
7.271 |
0.549 |
0.766 |
|
CSHT4 |
14.25 |
7.211 |
0.521 |
0.776 |
|
CSHT5 |
14.34 |
7.205 |
0.579 |
0.757 |
Results in Table 1 show that the Cronbach’s Alpha coefficient for the infrastructure scale is 0.796 (greater than 0.6), and the item-total correlation coefficients for all observed variables meet the required threshold (greater than 0.3). Thus, the infrastructure scale is accepted with five observed variables: convenient intra-provincial transport infrastructure, adequate intra-provincial electricity supply, convenient and adequate intra-provincial communication systems, sufficient intra-provincial water supply, and adequate intra-provincial drainage systems.
•CSTH
Results in Table 2 show that the Cronbach’s Alpha coefficient for the investment attraction policy scale is 0.808 (greater than 0.6), and the item-total correlation coefficients for all observed variables meet the required threshold (greater than 0.3). Thus, the investment attraction policy scale is accepted with four observed variables: the province has long-term strategies and directions for attracting FDI, transparent and synchronized investment policies without negative practices, credit incentives compared to other localities, and tax incentives compared to other localities.
Table 2. Reliability and item-total statistics for the investment attraction policy (CSTH)
|
|
Cronbach’s Alpha |
N of Items |
||
|
|
0.808 |
4 |
||
|
Item |
Scale Mean if Item Deleted |
Scale Variance if Item Deleted |
Corrected Item-Total Correlation |
Cronbach’s Alpha if Item Deleted |
|
CSTH1 |
10.69 |
4.788 |
0.593 |
0.773 |
|
CSTH2 |
10.52 |
4.503 |
0.628 |
0.758 |
|
CSTH3 |
11.09 |
4.736 |
0.630 |
0.756 |
|
CSTH4 |
10.92 |
4.685 |
0.646 |
0.749 |
•NNL
Results in Table 3 show that the Cronbach’s Alpha coefficient for the local human resource scale is 0.706 (greater than 0.6); however, the item-total correlation coefficient for variable NNL3 is 0.192, which is below the acceptable threshold (0.3). Therefore, this variable was excluded. After excluding NNL3, results in Table 4 show a Cronbach’s Alpha coefficient of 0.806 (greater than 0.6), and all item-total correlation coefficients meet the required threshold (greater than 0.3).
Table 3. Reliability and item-total statistics for the local human resource (NNL)
|
|
Cronbach’s Alpha |
N of Items |
||
|
|
0.706 |
4 |
||
|
Item |
Scale Mean if Item Deleted |
Scale Variance if Item Deleted |
Corrected Item-Total Correlation |
Cronbach’s Alpha if Item Deleted |
|
NNL1 |
10.77 |
3.874 |
0.611 |
0.564 |
|
NNL2 |
10.73 |
3.958 |
0.601 |
0.573 |
|
NNL3 |
11.22 |
5.313 |
0.192 |
0.806 |
|
NNL4 |
10.99 |
3.847 |
0.606 |
0.567 |
Table 4. Reliability and item-total statistics for the modified local human resource (NNL)
|
|
Cronbach’s Alpha |
N of Items |
||
|
|
0.806 |
3 |
||
|
Item |
Scale Mean if Item Deleted |
Scale Variance if Item Deleted |
Corrected Item-Total Correlation |
Cronbach’s Alpha if Item Deleted |
|
NNL1 |
7.41 |
2.559 |
0.666 |
0.722 |
|
NNL2 |
7.38 |
2.621 |
0.660 |
0.729 |
|
NNL4 |
7.64 |
2.590 |
0.635 |
0.754 |
Thus, the local human resource scale is accepted with three observed variables: abundant unskilled labor, disciplined labor force, and technically skilled managers and staff.
•VLDT
Results in Table 5 show that the Cronbach’s Alpha coefficient for the VLDT scale is 0.548 (less than 0.6), so the scale was not accepted. Consequently, this scale was excluded from the research, and no further analysis was conducted.
Table 5. Reliability and item-total statistics for the geographical location (VLDT)
|
|
Cronbach’s Alpha |
N of Items |
||
|
|
0.548 |
4 |
||
|
Item |
Scale Mean if Item Deleted |
Scale Variance if Item Deleted |
Corrected Item-Total Correlation |
Cronbach’s Alpha if Item Deleted |
|
VTDL1 |
10.59 |
4.422 |
0.345 |
0.466 |
|
VLDT2 |
10.46 |
4.534 |
0.326 |
0.482 |
|
VLDT3 |
10.49 |
4.545 |
0.307 |
0.498 |
|
VLDT4 |
10.64 |
4.353 |
0.353 |
0.459 |
•BCM
Results in Table 6 show that the Cronbach’s Alpha coefficient for the BCM scale is 0.660 (greater than 0.6); however, the item-total correlation coefficients for variables BCM1 (0.195), BCM3 (0.105), and BCM5 (0.209) are below the acceptable threshold (0.3). Thus, these variables were excluded. After excluding BCM1, BCM3, and BCM5, results in Table 7 show a Cronbach’s Alpha coefficient of 0.791 (greater than 0.6), and all item-total correlation coefficients meet the required threshold (greater than 0.3).
Table 6. Reliability and item-total statistics for the new context (BCM)
|
|
Cronbach’s Alpha |
N of Items |
||
|
|
0.660 |
7 |
||
|
Item |
Scale Mean if Item Deleted |
Scale Variance if Item Deleted |
Corrected Item-Total Correlation |
Cronbach’s Alpha if Item Deleted |
|
BCM1 |
21.45 |
10.901 |
0.195 |
0.675 |
|
BCM2 |
21.45 |
9.469 |
0.495 |
0.586 |
|
BCM3 |
21.49 |
11.472 |
0.105 |
0.698 |
|
BCM4 |
21.32 |
9.428 |
0.538 |
0.576 |
|
BCM5 |
21.21 |
10.796 |
0.209 |
0.671 |
|
BCM6 |
20.97 |
8.946 |
0.540 |
0.568 |
|
BCM7 |
21.55 |
9.243 |
0.581 |
0.563 |
Table 7. Reliability and item-total statistics for the modified new context (BCM)
|
|
Cronbach’s Alpha |
N of Items |
||
|
|
0.791 |
4 |
||
|
Item |
Scale Mean if Item Deleted |
Scale Variance if Item Deleted |
Corrected Item-Total Correlation |
Cronbach’s Alpha if Item Deleted |
|
BCM2 |
10.88 |
4.662 |
0.577 |
0.751 |
|
BCM4 |
10.75 |
4.821 |
0.566 |
0.756 |
|
BCM6 |
10.40 |
4.356 |
0.595 |
0.744 |
|
BCM7 |
10.98 |
4.521 |
0.670 |
0.706 |
The BCM scale is accepted with four observed variables: a young and abundant labor force, a thriving private sector with increasing incomes, recognition of FDI as a crucial economic sector by the government, and minimal impact from climate change or natural disasters.
•DVC
Results in Table 8 show that the Cronbach’s Alpha coefficient is 0.729 (greater than 0.6); however, the item-total correlation coefficient for variable DVC4 is 0.155, below the acceptable threshold (0.3). Thus, this variable was excluded. After excluding DVC4, results in Table 9 show a Cronbach’s Alpha coefficient of 0.853 (greater than 0.6), and all item-total correlation coefficients meet the required threshold (greater than 0.3).
Table 8. Reliability and item-total statistics for the public service (DVC)
|
|
Cronbach’s Alpha |
N of Items |
||
|
|
0.729 |
4 |
||
|
Item |
Scale Mean if Item Deleted |
Scale Variance if Item Deleted |
Corrected Item-Total Correlation |
Cronbach’s Alpha if Item Deleted |
|
DVC1 |
11.24 |
4.532 |
0.646 |
0.592 |
|
DVC2 |
10.90 |
4.416 |
0.672 |
0.575 |
|
DVC3 |
10.87 |
4.232 |
0.673 |
0.569 |
|
DVC4 |
10.99 |
6.374 |
0.155 |
0.853 |
Table 9. Reliability and item-total statistics for the modified public service (DVC)
|
|
Cronbach’s Alpha |
N of Items |
||
|
|
0.853 |
3 |
||
|
Item |
Scale Mean if Item Deleted |
Scale Variance if Item Deleted |
Corrected Item-Total Correlation |
Cronbach’s Alpha if Item Deleted |
|
DVC1 |
7.57 |
3.125 |
0.721 |
0.799 |
|
DVC2 |
7.22 |
3.074 |
0.728 |
0.791 |
|
DVC3 |
7.19 |
2.922 |
0.726 |
0.795 |
The DVC scale is accepted with three observed variables: simple and efficient administrative procedures, supportive provincial authorities, and effective investment promotion centers.
•YDDT
Results in Table 10 show that the Cronbach’s Alpha coefficient is 0.871 (greater than 0.6), and all item-total correlation coefficients for the observed variables meet the required threshold (greater than 0.3). Thus, the YDDT scale (DDT) is accepted with four observed variables: businesses’ satisfaction with investment in Quang Ngai, intentions to continue investing in Quang Ngai, potential growth in Quang Ngai, and the province’s ability to attract more businesses in the future.
After eliminating scales with Cronbach’s Alpha coefficients below 0.6 and variables with item-total correlation coefficients below 0.3, the final summary of scale reliability and variables is shown in Table 11.
Table 10. Reliability and item-total statistics for the investment intent (YDDT)
|
|
Cronbach’s Alpha |
N of Items |
||
|
|
0.871 |
4 |
||
|
Item |
Scale Mean if Item Deleted |
Scale Variance if Item Deleted |
Corrected Item-Total Correlation |
Cronbach’s Alpha if Item Deleted |
|
YDDT1 |
10.94 |
3.278 |
0.735 |
0.832 |
|
YDDT2 |
10.83 |
3.303 |
0.754 |
0.824 |
|
YDDT3 |
10.94 |
3.288 |
0.702 |
0.846 |
|
YDDT4 |
10.76 |
3.451 |
0.712 |
0.841 |
Table 11. Final summary of scale reliability and variables after refinement
|
Scale |
Cronbach’s Alpha |
Number of Variables |
|
BCM |
0.791 |
4 |
|
CSHT |
0.796 |
5 |
|
CSTH |
0.808 |
4 |
|
NNL |
0.806 |
3 |
|
DVC |
0.853 |
3 |
|
YDDT |
0.871 |
4 |
4.2 Exploratory Factor Analysis
a. EFA results for factors influencing YDDT
The results presented in Table 12 show that the Kaiser-Meyer-Olkin (KMO) value is 0.845, exceeding the recommended threshold for factor analysis. Bartlett’s Test of Sphericity is statistically significant, with Sig. = 0.000, confirming that the correlation matrix is suitable for factor extraction. These results indicate that the dataset is appropriate for EFA.
Table 12. Bartlett’s test and Kaiser-Meyer-Olkin (KMO)
|
KMO and Bartlett’s Test |
||
|
Kaiser-Meyer-Olkin Measure of Sampling Adequacy. |
0.845 |
|
|
Bartlett’s Test of Sphericity |
Approx. Chi-Square |
2968.258 |
|
df |
253 |
|
|
Sig. |
0.000 |
|
Table 13 presents the total variance explained by the extracted components. The factor-retention procedure used the eigenvalue-greater-than-one rule as the initial extraction criterion, followed by examination of the rotated solution, theoretical interpretability, and the reliability results reported in the preceding section. The initial extraction produced six components with eigenvalues greater than 1, explaining 61.484% of the total variance. However, the geographical-location scale did not meet the reliability threshold in the Cronbach’s Alpha analysis and was therefore excluded from the final regression model.
Accordingly, although the variance table reports six initially extracted components, the final empirical model retained five reliable predictor constructs for hypothesis testing: BCM, CSHT, CSTH, NNL, and DVC. This distinction explains the difference between the six-component extraction result and the five-factor structure used in the final regression analysis.
Given the sample size of 381, the minimum acceptable factor loading was set at 0.55. The rotated factor matrix indicates that the retained observed variables met this criterion. Therefore, the EFA results support the use of the five reliable predictor constructs in the subsequent correlation and regression analyses. Overall, the extracted components explain 61.484% of the total variance, exceeding the commonly accepted 50% threshold and confirming the adequacy of the factor solution.
Table 13. Total variance explained for factors influencing investment intent (YDDT)
|
Total Variance Explained |
|||||||||
|
Component |
Initial Eigenvalues |
Extraction Sums of Squared Loadings |
Rotation Sums of Squared Loadings |
||||||
|
Total |
% of Variance |
Cumulative % |
Total |
% of Variance |
Cumulative % |
Total |
% of Variance |
Cumulative % |
|
|
1 |
5.851 |
25.441 |
25.441 |
5.851 |
25.441 |
25.441 |
2.824 |
12.277 |
12.277 |
|
2 |
2.153 |
9.361 |
34.802 |
2.153 |
9.361 |
34.802 |
2.568 |
11.166 |
23.443 |
|
3 |
1.915 |
8.325 |
43.126 |
1.915 |
8.325 |
43.126 |
2.500 |
10.869 |
34.312 |
|
4 |
1.597 |
6.945 |
50.071 |
1.597 |
6.945 |
50.071 |
2.351 |
10.222 |
44.534 |
|
5 |
1.462 |
6.358 |
56.429 |
1.462 |
6.358 |
56.429 |
2.157 |
9.377 |
53.911 |
|
6 |
1.163 |
5.055 |
61.484 |
1.163 |
5.055 |
61.484 |
1.742 |
7.573 |
61.484 |
|
7 |
0.884 |
3.843 |
65.327 |
|
|
|
|
|
|
|
8 |
0.819 |
3.560 |
68.887 |
|
|
|
|
|
|
|
9 |
0.784 |
3.411 |
72.298 |
|
|
|
|
|
|
|
10 |
0.735 |
3.196 |
75.494 |
|
|
|
|
|
|
|
11 |
0.658 |
2.861 |
78.355 |
|
|
|
|
|
|
|
12 |
0.560 |
2.434 |
80.789 |
|
|
|
|
|
|
|
13 |
0.514 |
2.235 |
83.024 |
|
|
|
|
|
|
|
14 |
0.504 |
2.192 |
85.217 |
|
|
|
|
|
|
|
15 |
0.492 |
2.137 |
87.354 |
|
|
|
|
|
|
|
16 |
0.451 |
1.962 |
89.316 |
|
|
|
|
|
|
|
17 |
0.433 |
1.883 |
91.198 |
|
|
|
|
|
|
|
18 |
0.403 |
1.753 |
92.951 |
|
|
|
|
|
|
|
19 |
0.375 |
1.632 |
94.583 |
|
|
|
|
|
|
|
20 |
0.372 |
1.617 |
96.199 |
|
|
|
|
|
|
|
21 |
0.336 |
1.462 |
97.661 |
|
|
|
|
|
|
|
22 |
0.299 |
1.299 |
98.960 |
|
|
|
|
|
|
|
23 |
0.239 |
1.040 |
100.000 |
|
|
|
|
|
|
|
Extraction Method: Principal Component Analysis. |
|||||||||
b. Exploratory Factor Analysis results for YDDT
The EFA for the YDDT confirms the appropriateness of the scale for further analysis. As shown in Table 14, the Kaiser-Meyer-Olkin (KMO) Measure of Sampling Adequacy is 0.830, exceeding the acceptable threshold of 0.5. Bartlett’s Test of Sphericity indicates statistical significance, with an approximate chi-square value of 734.859 and a significance level of 0.000 (p < 0.05). These results validate the suitability of the dataset for factor analysis.
The total variance explained by the analysis is 72.261%, which is well above the minimum required threshold of 50%. This indicates that the extracted factor accounts for a substantial proportion of the variability in the dataset. Additionally, the Eigenvalue for the factor is 2.890, confirming that all variables load onto a single factor.
The component matrix further supports these findings, with all observed variables (YDDT1, YDDT2, YDDT3, and YDDT4) having factor loadings greater than 0.5. Specifically, the factor loadings for YDDT2, YDDT1, YDDT4, and YDDT3 are 0.869, 0.857, 0.840, and 0.833, respectively. These results affirm the robustness of the YDDT and its readiness for further analysis.
Table 14. Bartlett’s test, Kaiser-Meyer-Olkin (KMO), and total variance explained for investment intent (YDDT)
|
KMO and Bartlett’s Test |
|||||||
|
Kaiser-Meyer-Olkin Measure of Sampling Adequacy. |
0.830 |
||||||
|
Bartlett’s Test of Sphericity |
Approx. Chi-Square |
734.859 |
|||||
|
df |
6 |
||||||
|
Sig. |
0.000 |
||||||
|
|
|||||||
|
Total Variance Explained |
|||||||
|
Component |
Initial Eigenvalues |
Extraction Sums of Squared Loadings |
|||||
|
Total |
% of Variance |
Cumulative % |
Total |
% of Variance |
Cumulative % |
||
|
1 |
2.890 |
72.261 |
72.261 |
2.890 |
72.261 |
72.261 |
|
|
2 |
0.414 |
10.342 |
82.603 |
|
|
|
|
|
3 |
0.386 |
9.656 |
92.259 |
|
|
|
|
|
4 |
0.310 |
7.741 |
100.000 |
|
|
|
|
|
Extraction Method: Principal Component Analysis. |
|||||||
|
|
|||||||
|
Component Matrixa |
Component |
||||||
|
|
1 |
||||||
|
YDDT2 |
0.869 |
||||||
|
YDDT1 |
0.857 |
||||||
|
YDDT4 |
0.840 |
||||||
|
YDDT3 |
0.833 |
||||||
|
Extraction Method: Principal Component Analysis. |
|||||||
|
a. 1 components extracted. |
|||||||
Table 15. Pearson correlation coefficients between investment intent (YDDT) and independent variables
|
|
YDDT |
BCM |
CSHT |
CSTH |
NNL |
DVC |
|
|
YDDT |
Pearson Correlation |
1 |
0.408** |
0.599** |
0.661** |
0.560** |
0.526** |
|
Sig. (2-tailed) |
|
0.000 |
0.000 |
0.000 |
0.000 |
0.000 |
|
|
N |
381 |
381 |
381 |
381 |
381 |
381 |
|
|
BCM |
Pearson Correlation |
0.408** |
1 |
0.318** |
0.295** |
0.257** |
0.244** |
|
Sig. (2-tailed) |
0.000 |
|
0.000 |
0.000 |
0.000 |
0.000 |
|
|
N |
381 |
381 |
381 |
381 |
381 |
381 |
|
|
CSHT |
Pearson Correlation |
0.599** |
0.318** |
1 |
0.419** |
0.265** |
0.332** |
|
Sig. (2-tailed) |
0.000 |
0.000 |
|
0.000 |
0.000 |
0.000 |
|
|
N |
381 |
381 |
381 |
381 |
381 |
381 |
|
|
CSTH |
Pearson Correlation |
0.661** |
0.295** |
0.419** |
1 |
0.315** |
0.323** |
|
Sig. (2-tailed) |
0.000 |
0.000 |
0.000 |
|
0.000 |
0.000 |
|
|
N |
381 |
381 |
381 |
381 |
381 |
381 |
|
|
NNL |
Pearson Correlation |
0.560** |
0.257** |
0.265** |
0.315** |
1 |
0.482** |
|
Sig. (2-tailed) |
0.000 |
0.000 |
0.000 |
0.000 |
|
0.000 |
|
|
N |
381 |
381 |
381 |
381 |
381 |
381 |
|
|
DVC |
Pearson Correlation |
0.526** |
0.244** |
0.332** |
0.323** |
0.482** |
1 |
|
Sig. (2-tailed) |
0.000 |
0.000 |
0.000 |
0.000 |
0.000 |
|
|
|
N |
381 |
381 |
381 |
381 |
381 |
381 |
|
4.3 Common method bias and robustness diagnostics
Given the single-source, self-reported, cross-sectional nature of the survey, common method bias was examined using Harman’s single-factor test. The first unrotated component explained 25.441% of total variance, which is below the 50% threshold frequently used as an initial diagnostic. The inter-construct correlations were positive and statistically significant but remained below levels that would suggest redundancy among predictors. Multicollinearity was also low, with VIF values ranging from 1.185 to 1.412. As a sensitivity check, the final regression model was interpreted after excluding the unreliable geographical-location construct and low-performing items; the direction and significance of the five retained predictors remained consistent with the bivariate correlation results. These diagnostics indicate that the regression findings are not obviously dominated by common method variance or multicollinearity. Nevertheless, the study acknowledges that longitudinal, multi-source, and project-level sustainability data would provide stronger causal evidence.
4.4 Testing relationships between variables (pearson correlation coefficient)
The relationship between the dependent variable YDDT and the independent variables (BCM, CSHT, CSTH, NNL, DVC) was examined using Pearson correlation analysis. The results indicate that all independent variables are linearly related to the dependent variable, as evidenced by significance levels (Sig) less than 0.05. The correlations and their significance are presented in Table 15.
This analysis confirms significant positive correlations between YDDT and all independent variables (BCM, CSHT, CSTH, NNL, DVC), indicating linear relationships across all factors.
4.5 Regression analysis
The regression analysis was conducted to evaluate the influence of five independent variables—CSHT, CSTH, NNL, BCM, and DVC—on the dependent variable, YDDT.
•ANOVA results
The ANOVA results indicate that the regression model is statistically significant, with an F-value of 168.842 and a p-value of 0.000 (p < 0.05). This confirms that the model provides a good fit for the data. The breakdown of variance is presented in Table 16.
•Model summary
The standardized beta coefficients highlight the relative importance of each predictor. After rechecking the original survey dataset and SPSS coefficients output, CSTH show the strongest standardized association with YDDT (β = 0.377), followed by CSHT (β = 0.287), NNL (β = 0.264), DVC (β = 0.158), and BCM (β = 0.099). Thus, BCM remains statistically significant but is not the strongest predictor (Table 17).
Table 16. ANOVA results
|
ANOVAa |
||||
|
|
|
F |
Sig. |
|
|
|
|
168.842 |
0.000b |
|
|
Model |
Sum of Squares |
df |
Mean Square |
|
|
1 |
Regression |
93.357 |
5 |
18.671 |
|
Residual |
41.469 |
375 |
0.111 |
|
|
Total |
134.826 |
380 |
|
|
|
a. Dependent Variable: YDDT |
||||
|
b. Predictors: (Constant), DVC, BCM, CSTH, CSHT, NNL |
||||
Table 17. Model summary
|
Model Summaryb |
|||
|
|
|
Std. Error of the Estimate |
Durbin-Watson |
|
|
|
0.33254 |
1.942 |
|
Model |
R |
R Square |
Adjusted R Square |
|
1 |
0.832a |
0.692 |
0.688 |
|
a. Predictors: (Constant), DVC, BCM, CSTH, CSHT, NNL |
|||
|
b. Dependent Variable: YDDT |
|||
•Regression coefficients
The regression coefficients reveal the relative importance and significance of each independent variable in predicting YDDT. All independent variables are statistically significant (p < 0.05). The standardized beta coefficients indicate the relative strength of the associations, and all coefficients are positive, showing that each factor is positively associated with YDDT. The variance inflation factor (VIF) values for all variables are below 10, indicating no multicollinearity issue. The detailed, rechecked SPSS coefficients output is presented as follows (Table 18):
Table 18. Regression coefficients
|
Coefficientsa |
||||||||
|
Model |
Unstandardized Coefficients |
Standardized Coefficients |
t |
Sig. |
Collinearity Statistics |
|||
|
B |
Std. Error |
Beta |
|
|
Tolerance |
VIF |
||
|
1 |
(Constant) |
0.050 |
0.129 |
|
0.385 |
0.701 |
|
|
|
BCM |
0.085 |
0.027 |
0.099 |
3.161 |
0.002 |
0.844 |
1.185 |
|
|
CSHT |
0.263 |
0.030 |
0.287 |
8.689 |
0.000 |
0.750 |
1.333 |
|
|
CSTH |
0.321 |
0.028 |
0.377 |
11.408 |
0.000 |
0.751 |
1.331 |
|
|
NNL |
0.205 |
0.026 |
0.264 |
7.865 |
0.000 |
0.727 |
1.376 |
|
|
DVC |
0.112 |
0.024 |
0.158 |
4.639 |
0.000 |
0.708 |
1.412 |
|
|
a. Dependent Variable: YDDT |
||||||||
The regression analysis reveals that the adjusted R² value is 0.688, indicating that the model explains 68.8% of the variability in YDDT. This confirms the strong explanatory power for the independent variables included in the model. The analysis confirms that all independent variables—BCM, CSHT, CSTH, NNL, and DVC—are statistically significant predictors of YDDT, with p-values below 0.05.
The standardized beta coefficients indicate the relative importance of the predictors in explaining YDDT. Among the five significant predictors, CSTH have the strongest standardized association with YDDT (β = 0.377), followed by CSHT (β = 0.287), NNL (β = 0.264), DVC (β = 0.158), and BCM (β = 0.099). Therefore, all predictors contribute positively to YDDT, but their relative strength differs from the earlier reported order.
The corrected regression results show that CSTH are the most influential standardized predictor shaping YDDT in Quang Ngai Province. This finding suggests that investors respond strongly to transparent, consistent, and supportive provincial policy frameworks, including long-term FDI strategies, synchronized investment policies, and incentive mechanisms that reduce uncertainty and strengthen confidence in the local investment environment.
BCM remains a statistically significant predictor, but its corrected standardized coefficient indicates that it operates as a supporting contextual condition rather than the dominant driver of YDDT. CSHT, NNL, and DVC further strengthen YDDT by improving operational conditions, labor availability, administrative efficiency, and institutional support.
However, because the dependent variable in this study is YDDT rather than realized sustainability outcomes, these results should be interpreted carefully. The findings provide evidence of perceived investment attractiveness in a sustainability-oriented provincial development context, but they do not prove that FDI projects themselves generate measurable environmental, social, or economic sustainability outcomes. Overall, the results suggest that improvements in transparent investment policies, CSHT, NNL, DVC, and contextual readiness can enhance Quang Ngai’s attractiveness to potential and existing investors.
The quantitative research findings demonstrate that five key factors are positively associated with enterprises’ YDDT in Quang Ngai Province, aligning with the proposed research hypotheses. These factors include CSHT, CSTH, NNL, BCM, and DVC. The significance of these factors is evaluated through their respective standardized β coefficients, where larger values indicate stronger associations with YDDT. These findings are consistent with qualitative research results and preliminary analyses, providing a comprehensive understanding of the determinants of investment decisions.
CSTH emerge as the most influential standardized predictor of YDDT, with a corrected β coefficient of 0.377. This finding emphasizes the pivotal role of government policies in attracting FDI, consistent with qualitative evidence that underscores the importance of streamlined administrative processes, transparent legal frameworks, and financial incentives. Such policies are vital for fostering investor confidence and improving the perceived credibility of the provincial investment environment. The result indicates that provincial governments and central authorities should actively implement coherent, transparent, and predictable policy instruments to expand FDI. This policy implication is reinforced by Vietnam-based evidence that lean, decentralized, and digitally enabled governance can improve sustainable local development planning [10].
CSHT ranks second in standardized importance, with a β coefficient of 0.287. The study underscores the importance of well-developed infrastructure in attracting FDI, as it supports operational efficiency, economic development, and job creation. These findings are consistent with qualitative evidence suggesting that targeted investments in infrastructure—such as roads, power networks, and water systems—are essential for creating a conducive environment for investment in industrial zones and coastal tourism areas.
The influence of NNL is reflected by a β coefficient of 0.264, making it the third most important predictor. The results indicate that a skilled and disciplined workforce, together with adequate labor availability, positively influences YDDT. These findings align with qualitative insights that highlight the value enterprises place on the availability of a competent workforce, which contributes to improved productivity and long-term economic sustainability.
DVC rank fourth in standardized importance, with a β coefficient of 0.158. This result indicates that simplified administrative procedures, supportive provincial authorities, and effective investment-promotion services remain important for shaping investor perceptions, even though their standardized association is smaller than those of policy, CSHT, and NNL.
BCM remains statistically significant, with a corrected β coefficient of 0.099, but it should be interpreted as a supporting contextual condition rather than the strongest predictor. This construct captures broader macro-contextual and provincial conditions, including demographic resources, private-sector development, income growth, policy recognition of FDI, and perceived resilience to climate-related disruption. The result suggests that these contextual elements help shape YDDT, but they are less decisive than the direct policy environment, infrastructure, workforce capacity, and public-service quality.
Importantly, the study indicates that FDI attraction is no longer determined solely by traditional cost and location factors but is increasingly shaped by policy credibility, infrastructure readiness, workforce capacity, public-service quality, digitalization, climate-related risks, and shifts in global supply chains. At the same time, the findings should be read within the study’s empirical scope: the dependent variable is YDDT, and the research does not directly evaluate post-investment environmental, social, or economic sustainability performance.
This study examined the critical factors influencing FDI intent in Quang Ngai Province, Vietnam, using a mixed-methods approach. The research identified five statistically significant determinants: CSTH, CSHT, NNL, DVC, and BCM. Among these, CSTH emerged as the strongest standardized predictor of YDDT (β = 0.377), followed by CSHT (β = 0.287), NNL (β = 0.264), DVC (β = 0.158), and BCM (β = 0.099).
The empirical results, supported by both qualitative insights and quantitative analysis, highlight the necessity for provincial authorities to implement targeted strategies that enhance the local investment climate. Transparent and consistent investment policies should be prioritized, while improvements in infrastructure readiness, workforce capabilities, administrative efficiency, and institutional support remain essential for positioning Quang Ngai as a competitive investment destination in the region.
Importantly, the study underscores that FDI attraction is no longer determined solely by traditional factors but is increasingly shaped by policy credibility, the digital economy, climate change, and shifts in global supply chains. As such, future investment strategies should prioritize transparent governance, adaptability, and long-term sustainability.
Further research is needed to generalize these findings across other provinces and to explore whether YDDT translates into realized high-tech, green, and sustainability-oriented FDI outcomes in the Vietnamese context. Longitudinal studies could provide deeper insights into how these determinants change over time, while comparative research may reveal best practices applicable to broader regional development strategies.
This research is funded by University of Finance – Marketing, Vietnam. The authors thank the participating enterprise representatives and officials for their time and insights.
APPENDIX A. Survey items, operationalization, coding, and interview protocol
Construct operationalization and coding. The questionnaire measured respondents’ perceptions of local investment conditions and investment intent in Quang Ngai Province. All survey items were measured using a five-point Likert scale, coded from 1 = strongly disagree to 5 = strongly agree. Higher scores indicate more favorable evaluations of the relevant local investment condition or stronger investment intent.
CSHT. This construct measured respondents’ assessments of basic infrastructure conditions supporting investment activities. The retained items covered convenient intra-provincial transport infrastructure, adequate electricity supply, convenient communication systems, sufficient water supply, and adequate drainage systems.
CSTH. This construct measured perceptions of the provincial policy environment for FDI attraction. The retained items covered the existence of a long-term provincial strategy for attracting FDI, transparent and synchronized investment policies without negative practices, credit incentives compared with other localities, and tax incentives compared with other localities.
NNL. This construct measured the perceived availability and quality of local labor resources. The retained items covered abundant unskilled labor, a disciplined labor force, and technically skilled managers and staff. Item NNL3 was excluded during reliability refinement because its corrected item-total correlation was below the acceptance threshold.
BCM. This construct measured broader contextual conditions shaping investment perceptions in Quang Ngai. The retained items covered a young and abundant labor force, a thriving private sector with increasing incomes, government recognition of FDI as a crucial economic sector, and minimal perceived disruption from climate change or natural disasters. Items BCM1, BCM3, and BCM5 were excluded during reliability refinement because their corrected item-total correlations did not meet the required threshold.
DVC. This construct measured respondents’ perceptions of administrative and institutional support for investors. The retained items covered simple and efficient administrative procedures, supportive provincial authorities, and effective investment promotion centers. Item DVC4 was excluded during reliability refinement because it did not satisfy the item-total correlation criterion.
YDDT. This dependent construct measured respondents’ intention and confidence regarding investment in Quang Ngai. The retained items covered satisfaction with investment in Quang Ngai, intention to continue investing in Quang Ngai, perceived potential for growth in Quang Ngai, and belief that the province can attract more businesses in the future.
Qualitative interview protocol. Semi-structured interviews were used to complement the survey and clarify context-specific determinants of FDI intent. Interview questions asked participants to evaluate infrastructure conditions, the policy environment, labor quality, public-service delivery, geographic and contextual advantages, and global economic conditions affecting FDI decisions. Participants were also asked to identify major obstacles to attracting higher-quality and more sustainability-oriented investment in Quang Ngai.
Sampling, response filtering, and missing-data treatment. The quantitative survey targeted enterprise representatives with direct knowledge of investment decisions and local operating conditions. Of the 400 distributed questionnaires, 381 valid responses were retained for analysis after excluding incomplete, duplicated, or ineligible responses. Questionnaires with substantial missing information were not included in scale construction or regression analysis. No imputation was applied to excluded incomplete questionnaires.
[1] Chaudhuri, S., Mukhopadhyay, U. (2014). Foreign Direct Investment in Developing Countries. Springer India. https://doi.org/10.1007/978-81-322-1898-2
[2] Fernandes, A. (2024). Impact of foreign direct investment (FDI) on economic growth: A study of Brazil. International Journal of Economics, 9(1): 31-41. https://doi.org/10.47604/ijecon.2442
[3] Nguyễn, H.V., Phan, T.T. (2023). Impact of economic growth, international trade, and FDI on sustainable development in developing countries. Environment, Development and Sustainability, 27(2): 4017-4043. https://doi.org/10.1007/s10668-023-04060-9
[4] Anwar, S., Nguyen, L.P. (2013). Foreign direct investment and economic growth in Vietnam. In Whither South East Asian Management? pp. 177-196. https://doi.org/10.4324/9781315875620-10
[5] Phi, V.T., Tran, K.H., Hoang, V.H., Dong, V.C. (2024). The role of foreign direct investment in technology development in Vietnam. Cogent Social Sciences, 10(1): 2300514. https://doi.org/10.1080/23311886.2023.2300514
[6] Dung, T. (2023). FDI inflows surge over 32% in 2023. Viet Nam Government News. https://en.baochinhphu.vn/fdi-inflows-surges-over-32-in-2023-111231226154652862.htm.
[7] Hoa, P. (2024). Attracting FDI: Innovation in thinking and strategy to maximize economic efficiency. https://vneconomy.vn/thu-hut-fdi-doi-moi-tu-duy-va-chien-luoc-de-phat-huy-toi-da-hieu-qua-kinh-te.htm.
[8] Tien, N.D., Lam Duyen, T.N., Thanh Huyen, N.T., et al. (2024). Community-based ecotourism for sustainability: An evaluative analysis of Binh Son district, Quang Ngai province in Vietnam. Social Sciences & Humanities Open, 9: 100807. https://doi.org/10.1016/j.ssaho.2024.100807
[9] Huynh, H.T., Le Nguyen, D.N. (2025). Reforming subnational foreign direct investment (FDI) strategies in Vietnam: A policy evaluation of Quang Ngai province amid global shifts. Nsukka Journal of the Humanities, 33(3): 115-134. https://doi.org/10.62250/nsuk.2025.33.3.115-134
[10] Nguyen, H.T., Pham, L.T., Nguyen, A.T., Nguyen, Q.T. (2025). Building sustainable urban governance in Vietnam: A framework for lean, decentralized and digitally enabled cities. International Journal of Sustainable Development and Planning, 20(12): 5357-5366. https://doi.org/10.18280/ijsdp.201227
[11] UNCTAD. (2024). World Investment Report 2024: Investment facilitation and digital government. United Nations. https://unctad.org/publication/world-investment-report-2024.
[12] Mayer, C.H., Oosthuizen, R.M. (2020). Positive transformation towards the fourth industrial revolution: Empirical evidence from a technology company. International Review of Psychiatry, 32(7-8): 659-672. https://doi.org/10.1080/09540261.2020.1763927
[13] Gao, B., Xu, Z. (2024). Adjustment of supply chain investment by transnational corporations in the Ukrainian crisis and geopolitical risks – Taking the three levels as the analytical framework. Transnational Corporations Review, 16(3): 200076. https://doi.org/10.1016/j.tncr.2024.200076
[14] Jung, Y.S., Park, Y. (2024). Winners and losers in U.S.–China trade disputes: A dynamic compositional analysis of foreign direct investment. Social Science Quarterly, 105(4): 980-995. https://doi.org/10.1111/ssqu.13362
[15] People’s Committee of Quang Ngai. (2021). Decision No. 2125/QD-UBND approving the industrial restructuring project of Quang Ngai Province to 2030, with a vision to 2045. https://thuvienphapluat.vn/van-ban/Thuong-mai/Quyet-dinh-2125-QD-UBND-2021-De-an-Tai-co-cau-nganh-cong-nghiep-Quang-Ngai-den-2030-506108.aspx.
[16] Lai, N.V., Le, C.Q., Nguyen, Q.T. (2025). Vietnam’s strategic management and organisational adaptation to technological, geopolitical and environmental challenges. Journal of International Studies, 21(2): 68-86. https://doi.org/10.32890/jis2025.21.2.4
[17] Suntikul, W., Butler, R., Airey, D. (2010). The influence of foreign direct investment on accommodation patterns in Vietnam as a result of the open-door policy. Current Issues in Tourism, 13(3): 261-277. https://doi.org/10.1080/13683500902937628
[18] Lee, J.Y., Hsiao, Y.C., Bui, N., Nguyen, T.T. (2021). Inward foreign direct investment and trade openness in Vietnam: A nonlinear autoregressive distributed lag approach. Economies, 9(3): 120. https://doi.org/10.3390/economies9030120
[19] Nguyen, A.N., Nguyen, T. (2007). Foreign direct investment in Vietnam: An overview and analysis the determinants of spatial distribution across provinces. SSRN. https://doi.org/10.2139/ssrn.999550
[20] Le, H.Q., Pomfret, R. (2011). Technology spillovers from foreign direct investment in Vietnam: Horizontal or vertical spillovers? Journal of the Asia Pacific Economy, 16(2): 183-201. https://doi.org/10.1080/13547860.2011.564746
[21] Huynh, T.D.L., Huynh, T.T.T. (2022). Labor and infrastructure factors affecting provincial distribution of foreign direct investment in Vietnam. Journal of Science and Technology Issue on Information and Communications Technology: 92-97. https://doi.org/10.31130/ud-jst.2022.547e
[22] Alimuddin, A., Suriyanti, S., Imaduddin, I. (2024). Analysis of the impact of foreign direct investment (FDI) on industrial productivity and labour welfare in ASEAN countries: A panel econometric approach. Jurnal Ekonomi, 13(1): 16-23.
[23] Bhujabal, P., Sethi, N., Padhan, P.C. (2021). ICT, foreign direct investment and environmental pollution in major Asia Pacific countries. Environmental Science and Pollution Research, 28(31): 42649-42669. https://doi.org/10.1007/s11356-021-13619-w
[24] Ridzuan, A.R., Ismail, N.A., Che Hamat, A.F. (2017). Does foreign direct investment successfully lead to sustainable development in Singapore? Economies, 5(3): 29. https://doi.org/10.3390/economies5030029
[25] Zhang, M., Yang, R. (2022). FDI and spillovers: New evidence from Malaysia’s manufacturing sector. Review of Development Economics, 26(2): 847-877. https://doi.org/10.1111/rode.12857
[26] Lee, K., Qu, D., Mao, Z. (2021). Global value chains, industrial policy, and industrial upgrading: Automotive sectors in Malaysia, Thailand, and China in comparison with Korea. European Journal of Development Research, 33(2): 275-303. https://doi.org/10.1057/s41287-020-00354-0
[27] Liaw, B.K. (2025). Accessing industrial site selection criteria by investors in Malaysia. Master dissertation, Universiti Tunku Abdul Rahman (UTAR). http://eprints.utar.edu.my/6325/.
[28] OECD. (2020). Multi-dimensional Review of Viet Nam: Towards an Integrated, Transparent and Sustainable Economy. Paris: OECD Publishing. https://doi.org/10.1787/367b585c-en
[29] Banh, T.T. (2023). Attracting foreign direct investment to develop Nghe An Province’s socio-economy. Doctoral dissertation, Academy of Finance, Hanoi. https://thuvienso.quochoi.vn/handle/11742/77691?locale=en.
[30] Kim, H.M. (2023). Foreign direct investment and urban growth in Vietnam: Spatial, economic, and demographic perspectives. Asian Geographer, 41(2): 167-184. https://doi.org/10.1080/10225706.2023.2244946
[31] Ruta, M. (2022). The impact of the war in Ukraine on global trade and investment. World Bank. https://doi.org/10.1596/37359
[32] Nguyen, K.T., Nguyen, T.D., Tran, M.N.T. (2025). Environmental impacts and strategic responses in agricultural transformation: A SWOT–TOWS analysis of Dong Nai province, Vietnam. International Journal of Sustainable Development and Planning, 20(11): 4941-4956. https://doi.org/10.18280/ijsdp.201132