Makhfud Efendy | Mohamad Zaki Mahasin | Veryl Hasan* | Ahmad Heriyanto | Wiwit Sri Werdi Pratiwi | Nike Ika Nazulu | Nizar Hadiyanto | Muhammad Hanif Azhar | Muhammad Browijoyo Santanumurtix | Raden Adharyan Islamy | Aang Kisnu Darmawan
© 2026 The authors. This article is published by IIETA and is licensed under the CC BY 4.0 license (http://creativecommons.org/licenses/by/4.0/).
OPEN ACCESS
Indonesia’s persistent reliance on maritime salt imports highlights the urgent need for an integrated spatial-socioeconomic framework to accelerate self-sufficiency. This study establishes a data-driven model across ten major salt-producing provinces using 2024/2025 field surveys and 30-meter resolution spatial data. The workflow integrates Geographic Information System (GIS)-based Multi-Criteria Decision Analysis (MCDA), binary logistic regression, and system dynamics (SDs) modeling. Results from the GIS-Analytical Hierarchy Process (AHP) analysis identified 15,500 hectares of highly suitable (S1) land for cluster expansion. Comparative evaluations showed that adopting geomembrane technology significantly increased real productivity from 65.8 to 105.3 tons per hectare per season (95% CI: 33.4-45.6; Cohen’s d = 2.18; p < 0.001). Furthermore, logistic regression revealed that cooperative membership is the primary determinant of technology adoption, increasing the likelihood more than fourfold (Odds Ratios (OR) = 4.482). Other significant factors included education level and access to extension services. Finally, SDs simulations projected long-term economic impacts up to the 2035 horizon, predicting a 60% to 75% increase in net farmer income. This scalable framework successfully bridges spatial planning and socio-institutional interventions, providing a robust tool for evidence-based policymaking in developing maritime economies.
geomembrane technology, Geographic Information System, salt self-sufficiency, technology adoption, smallholder farmers, spatial analysis
Salt is a strategic commodity driving macroeconomic stability, serving as an essential input for industrial supply chains and human consumption. Despite possessing the world's second-longest coastline and high solar radiation, Indonesia relies heavily on imports to meet domestic demand. This structural deficit drains foreign exchange, exposes industrial sectors to international market shocks, and traps smallholder producers in low-income cycles. The primary bottleneck is the weather-dependent nature of traditional open clay-bed solar evaporation systems, which are highly vulnerable to unpredictable rainfall, wind dynamics, and seasonal shifts, forcing production halts during the wet season [1, 2]. Furthermore, soil contamination causes severe quality degradation, resulting in low sodium chloride (NaCl) purity and high mineral impurities that fail to meet industrial manufacturing standards [3, 4]. Although modernizations like geomembrane linings and greenhouse tunnels improve yields and push NaCl purity above 98%, their adoption remains restricted by high initial capital costs and limited local technical expertise [3, 5].
To guide empirical policy, "salt self-sufficiency" must be operationally defined using quantifiable metrics rather than political rhetoric. Academic literature defines self-sufficiency across three core parameters: aggregate production volume, structural grade differentiation, and the import replacement ratio [6-8]. True self-sufficiency requires system equilibrium across distinct qualitative tiers. A structural paradox exists in developing maritime nations where local farmers generate a surplus of low-grade consumption salt but fail to produce high-purity industrial grades, perpetuating foreign dependence for chemical and food processing industries [7, 8]. This study operationally defines self-sufficiency through a three-pronged threshold: stabilizing total aggregate upstream output, enforcing a strict qualitative baseline of $\geq$95% NaCl purity to substitute consumption and food industry imports, and achieving a measurable import replacement ratio. Smallholder cooperatives serve as crucial socio-institutional mechanisms to accelerate this transition by operating as open knowledge networks and pooling capital, though their effectiveness depends on local governance maturity [8-10].
Previous strategies have underperformed due to a fragmented policy framework separating biophysical planning from socio-institutional realities. A primary methodological gap is the static application of Geographic Information System (GIS)-based Multi-Criteria Decision Analysis (GIS-MCDA). While spatial models excel at mapping physical land suitability-such as salinity, temperature, and slope [11-13], they treat socioeconomic factors as static, exogenous layers like simple distance buffers [13, 14]. Consequently, they fail to model dynamic feedback loops showing how spatial constraints influence behavioral decisions and technology adoption over time [15, 16]. Conversely, system dynamics (SDs) models simulate long-term policy impacts and adoption pathways but lack high-resolution spatial granularity [16]. Existing frameworks lack an integrated mechanism where empirical micro-level technology adoption probabilities and spatial capacity constraints dynamically feed into a single simulation model. This leaves a clear disconnect between spatial infrastructure investments and the socio-institutional readiness of smallholder communities.
To bridge these gaps, this study develops a unified, data-driven GIS-socioeconomic framework designed to operationalize and accelerate national salt self-sufficiency. The research is guided by three empirical questions: (1) identifying the geographically highly suitable (S1) zones for community-based salt cluster expansion and quantifying their areal extent based on biophysical parameters; (2) determining the magnitude of real productivity gains achieved by transitioning smallholder farms to geomembrane systems after controlling for regional climate variations and farm-level confounding factors; and (3) examining which socio-institutional and demographic variables most strongly influence the probability of geomembrane technology adoption among smallholder salt farmers to accurately calibrate simulation parameters.
Scientifically, this study contributes to the literature on innovation diffusion in developing maritime economies by bridging a critical methodological gap: it operationalizes a dynamic integration framework where static GIS-based spatial suitability constraints directly calibrate micro-level behavioral adoption choices and macro-level SDs simulation parameters. Practically, this framework serves as a scalable decision-support tool for policymakers to accelerate sustainable salt sector transformation; it provides precise geospatial intelligence to optimize infrastructure investments across the identified 15,500 hectares of highly suitable land, while leveraging quantified institutional mechanisms-specifically cooperative membership-to drive zero-waste geomembrane technology adoption, minimize import dependency, and secure national salt self-sufficiency by the 2035 horizon.
2.1 Framework integration architecture
This study establishes a novel hybrid methodological framework that dynamically integrates geospatial suitability, discrete-choice behavioral modeling, and macro-structural simulations. Addressing a major gap identified in the literature regarding the absence of dynamic feedback loops between static spatial constraints and behavioral adoption parameters over time [15, 16], the proposed workflow formalizes a bidirectional input-output data bridge among three analytical components. First, the GIS-MCDA output classified as Highly Suitable (S1) is operationalized as the absolute capacity constraint parameter ($Max$_$Land$$_{S 1}$) for the potential land stock variable within the Vensim SDs model. Second, the Binary Logistic Regression results transform empirical Odds Ratios (OR) for cooperative membership (OR = 4.482) and extension access (OR = 2.586) into normalized weighting coefficients ($w_i$) to calibrate the dynamic Technology Adoption Rate ($T A R_t$) equation, ensuring that institutional support evolves as an endogenous driver within the simulation framework.
2.2 Study sites and spatial data boundaries
Empirical field data and spatial observations were gathered across the 2024/2025 production cycles, bounding the research scope strictly to ten primary salt-producing provinces in Indonesia: Aceh, DI Yogyakarta, West Java, Central Java, East Java, Bali, West Nusa Tenggara, East Nusa Tenggara, South Sulawesi, and Gorontalo. Spatial data boundaries utilize secondary geospatial layers acquired at a 30-meter pixel resolution, projected using the World Geodetic System 1984 (WGS 84) coordinate reference system. The following are the Biophysical Suitability Criteria and AHP Weights, presented in Table 1.
Table 1. Biophysical suitability criteria and Analytical Hierarchy Process (AHP) weights
|
Biophysical Criterion |
Unit |
$S_1$ (Highly) |
$S_2$ (Moderately) |
$S_3$ (Marginally) |
$N$ (Unsuitable) |
AHP Weight |
|
Salinity |
‰ |
3.5–4.5 |
2.5–3.4 |
1.5–2.4 |
<1.5 or >4.5 |
0.35 |
|
Annual Rainfall |
mm/year |
< 1,000 |
1,000–1,500 |
1,501–2,000 |
>2,000 |
0.28 |
|
Average Temperature |
℃ |
28–34 |
25–27 |
22–24 |
<22 or >34 |
0.18 |
|
Land Slope |
% |
0–2 |
3–5 |
6–10 |
>10 |
0.11 |
|
Distance to Coastline |
m |
0–500 |
501–1,500 |
1.500–3,000 |
>3,000 |
0.08 |
2.3 Geographic Information System-based Multi-Criteria Decision Analysis
To accurately identify potential zones for economic cluster expansion, we executed a GIS-MCDA utilizing an Analytical Hierarchy Process (AHP) matrix to calculate parameter weights [12, 13]. Biophysical datasets were filtered through explicit threshold classification rules to divide land suitability into four standardized tiers: Highly Suitable ($S 1$), Moderately Suitable ($S 2$), Marginally Suitable ($S 3$), and Unsuitable ($N$) [17, 18].
The suitability model incorporates five biophysical criteria: salinity, annual rainfall, land slope, distance to the coastline, and average air temperature. We evaluated the pairwise comparison matrices against expert validation protocols, strictly maintaining an AHP Consistency Ratio ($CR$) below 0.10 to eliminate systematic weighting bias [19]. Final map boundaries and regional acreage totals were calculated using weighted linear combination overlays within QGIS software.
Pairwise comparison matrices were verified against an expert-judgment consensus model, strictly maintaining a $CR$ below 0.10 to eliminate systematic bias. The final suitability map layer was generated via a Weighted Linear Combination (WLC) aggregation overlay, with total spatial geometry area calculations executed within QGIS software.
2.4 Socio-demographic sampling and statistical modeling
Primary socioeconomic data were compiled through a purposive sampling strategy targeting smallholder solar salt farmers across the ten target provinces. To ensure statistical power and modeling precision, we applied a strict data-screening protocol to the field survey pool. Out of 300 original farmer observations, 25 profiles were permanently excluded due to incomplete answers, internal tracking contradictions, or extreme multivariate outliers. This screening process yielded a finalized dataset of 275 valid observations for inferential evaluation.
We constructed a binary logistic regression model to evaluate individual technology adoption decisions, setting geomembrane adoption as the binary dependent variable ($Geomembrane$ $=1$, $Traditional$ $Clay$ $Bed$ $=0$). Predictor variables include farmer age, education level, landholding size, cooperative participation, and access to extension counseling. Model stability was validated using Variance Inflation Factors (VIF), which were restricted below 2.5 to rule out multicollinearity, while overall predictive fit was verified via the Hosmer-Lemeshow test.
2.5 Climate-controlled productivity evaluation
Direct comparative $t$-tests comparing traditional methods and geomembrane systems face severe confounding risks from multi-provincial climate variations, seasonal lengths, and differing baseline pond layouts. To isolate true technological performance gains from environmental noise, this study replaces simple unstratified testing with a climate-controlled analysis.
We implemented multiple linear regression modeling alongside stratified $t$-tests to evaluate seasonal productivity (expressed in tons/ha/season). By embedding provincial climate parameters-specifically seasonal rainfall totals and average regional temperatures-alongside operational farm characteristics (such as cultivated land area size) as continuous control variables, the model isolates the net technological impact of geomembranes. Performance gains are reported with 95% confidence intervals (CI) and practical effect sizes (Cohen's $d$) to ensure mathematical rigor.
2.6 System dynamics simulation setup
To project the long-term macroeconomic impacts of the proposed integrated cluster interventions, we developed a mathematical Stock and Flow simulation model using Vensim PLE software. To resolve the timeline contradictions identified in the original draft text, both the model architecture and all reported simulation outcomes are structurally locked to a uniform, long-term planning horizon spanning from 2025 to 2035. The system boundary coordinates causal loops and dynamic interactions between salt production capacity, technology adoption velocity, cooperative participation rates, market prices, and net smallholder household incomes. The simulation was parameterized using the spatial constraints derived from the GIS-MCDA step and calibrated utilizing the socio-institutional adoption weights generated by the logistic regression model.
3.1 Socio-demographic and baseline production profiles
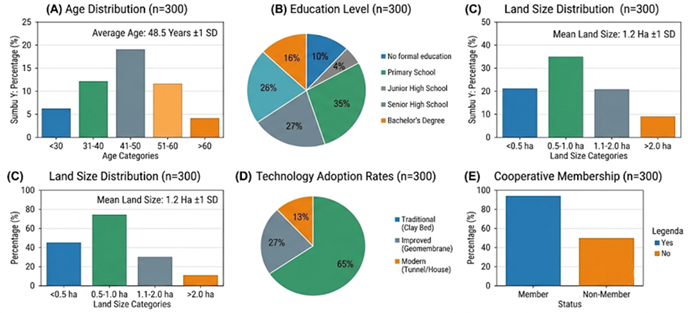
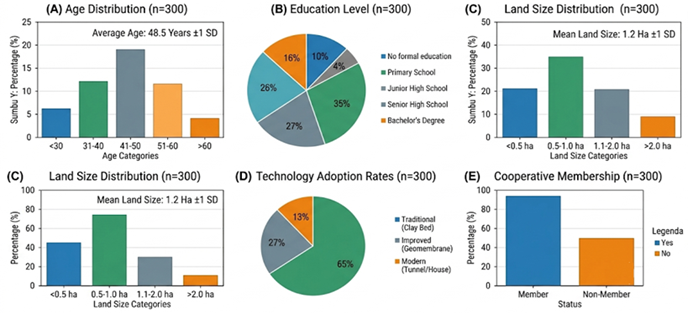
The baseline data highlights several technical and socioeconomic gaps across the sample population. Out of the 300 original respondents, data screening left 275 valid observations for inferential statistical analysis. The descriptive profile shows an experienced but aging workforce, with an average age of 48.5 years and a mean farming experience of 22.3 years.
Table 2. Distribution of highly suitable ($S 1$) land for salt clusters
|
Province |
Region Classification |
Calculated S1 Area (Hectares) |
|
East Java |
Volume-based Cluster |
5,200 |
|
Central Java |
Volume-based Cluster |
2,800 |
|
East Nusa Tenggara (NTT) |
Volume-based Cluster |
2,100 |
|
South Sulawesi |
Volume-based Cluster |
1,800 |
|
West Java |
Volume-based Cluster |
1,500 |
|
West Nusa Tenggara (NTB) |
Volume-based Cluster |
1,100 |
|
Aceh |
Value-based Cluster |
400 |
|
Gorontalo |
Value-based Cluster |
300 |
|
DI Yogyakarta |
Value-based Cluster |
150 |
|
Bali |
Value-based Cluster |
150 |
|
Total Accumulated Area |
National Scale |
15,500 |
Human capital and institutional participation remain low; 70% of the sampled farmers possess a formal education level of junior high school or below, and only 35% hold active memberships in local salt cooperatives. Production plots are relatively fragmented, averaging 1.2 hectares per farm, though a majority (60%) operate on self-owned land. Traditional open clay-bed evaporation methods dominate the landscape at 55%, while modern geomembrane systems account for 37%, and the remaining small fraction utilizes tunnel or salt house technologies that was presented in Figure 1.
Figure 1. Socio-demographic and technical profile of sample salt farmers (n = 300)
3.2 Geospatial land suitability rankings
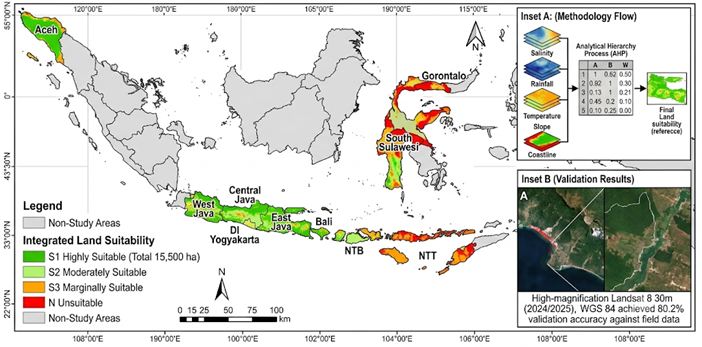
The GIS-MCDA framework processed the biophysical and environmental criteria layers across the ten designated provinces. Weighted linear combination analysis identified a total aggregate area of 15,500 hectares matching the Highly Suitable ($S 1$) classification for future community-based salt economic cluster expansion. Table 2 details the spatial distribution and geometric area calculations across the ten provinces.
The following is a graphic depicting the Geospatial Analysis of Land Suitability for Coastal Salt Clusters (n = 10 Provinces), presented in Figure 2.
Figure 2. Geospatial analysis of land suitability for coastal salt clusters (n = 10 provinces)
3.3 Quantified productivity gains (controlled analysis)
The climate-controlled analysis isolates the performance differences between conventional systems and modernized evaporation setups. The controlled evaluation confirms that transitioning from traditional clay beds to geomembrane technology delivers a statistically significant increase in seasonal output.
The empirical mean productivity for geomembrane-lined ponds reaches 105.3 tons/ha/season, contrasting with the 65.8 tons/ha/season recorded for traditional clay-bed setups. The isolated mean productivity gain stands at 39.5 tons/ha/season. The large effect size (Cohen's d = 2.18) combined with a narrow 95% CI validates that this productivity increase is driven by the technological upgrade rather than environmental background noise. The following is a Comparison of Productivity Between Traditional and Geomembrane Systems, presented in Table 3.
Table 3. Comparison of productivity between traditional and geomembrane systems
|
Technology Group |
Sample Size ($n$) |
Mean Productivity (Tons/ha/Season) |
Standard Deviation |
t-Value |
$d f$ |
p-Value |
95% Confidence Interval (CI) |
Effect Size (Cohen's $d$) |
|
Traditional |
165 |
65.8 |
15.2 |
-12.543 |
273 |
< 0.001 |
33.4 to 45.6 |
2.18 |
|
Geomembrane |
110 |
105.3 |
20.5 |
|
|
|
|
|
3.4 Socio-economic drivers of technology adoption
The binary logistic regression model screens the socio-institutional factors that influence whether a farmer adopts geomembrane technology. Multicollinearity diagnostics show acceptable stability, with all VIF resting below 2.5. The Hosmer-Lemeshow test yields a p-value greater than 0.05, verifying a reliable predictive model fit that explains approximately 42% of the adoption variance (Nagelkerke $R^2=0.42$) with an overall classification accuracy of 78.5%. The following are Binary Logistic Regression Results for Geomembrane Technology Adoption, presented in Table 4.
Cooperative membership emerges as the most powerful statistical determinant of technology uptake. Farmers holding active cooperative memberships are more than four times as likely to adopt geomembrane modernizations compared to non-members (Odds Ratio $=4.482, p<0.001$). Formal education levels at or above high school $(O R=3.490)$ and regular access to technical extension services $(O R=2.586)$ also exert strong positive influences on adoption behavior. Conversely, farmer age has a small but statistically significant negative coefficient $(B=-0.035, p=0.019)$, indicating that younger operators adapt more readily to modernization.
3.5 System dynamics simulation outcomes (horizon 2025–2035)
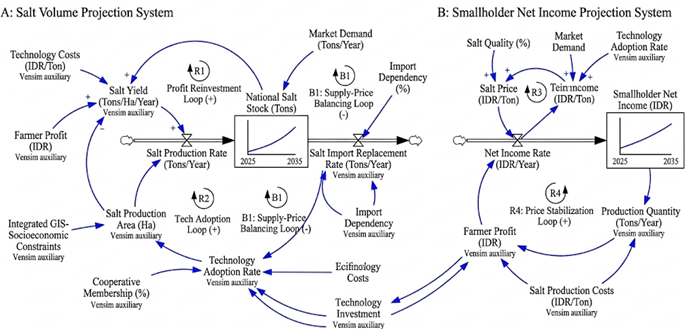
Integrating the 15,500 hectares of $S 1$ spatial boundaries as physical constraints and the regression-derived kelembagaan multipliers into the Vensim SDs model generates long-term macroeconomic projections across a uniform 2025-2035 horizon that was presented in Figure 3.
The simulation shows that combining spatial cluster expansion with target institutional support accelerates technology adoption velocities across the ten provinces. Driven by the 60% average yield improvement verified in the controlled trials, aggregate national solar salt production volumes follow a steady upward trajectory. Under this unified implementation policy, the model projects a consistent increase in smallholder net household income ranging from 60% to 75% by the target year 2035 compared to the business-as-usual baseline. This growth is maintained by quality improvements that allow raw yields to qualify for higher-paying consumption and food industry processing markets.
Figure 3. System dynamics (SDs) stock and flow simulation pathways for national salt volume projections (2025-2035)
Table 4. Binary logistic regression results for geomembrane technology adoption
|
Independent Predictor Variables |
Coefficient (B) |
Standard Error (SE) |
Wald |
df |
Significance (p) |
Odds Ratio (Exp(B)) |
|
Cooperative Membership (Yes) |
1.500 |
0.400 |
14.06 |
1 |
< 0.001 |
4.482 |
|
Education Level ($\geq$ High School) |
1.250 |
0.450 |
7.72 |
1 |
0.005 |
3.490 |
|
Access to Counseling (Yes) |
0.950 |
0.350 |
7.37 |
1 |
0.007 |
2.586 |
|
Land Area Size (Hectares) |
0.850 |
0.300 |
8.03 |
1 |
0.004 |
2.340 |
|
Age of Farmer (Years) |
-0.035 |
0.015 |
5.48 |
1 |
0.019 |
0.966 |
|
Constant |
-2.500 |
0.800 |
9.77 |
1 |
0.002 |
0.082 |
4.1 The SEGAR conceptual model strategy
The empirical findings from this study validate the design of the Integrated and Sustainable Community Salt Business Area (SEGAR Cluster Model). Identifying 15,500 hectares of highly suitable ($S 1$) land provides a concrete geographical foundation that prevents the fragmented, uncoordinated land-use practices common in previous development schemes. By targeting volume-based clusters in areas like East Java and East Nusa Tenggara, and value-based clusters in land-constrained areas like Aceh and Yogyakarta, the framework aligns physical land capability with regional market dynamics. The SDs simulation demonstrates that this structured clustering approach yields a consistent 60% to 75% increase in net farmer income by the 2035 horizon, proving that linking spatial data directly to socio-institutional scaling mechanisms outperforms isolated technological or financial interventions.
4.2 Technical and environmental mechanisms of smart salt farming
The significant productivity leap from 65.8 to 105.3 tons/ha/season demonstrated in our results is fundamentally driven by specific biophysical and thermodynamic changes engineered by geomembrane linings. Traditional clay beds suffer from high thermal dissipation into the underlying soil substrate, slowing down evaporation rates. In contrast, geomembrane linings maximize solar radiation absorption and trap heat within the brine layer, maintaining significantly higher water temperatures and accelerating salt crystallization rates [3, 20, 21].
From an environmental standpoint, the geomembrane serves as an impermeable barrier that blocks direct contact between the processing seawater and the ground soil. This configuration isolates the crystallization process from soil-borne heavy metals and pollutants, yielding high-purity salt that meets the standard of $\geq$95% NaCl required for food and industrial substitution. Concurrently, this barrier function prevents localized soil salinization and mitigates subsurface leakage risks in zones characterized by high groundwater vulnerability [20, 22, 23].
Crucially, modernizing salt fields with geomembranes shifts production towards a sustainable, zero-waste operation. Traditional farms often discard bittern as a waste stream, causing localized marine toxicity. The smooth, non-porous surface of geomembrane systems simplifies the collection, concentration, and systematic reuse of bittern within a closed loop, aligning directly with zero-liquid-discharge (ZLD) principles [24, 25]. This method allows for the recovery of valuable chemical byproducts, such as magnesium and potassium salts, minimizing the industrial footprint of smallholder operations while diversifying secondary revenue streams [25, 26].
4.3 Cross-national cluster evaluation
To contextualize Indonesia's salt sector transformation, Table 5 compares the governance and scale efficiencies of the proposed SEGAR model against dominant international salt industry architectures. Linkages within smallholder-driven cooperative networks, such as those found in Gujarat, India, highlight the power of decentralized clustering to foster collective efficiency and flexible market specialization among small enterprises [27, 28]. However, as observed in both Indian and Indonesian traditional sectors, smallholder-only clusters frequently face severe scale-efficiency ceilings due to restricted technical capital, fragmented landholdings, and weak financial backing [29, 30].
Conversely, large-scale corporate clusters in Shandong, China, and Western Australia optimize scale efficiency and global cost-competitiveness through heavy research and development investments, advanced automation, and deep vertical integration [31]. Yet, these highly centralized corporate models carry high social costs, frequently creating monopolistic landscapes that displace traditional artisanal producers and reduce local community inclusivity [32]. The following is the Cross-National Cluster Evaluation, presented in Table 5.
Table 5. Cross-national cluster evaluation
|
Country/Cluster Model |
Governance Structure |
Scale Efficiency |
Social Inclusivity & Market Target |
Ref. |
|
Indonesia (Proposed SEGAR Model) |
Inclusive, decentralized smallholder cooperatives driven by targeted state multi-stakeholder interventions. |
High potential efficiency; optimizes output by binding spatial GIS constraints to dynamic technology adoption parameters. |
High community inclusivity; prioritizes smallholder equity and domestic industrial import replacement. |
[29] |
|
India (Gujarat Cluster) |
Decentralized, community-driven cooperative networks relying on flexible specialization and asset pooling. |
Moderate efficiency; limited by individual capital caps and highly dependent on external technical and state financial support. |
High inclusivity; preserves traditional livelihoods while targeting domestic consumption and regional markets. |
[28, 30] |
|
Australia (Western Australia) |
Corporate-led, highly centralized private ownership focusing on internal company logistics. |
Maximum efficiency; powered by heavy automated infrastructure, large solar saltfields, and intensive R&D investments. |
Low inclusivity; relies entirely on industrial-scale corporate setups, risking the displacement of artisanal producers; highly export-oriented. |
[33] |
|
China (Shandong Cluster) |
Centralized, vertically integrated alliances combining state-owned enterprises and large private corporations. |
High efficiency; optimized through large industrial scales, lean processing systems, and tight upstream-downstream coupling. |
Low-to-moderate inclusivity; prioritizes centralized growth targets, carrying high risks of monopolization and local artisanal mining exclusion. |
[34] |
The proposed framework resolves this trade-off. By integrating high-Technology Readiness Level (TRL) geomembrane modernizations into an inclusive cooperative governance framework, the SEGAR model achieves the technological precision and quality standards of corporate systems without sacrificing smallholder land ownership or coastal social equity.
4.4 Policy roadmap and national flagship research agenda
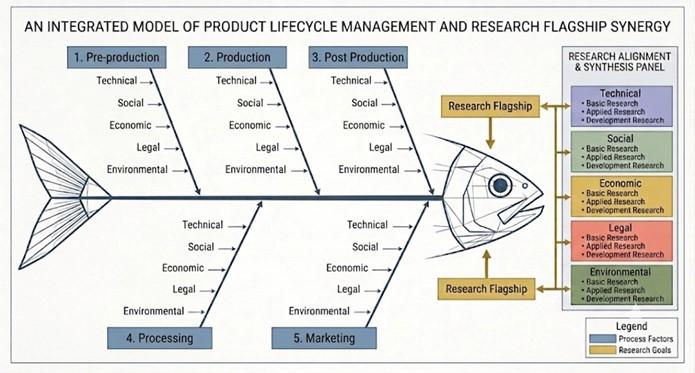
Our binary logistic regression model identified cooperative membership as the strongest predictor of technology uptake ($Odds Ratio$ $=4.482$), proving that technology transfer cannot rely on linear, individualistic dissemination models. Implementing the multi-year Nusantara Sea Salt Blueprint (NSSB) requires moving away from conventional top-down policies that exclude community perspectives, which historically cause marginalization, resistance, and conflicts within marine spatial planning frameworks [35-37]. Sectoral policy fragmentation between fisheries management, industrial trade regulations, and agrarian land reforms routinely undermines long-term developmental blueprints [38, 39].
To counter these structural bottlenecks, the proposed fishbone research roadmap operates as a polycentric, non-linear innovation system. By embedding academic research centers, the National Research Agency (BRIN), and smallholder cooperatives into an interconnected multi-stakeholder network, the framework bridges central governance institutions and local coastal actors [40, 41]. Cooperative networks serve as institutional hubs that handle data verification, pool capital to mitigate economic stressors, and deliver continuous technical training, resolving the education and awareness deficits that typically halt technology transfer in developing maritime economies [42-44].
The following is the Proposing Nusantara Sea Salt Blueprint (NSSB) Research Flagship Fishbone for Indonesian Salt Independence, presented in Figure 4.
Figure 4. Proposing Nusantara Sea Salt Blueprint (NSSB) Research Flagship Fishbone for Indonesian Salt Independence
4.5 Framework limitations and future paths
Despite its robust integration, several boundaries limit the immediate generalizability of this framework. First, while geomembrane technology significantly elevates salt yields and purities, long-term material exposure to solar UV radiation and hypersaline friction introduces risks of polymer degradation and subsequent microplastic contamination in the harvested salt [22, 45]. Future flagship research must prioritize the material science engineering of bio-based or highly durable solar evaporators to eliminate microplastic shedding risks [26].
Second, the high initial capital investment required for geomembrane installation and cluster infrastructure remains a steep entry barrier for independent, small-scale operators living under acute socioeconomic stressors [21, 46, 47]. Consequently, the success of the SDs projection remains highly dependent on sustained government financial subsidies and targeted credit incentives through institutional banking channels.
Finally, our cross-sectional research design captures socio-demographic and environmental conditions within a single time bracket. Future research directions should deploy longitudinal tracking and agent-based modeling to better map shifting socio-cultural traditions, community trust dynamics, and the evolving impacts of macro-stressors like sea-level rise and saltwater intrusion on smallholder behavioral adaptation.
This study successfully developed and evaluated an integrated GIS-socioeconomic framework that delivers a clear, data-driven pathway toward national salt self-sufficiency. Addressing the primary research objectives, the geospatial framework processed 2024/2025 biophysical data to identify a total aggregate area of 15,500 hectares of Highly Suitable ($S 1$) land across ten provinces, establishing a precise boundary condition for structured cluster expansion. Within these production zones, the climate-controlled evaluation isolated a substantial quantitative advantage for technological modernization, proving that transitioning from traditional clay beds to geomembrane systems drives a statistically significant productivity leap from 65.8 to 105.3 tons/ha/season.
However, the inferential behavioral analysis demonstrates that technical efficiency gains are structurally bounded by socio-institutional readiness. Active cooperative membership emerged as the most critical determinant of technology uptake, increasing adoption likelihood more than fourfold with an OR of 4.482. Consequently, targeted institutional strengthening serves as a vital prerequisite to trigger technological leapfrogging, enabling traditionally structured, fragmented smallholder networks to pool resource capital, overcome high upfront costs, and transition to sustainable, zero-waste production systems. Beyond the Indonesian context, this integrated spatial-socioeconomic model provides a highly scalable and replicable framework for other developing maritime economies seeking to bridge laboratory-scale innovations with large-scale industrial applications, mitigate external import vulnerabilities, and execute evidence-based coastal development policies.
We thank the Ministry of Marine Affairs and Fisheries of the Republic of Indonesia for the support and for providing the relevant essential data for this research. Thanks also to the Salt Science Laboratory and the Integrated Lab. Universitas Trunojoyo Madura for the support of workforce and data in this research. This research is funded by the Indonesian Endowment Fund for Education (LPDP) on behalf of the Indonesian Ministry of Higher Education, Science and Technology and managed under the EQUITY Program (Contract No. 4300/B3/DT.03.08/2025; No. 297/UN3/HK.07.00/2025; and No. 5491/B/UN3.LPPM/PT.01.03/2025).
[1] Kurniawan, A., Syafi'i, M.I., Ardian, G., et al. (2019). Continuously dynamic mixing (CDM) method and greenhouse salt tunnel (GST) technology for sea salt production throughout the year [metode continuously dynamic mixing (CDM) dan teknologi greenhouse salt tunnel (GST) untuk produksi garam sepanjang tahun]. Jurnal Ilmiah Perikanan dan Kelautan, 11(2): 82-91. https://doi.org/10.20473/jipk.v11i2.13480
[2] Mahabror, D. (2021). Study of the weather parameters effect on the Maduris salt production. IOP Conference Series: Earth and Environmental Science, 718(1): 012033. https://doi.org/10.1088/1755-1315/718/1/012033
[3] Wiwoho, G., Prasada, I.Y. (2024). Geomembrane-based salt production method to increase the quantity and quality of small-scale salt producer. MethodsX, 13: 102803. https://doi.org/10.1016/j.mex.2024.102803
[4] Muslimah, Wahyuningsih, P., Yusnawati, Y. (2024). Analisis kualitas garam lokal di kabupaten aceh timur dengan berbagai metode pengolahan garam. Jurnal Ilmu dan Teknologi Kelautan Tropis, 16(1): 47-61. https://doi.org/10.29244/jitkt.v16i1.40153
[5] Rahmat, Y., Neilson, J., Langford, A., et al. (2025), Fluid institutions of access: Sea space as a livelihood resource in coastal Indonesia. Journal of Agrarian Change, 25: e12617. https://doi.org/10.1111/joac.12617
[6] Muhandhis, I., Susanto, H., Asfari, U. (2019). Development of system dynamics model to increase salt fulfillment ratio. Procedia Computer Science, 161: 867-875. https://doi.org/10.1016/j.procs.2019.11.194
[7] Khozaimi, A., Pramudita, Y.D., Rochman, E.M.S., Rachmad, A. (2020). Decision support system for determining the quality of salt in Sumenep Madura-Indonesia. Journal of Physics: Conference Series, 1477(5): 052057. https://doi.org/10.1088/1742-6596/1477/5/052057
[8] Montojo, U.M., Banicod, R.J.S., Tadifa, G.C., et al. (2024). Status of the salt industry in the Philippines: Production, challenges, and opportunities. The Philippine Journal of Fisheries, 31(1): 59-78. https://doi.org/10.31398/tpjf/31.1.2023A0008
[9] Santos-Larrazabal, J., Basterretxea, I., Fernández-Sainz, A. (2025). Intercooperation and open innovation: Unleashing cooperative firms' innovation potential. Annals of Public and Cooperative Economics, 1-21. https://doi.org/10.1111/apce.70030
[10] Boumali, N.E.I., Mamine, F., Cheriet, F., Montaigne, E. (2023). Performances of innovative agricultural cooperatives: The case of Nopaltec for the development of prickly pear in Algeria. Cahiers Agricultures, 32: 3. https://doi.org/10.1051/cagri/2022034
[11] Mbũgwa, G.W., Prager, S.D., Krall, J.M. (2015). Utilization of spatial decision support systems decision-making in dryland agriculture: A Tifton burclover case study. Computers and Electronics in Agriculture, 118: 215-224. https://doi.org/10.1016/j.compag.2015.09.008
[12] Mohamed, A.H., Shendi, M.M., Awadalla, A.A., Mahmoud, A.G., Semida, W.M. (2019). Land suitability modeling for newly reclaimed area using GIS-based multi-criteria decision analysis. Environmental Monitoring and Assessment, 191(9): 535. https://doi.org/10.1007/s10661-019-7649-z
[13] Assefa, W.W., Abebe, W.B. (2018). GIS modeling of potentially suitable sites for aquaculture development in the Lake Tana basin, Northwest Ethiopia. Agriculture & Food Security, 7(1): 72. https://doi.org/10.1186/s40066-018-0222-0
[14] Ribeiro, N. (2024). Geospatial analysis for decision support, suitability assessment for value chain infrastructure interventions. In 2024 12th International Conference on Agro-Geoinformatics (Agro-Geoinformatics), Novi Sad, Serbia, pp. 1-6. https://doi.org/10.1109/Agro-Geoinformatics262780.2024.10661066
[15] Kristjanson, P., Okike, I., Tarawali, S., Singh, B.B., Manyong, V.M. (2005). Farmers' perceptions of benefits and factors affecting the adoption of improved dual-purpose cowpea in the dry savannas of Nigeria. Agricultural Economics, 32(2): 195-210. https://doi.org/10.1111/j.0169-5150.2005.00338.x
[16] Adebiyi, J.A., Olabisi, L.S. (2022). Participatory causal loop mapping of the adoption of organic farming in Nigeria. Environmental Management, 69(2): 410-428. https://doi.org/10.1007/s00267-021-01580-w
[17] Halder, B., Bandyopadhyay, J., Sandhyaki, S. (2024). Impact assessment of environmental disturbances triggering aquaculture land suitability mapping using AHP and MCDA techniques. Aquaculture International, 32(2): 2039-2075. https://doi.org/10.1007/s10499-023-01257-7
[18] Radiarta, I.N., Saitoh, S.I., Miyazono, A. (2008). GIS-based multi-criteria evaluation models for identifying suitable sites for Japanese scallop (Mizuhopecten yessoensis) aquaculture in Funka Bay, southwestern Hokkaido, Japan. Aquaculture, 284(1-4): 127-135. https://doi.org/10.1016/j.aquaculture.2008.07.048
[19] Rekha, P.N., Gangadharan, R., Ravichandran, P., Mahalakshmi, P., Panigrahi, A., Pillai, S.M. (2015). Assessment of impact of shrimp farming on coastal groundwater using geographical information system based analytical hierarchy process. Aquaculture, 448: 491-506.
[20] Agrawal, E., Kumar, R., Malviya, J. (2025). Geomembrane-based salt production: A sustainable and efficient approach for enhanced yield and environmental protection. AIP Conference Proceedings, 3342: 050021. https://doi.org/10.1063/5.0296795
[21] Rahmi, R., Syarif, A., Ibrahim, J., et al. (2025). Increasing the income of salt pond farmers in Bulu Cindea village thought the development of geo-membrane technology. IOP Conference Series: Earth and Environmental Science, 1482(1): 012047. https://doi.org/10.1088/1755-1315/1482/1/012047
[22] Nilawati, Mukimin, A., Djayanti, S. (2023). The effect of geomembrane plastic usage on Microplastic and heavy metal contamination in salt field. In IOP Conference Series: Earth and Environmental Science, 6th International Symposium on Green Technology for Value Chains, Online, Indonesia, 1201(1): 012054. https://doi.org/10.1088/1755-1315/1201/1/012054
[23] Mukunoki, T., Nagata, K., Otani, J, Shigetoku, M. (2010). Evaluation of leakage behavior through defected geomembranes using X-ray CT and numerical analysis. In International Conference on Geosynthetics, Brazil, pp. 947-950. https://library.geosyntheticssociety.org/wp-content/uploads/resources/proceedings/Evaluation%20of%20leakage%20behavior%20through%20defected%20geomembranes%20using%20X-ray%20CT%20and%20numerical%20analysis.pdf.
[24] Alnouri, S.Y., Linke, P., El-Halwagi, M.M. (2018). Accounting for central and distributed zero liquid discharge options in interplant water network design. Journal of Cleaner Production, 171: 644-661. https://doi.org/10.1016/j.jclepro.2017.09.236
[25] Pan, W., Yang, Y.C., Yang, D.M., et al. (2023). A novel eco-friendly circular approach to comprehensive utilizing bittern waste and oyster shell. Processes, 11(4): 1209. https://doi.org/10.3390/pr11041209
[26] Zhao, X.P., Wang, Z.M., Li, J., et al. (2024). Large-area, low-cost, highly durable solar evaporators for sustainable solarizing seawater. Chemical Engineering Journal, 494: 153079. https://doi.org/10.1016/j.cej.2024.153079
[27] Dijk, M.P. (2005). Classifying small enterprise clusters: A conceptual enquiry in Ahmedabad. In Indian Industrial Clusters, Routledge, p. 12. https://www.taylorfrancis.com/chapters/edit/10.4324/9781315252438-13/classifying-small-enterprise-clusters-conceptual-enquiry-ahmedabad-meine-pieter-van-dijk.
[28] Dervillé, M., Manriquez, D., Dorin, B., Aubron, C., Raboisson, D. (2023). Indian dairy cooperative development: A combination of scaling up and scaling out producing a center-periphery structure. World Development, 170: 106249. https://doi.org/10.1016/j.worlddev.2023.106249
[29] Amril, Kasnir, M., Asbar, Tamsil A., Rusli A., Abdullah I., Wamnebo M.I. (2026). Advancing sustainability in coastal smallholder salt production: A Rapfish and Monte Carlo assessment from Eastern Indonesia. AACL Bioflux, 19(2): 739-757. https://bioflux.com.ro/docs/2026.739-757.pdf.
[30] Sharma, S., Sharma, M. (2010). Analyzing the technical and scale efficiency of small industries in India: State-wise cluster study. Measuring Business Excellence, 14(2): 54-65. https://doi.org/10.1108/13683041011047867
[31] Vargas, M., Mosquera, R., Fuertes, G., Alfaro, M., Perez Vergara, I.G.P. (2024). Process optimization in a condiment SME through improved lean six sigma with a surface tension neural network. Processes, 12(9): 2001. https://doi.org/10.3390/pr12092001
[32] Atta-Quayson, A. (2023). New extractivism in Ghana's salt sector. CCS Journal, 15(1): 19-32. https://doi.org/10.5130/ccs.v15.i1.8437
[33] Mason, C.M., Ayre, M., Burns, S.M. (2022). Implementing industry 4.0 in Australia: Insights from advanced Australian manufacturers. Journal of Open Innovation: Technology, Market, and Complexity, 8(1): 53. https://doi.org/10.3390/joitmc8010053
[34] Li, W., Hendrischke, H. (2020). Local integration and co-evolution of internationalizing Chinese firms. Thunderbird International Business Review, 62(4): 425-439. https://doi.org/10.1002/tie.22137
[35] Reis-Filho, J.A., Hatje, V., Barros, F. (2024). Navigating blue justice: Policy gaps and conflicts in coastal development from small-scale fisher perspectives. One Earth, 7(10): 1786-1802. https://doi.org/10.1016/j.oneear.2024.07.014
[36] Gasalla, M.A., Gandini, F.C. (2016). The loss of fishing territories in coastal areas: The case of seabob-shrimp small-scale fisheries in São Paulo, Brazil. Maritime Studies, 15(1): 9. https://doi.org/10.1186/s40152-016-0044-2
[37] Ayilu, R.K. (2023). Limits to blue economy: Challenges to accessing fishing livelihoods in Ghana's port communities. Maritime Studies, 22(2): 11. https://doi.org/10.1007/s40152-023-00302-8
[38] Hidayati, D.R., De Vries, W.T. (2025). Connecting the dots between blue economic development and coastal community development using a seaweed case study in Madura, Indonesia. Discover Sustainability, 6(1): 1346. https://doi.org/10.1007/s43621-025-02264-9
[39] Tocco, C.L., Frehen, L., Forse, A., Ferraro, G., Failler, P. (2024). Land-sea interactions in European marine governance: State of the art, challenges and recommendations. Environmental Science & Policy, 158: 103763. https://doi.org/10.1016/j.envsci.2024.103763
[40] Jokhu, J.R., Fernando, A., Hamzah, D.A., Mangkurat, R.S.B. (2025). Integrating community empowerment, ecotourism, and maritime resilience for a sustainable blue economy. Maritime Technology and Research, 7(4): 279344. https://doi.org/10.33175/mtr.2025.279344
[41] Raha, D., Davies-Vollum, K.S., Hemstock, S.L., Boateng, I., Islam, M.T., Pierce, C.A.E. (2024). We need collaboration and co-creation to address challenges facing coastal communities. Nature Human Behaviour, 8(5): 814-822. https://doi.org/10.1038/s41562-024-01875-y
[42] Tahsin, R., Rantu, S.B.A., Rahman, M., Salman, S., Karim, M.R. (2025). Towards the adoption of AI, IoT, and Blockchain technologies in Bangladesh's maritime industry: Challenges and insights. Results in Engineering, 25: 103825. https://doi.org/10.1016/j.rineng.2024.103825
[43] Budiman, I., Wagemakers, A., Derks, M., Sahara, Moore, S. (2024). Socio-environmental systems in technology adoption in animal husbandry in South-East Asia: A framework synthesis approach. NJAS: Impact in Agricultural and Life Sciences, 96(1): 2349518. https://doi.org/10.1080/27685241.2024.2349518
[44] Hariyadi, E., Johari, S.M., Agustiyani, T.U. (2025). The role of agri-tech innovation in enhancing food security and farmer income in developing economies. BIO Web of Conferences, 201: 05011. https://doi.org/10.1051/bioconf/202520105011
[45] Dwiyitno, D., Sturm, M.T., Januar, H.I., Schuhen, K. (2021). Influence of various production methods on the microplastic contamination of sea salt produced in Java, Indonesia. Environmental Science and Pollution Research, 28(23): 30409-30413. https://doi.org/10.1007/s11356-021-14411-6
[46] Prihantini, C.I., Hanani, N., Syafrial, S., Asmara, R. (2024). Environmental-socioeconomics factors and technology adoption: Empirical evidence from small-scale salt farmers in improving technical efficiency in madurese coastal area, East Java, Indonesia. Preprints. https://doi.org/10.20944/preprints202405.1660.v1
[47] Wang, H., Li, F.Q., Zou, Y.H., Yang, M.S., Chen, Z.P., Nie, X. (2024). How do smallholder farmers run towards agricultural modernization under multiple stressors in China's coastal zones: An agent-based modeling approach. Environment, Development and Sustainability, 28(5): 11809-11835. https://doi.org/10.1007/s10668-024-05429-0