Fawwaz Tawfiq Awamleh* | Basema Mohammad Salem Abu Jaber | Ala Fathi Assi
© 2026 The authors. This article is published by IIETA and is licensed under the CC BY 4.0 license (http://creativecommons.org/licenses/by/4.0/).
OPEN ACCESS
The current research looks at how big data analytics (BDA) affects sustainable performance (SP) by influencing business model innovation (BMI) in Jordanian telecommunication companies. The study is grounded in the resource-based view (RBV), dynamic capabilities theory (DCT), and stakeholder theory and proposes that BDA enhances firms’ ability to innovate their business models and then improve SP. A quantitative research design was utilised, and a structured questionnaire was distributed to managerial, operational, and IT/data analytics staff in the three Jordanian telecommunication companies (Zain, Orange, and Umniah). Data analysis was performed using Partial Least Squares Structural Equation Modelling (PLS-SEM) with SmartPLS 4 on 357 valid respondents. The results show that BDA has a strong positive effect on SP and BMI. Furthermore, BMI has a beneficial effect on SP and partially mediates the association between BDA and SP. The study contributes to the literature by giving actual evidence from the Jordanian communications sector and explaining how BDA translates into sustained success through BMI. The findings also offer practical advice to managers who wish to improve SP through data-driven innovation initiatives.
big data analytics, sustainable performance, business model innovation, Jordanian telecommunication companies
Fast growth of the digital technology landscape has caused radical changes in organizational activities, decision-making, and competition strategy. In today's fast-changing business world, organizations not only have to perform economically better but also have to meet their social and ecological responsibilities. Therefore, it is becoming more relevant to study how digital technology influences the sustainability of organizational results. The study of such issues is currently considered one of the priorities in the areas of management and information systems [1]. One of the most important digital technologies is big data analytics (BDA), which allows organizations to draw conclusions from vast amounts of structured and unstructured data and make decisions based on evidence, improving organizational performance [2]. However, despite the fast development of digital technologies, most studies of the current literature continue to concentrate on the technical and conceptual aspects of BDA without explaining its value as a sustainable tool [3].
Sustainability has gained greater strategic significance, resulting in further academic interest in determining the value of BDA to organizations. Sustainable performance (SP) has become a multi-dimensional goal, which implies that organizations need to be economically viable, socially responsible, and environmentally responsible at the same time. As indicated by prior research, analytical skills have always contributed to improving efficiency, making strategic decisions, and dealing with changes in the environment, all of which help achieve SP in an organization [4]. However, although prior literature has identified the relationships between BDA and organizational performance as positive, much less focus has been placed on the mechanism of transforming analytical skills into SP in organizations.
This issue requires further theoretical and empirical investigation. While previous literature has focused mainly on the impact of BDA on organizational performance, there has been little empirical support for the intermediary organizational mechanisms through which this happens [5]. Similarly, while the significance of organizational innovation in organizational performance cannot be overlooked, there has not been much research on how business model innovation (BMI) mediates the link between analytical capabilities and SP [6]. BMI facilitates the way organizations innovate their models to create value, deliver, and capture value to cope with technological innovations and changes in the market to enhance competitive advantage and sustainability [7, 8].
Bridging this gap is especially important in technology-intensive industries, where firms are continuously investing in digital transformation programs to enhance innovation and sustainability. The Jordanian telecommunications sector offers a favorable setting to examine these relations, as organizations operating in this sector work in a more competitive environment, with rapid technological progress, continuous digital investment, and growing expectations for sustainability. Understanding how analytical capabilities enable SP through BMI helps bridge theory and practice for businesses functioning in similar digital contexts.
This work makes the following contribution to the literature. First, it builds on prior research by investigating not just the direct relationship between BDA and SP but also the organizational processes through which this relationship occurs. Second, it provides empirical evidence on the mediating role of BMI, thus filling an important gap identified in previous studies [5-8]. Third, the paper contributes to the literature on digital transformation and sustainability by offering empirical evidence from Jordanian telecommunication enterprises, a significant but largely underexplored environment in the sustainability and information systems literature. Besides these theoretical contributions, the results offer practical implications to help managers to use analytical talents and BMI in order to achieve better sustainable organizational performance.
Hence, the fundamental aim of this study is to analyze the effect of BDA on SP and the mediating function of BMI in this relationship. For this purpose, the study uses Partial Least Squares Structural Equation Modeling (PLS-SEM) to analyze the postulated mediating model and to test the suggested correlations.
2.1 Theoretical foundation
To describe how companies convert analytical capabilities into sustainable organizational outcomes through innovation, a theoretical framework is needed. Previous research has found favorable correlations among BDA, BMI, and SP, but no single theory can explain the development of the interactions inside businesses. In this sense, this study contributes to the Resource-Based View (RBV), Dynamic Capabilities Theory (DCT) and Stakeholder Theory as these complementary perspectives capture the strategic value of analytical resources, the organizational processes through which analytical resources are converted into innovation, and their contribution to sustainable organizational performance.
The first theoretical perspective supporting the proposed research paradigm is the RBV, which explains how valuable organizational resources can provide competitive advantage and superior organizational performance. In this study, BDA is viewed as a strategic organizational competency that enables organizations to collect, process, and analyze information to support evidence-based decision-making and improve organizational performance [9]. Organizations are progressively using analytical capabilities to increase operational efficiency, improve the accuracy of forecasts, improve planning procedures and optimize organizational resources [10]. These capabilities further improve sustainability activities by allowing firms to recognize possible hazards, maximize resource consumption, and promote socially responsible decision-making [11]. Therefore, from the RBV perspective, analytical capabilities are significant strategic resources that generate sustainable competitive advantage when efficiently applied in the organizational operations [12]. However, BDA advantages are determined not just by the technology infrastructure but also by an organization’s capacity to leverage analytical talents in its strategic and operational processes [4].
RBV explains the strategic value of analytical talents but has little to say about how these capabilities are transformed into organizational change. This view is supported by the DCT, which emphasizes how companies can recognize new opportunities, take strategic actions, and constantly adjust their resources to adapt to changing technology and market conditions [13]. In this sense, BMI refers to the organizational mechanism via which organizations translate analytical insights into innovative ways of value creation, delivery, and capture [14]. BMI is the reconfiguration of organizational structures, customer interactions, revenue methods, and value propositions to enhance the competitiveness and organizational adaptability [11]. With firms facing digital disruption, BMI has become more crucial to capture technological opportunities and sustain competitive advantage [4]. Furthermore, innovation in the business model that is focused on sustainability makes it possible for firms to lessen their environmental impact while addressing broader social issues [15]. However, strategy reconfiguration generally necessitates organizational change, which, through BMI, can entail high uncertainty and implementation risks in organizational transformation [16].
The main goal of all these capabilities is achieved through SP. SP is an indication of an organisation's capacity to attain economic success in the long run while at the same time fulfilling its responsibilities to the environment and society [17]. In the current study, SP is defined as an organisational outcome that shows how well an organisation is responsible, efficient, and sustainable [18]. Considering the measurement scale applied and the study objectives, SP is operationalised as a unidimensional reflective construct and not as three dimensions estimated separately. Organisations that have SP use their resources responsibly, make strategic decisions and continuously improve their operations [19]. As such, stakeholder theory asserts that organisations can maintain legitimacy and sustainable success by creating value for various stakeholders, not just by achieving financial success [20]. Due to this, sustainability has become a very critical factor in measuring organisational performance and competitiveness, given the high expectations of stakeholders [14]. However, some scholars opine that sustainability becomes merely symbolic rather than substantive when organisations try to acquire legitimacy without changing their structures [11].
RBV, DCT, and Stakeholder Theory provide the basis for the developed research model. Specifically, the RBV helps to understand the value of BDA as a capability, DCT explains how an organisation creates BMI from that capability, and Stakeholder Theory illustrates how BMI leads to SP by creating value for various stakeholders.
2.2 Big data analytics and sustainable performance
BDA has become an organizational capability that provides the opportunity for better decision-making, improvement in the organization's efficiency, and enhancement in its SP by converting organizational data into meaningful information [19]. In line with the RBV theory, BDA is an important organizational capability that allows companies to develop sustainable competitive advantages through the proper use of data resources [12]. Apart from increasing the organizational performance level, analytical capabilities also help to achieve sustainability through resource efficiency, environmental management, and corporate social responsibility practices [2].
However, having large amounts of data does not guarantee SP improvement. It is also necessary for companies to have adequate analytical skills that allow them to transform their data into strategy-making and decision-making information [3]. Furthermore, organizational culture and the commitment of managers are crucial in the value creation of analytical capabilities. However, despite all these factors, numerous studies indicate that organizations with high BDA capabilities have higher sustainable organizational performance levels [10, 21]. Thus, the following hypothesis is put forward:
H1: BDA positively affects SP.
2.3 Big data analytics and business model innovation
Moreover, BDA enables organizations to recognize trends in the market, comprehend the behavior of customers, and optimize processes internally, resulting in new opportunities for innovative business models for companies [12]. According to the DCT, organizations with good analytical capabilities have more opportunities to discover new opportunities and reorganize their resources, making them capable of developing innovative business models [22]. With the help of analytics, organizations can redesign value creation, delivery, and capture activities, increase efficiency and promote environment-friendly and socially responsible business operations [9].
Although the approach is beneficial for organizations, some researchers claim that too much focus on quantitative analysis may restrict the creativity of the organization and its managers' flexibility in innovating business solutions [4, 23]. In addition, organizational inertia and managers' unresponsiveness may prevent an organization from innovating effectively because of an inability to transform analytical insights into BMI. Nonetheless, empirical research consistently shows a positive connection between BDA and BMI, and the higher analytical capabilities, the greater possibility of developing innovative and adaptive business models [3, 10]. Therefore, the following hypothesis formulated:
H2: BDA positively affects BMI.
2.4 Business model innovation and sustainable performance
Today, BMI has become an essential source of SP by facilitating the rethinking of value creation, delivery, and capture processes to achieve higher organisational effectiveness and sustainability benefits [4, 8]. In line with the DCT, organisations that innovate business models on a continuous basis become more adaptive to changes in the external environment, efficient in resource utilisation and competitive. Thus, BMI helps organisations decrease operational inefficiencies, increase resource efficiency and improve engagement of stakeholders, thereby fostering sustainable organisational performance [24].
In the context of sustainable development, business innovation embedded in the business model itself allows organisations to incorporate economic, environmental and social aims in their business activities instead of considering sustainability as an independent organisational initiative [1, 17]. However, some researchers think that changing business models might not improve sustainability because companies often focus on making money or face obstacles that make it challenging to adopt new ideas. Nonetheless, the empirical studies support a positive effect of BMI on SP [16, 25]. Thus, the following hypothesis is suggested:
H3: BMI positively affects SP.
2.5 Mediating role of business model innovation
While prior research has identified a positive link between BDA and SP, the exact organizational mechanism by which analytical capability leads to sustainability effects is underdeveloped [3]. This paper suggests that BMI should act as this mechanism by helping organizations use analytical insights to make changes that increase the organization's value creation, value delivery and value capture process [24]. Instead of improving SP directly, the strategic value of BDA can be seen in its ability to translate analytical knowledge into innovative business models that lead to organizational adaptation and sustainability.
The above-mentioned relationship is consistent with the DCT, which states that organizations can achieve superior performance through opportunity sensing by means of analytical capabilities and resource reconfiguration via innovation [20]. In other words, BMI acts as the organizational link between information created by BDA and sustainable organizational practices. However, certain researchers believe that the above relationship might be affected by context and that BMI could work as the complementary mechanism instead of being the mediator [26]. Nevertheless, most empirical evidence supports the mediating role of BMI in relation to the abovementioned relationship [16]. Therefore, organizations capable of integrating analytical capabilities and BMI are likely to achieve superior sustainability results [26, 27]. For this reason, the following hypothesis is proposed:
H4: BMI mediates the relationship between BDA and SP.
2.6 Conceptual research model
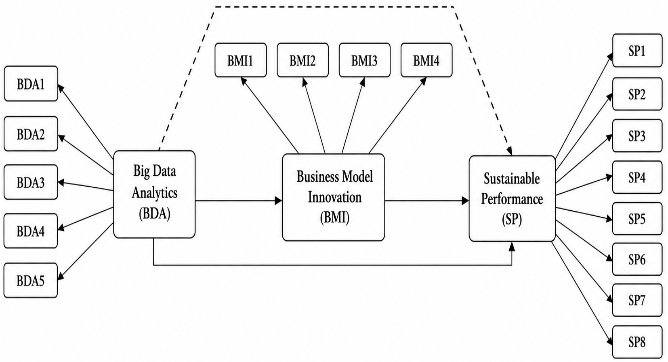
Figure 1 shows the conceptual research model developed for this study based on the integration of the RBV, DCT, and Stakeholder Theory and evidence from previous empirical studies [13, 21, 23, 26, 27]. The model shows the hypothesized links between BDA, BMI, and SP. Specifically, it suggests that BDA directly affects BMI and SP and that BMI directly affects SP. Moreover, the model shows that BMI mediates the association between BDA and SP.
Figure 1. Conceptual research model
3.1 Research design and study context
The study applied a quantitative approach and cross-sectional survey design to investigate the association between BDA, BMI, and SP in the Jordanian telecommunication sector. The quantitative research approach was chosen because it is appropriate for testing theoretical models, examining relationships between latent constructs, and empirically testing the study hypotheses presented with statistical tools. The cross-sectional survey strategy enabled the collection of data at a certain time. The approach is a useful way to study the employees’ perception of BDA capabilities, BMI methods, and SP.
The study was conducted in the telecommunications sector in Jordan and targeted the three major mobile network operators, which are Umniah, Zain Jordan, and Orange Jordan. The companies are chosen because they are the backbone of the telecommunication business in Jordan and because they are investing heavily in digital transformation, BDA, and innovation projects. Therefore, they provide a perfect context for the research model proposed in this paper.
The study examined constructs at the organizational level, while the analysis focused on individual employees. Personnel in managerial, operational, and IT/data analytics positions were surveyed as they are knowledgeable key informants with direct experience of their organizations’ analytical capabilities, creative approaches, and sustainability initiatives. The positions provided them with enough awareness of organizational processes and strategic methods to make reasonable judgments regarding the research constructs. The use of knowledgeable informants is a well-established and appropriate strategy in organizational and management research to collect firm-level information from experienced employees.
3.2 Population, sample, and pilot study
The study population was the employees of the three companies (Umniah, Zain Jordan and Orange Jordan). The chosen employees were working in administration, operations, information technology and data analytics as these are the roles that are directly involved in corporate decision-making and digital innovation initiatives. The respondents were chosen using purposive sampling according to their knowledge and hands-on experience in BDA and BMI. The study did not include personnel with less than 1 year of experience. The study used a purposive sampling approach since it studied specialised organisational competencies in which the respondents had to have direct experience in digital technologies, analytics, and organisational innovation [28].
Before the main survey, a pilot study with 23 employees was undertaken to test the clarity and comprehensibility of the questionnaire and its reliability. Minor modifications were performed based on the feedback of the participants, and all constructs showed satisfactory reliability (Cronbach’s alpha (CA) > 0.70). Pilot participants were eliminated from the final sample.
Data were collected between March and May 2026. A total of 400 questionnaires were sent through an online survey via LinkedIn, corporate websites and professional communication channels. A total of 357 valid questionnaires were included in the final analysis after the returned questionnaires were checked for completeness and consistency. The final sample comprised respondents from all three major Jordanian telecommunications companies: Zain Jordan (n = 132, 37.0%), Orange Jordan (n = 118, 33.1%), and Umniah (n = 107, 30.0%). The final sample was deemed sufficient for PLS-SEM analysis [29]. The demographic characteristics of the respondents are shown in Table 1. The sample included 55.5% of males and 44.5% of female respondents. Most respondents were aged between 30 and 39 years (39.5%) and had job experience between six and 10 years (38.1%). Moreover, the respondents held management, operational and IT/data analytics jobs, thereby giving a wide set of organisational views for the empirical investigation.
This study did not include control variables such as age, work experience, organisational tenure and company size of the respondents. The objective of the study is to investigate the direct and mediating effects of BDA on BMI and SP in the less diverse research environment of the three largest Jordanian telecommunication firms. The participating organisations were from the same industry and were subject to similar regulatory and competitive settings, so the influence of contextual variations was predicted to be minimised. However, future research is advised to consider important control factors to better explore the robustness and generalisability of the proposed correlations.
Table 1. Characteristics of respondents
|
Variable |
Category |
Frequency |
Percent (%) |
|
Gender |
Male |
198.0 |
55.5 |
|
Gender |
Female |
159.0 |
44.5 |
|
Age |
30–39 |
141.0 |
39.5 |
|
Age |
<30 |
92.0 |
25.8 |
|
Age |
40–49 |
86.0 |
24.1 |
|
Age |
≥50 |
38.0 |
10.6 |
|
Experience |
6–10 years |
136.0 |
38.1 |
|
Experience |
1–5 years |
118.0 |
33.1 |
|
Experience |
>10 years |
103.0 |
28.9 |
|
Job Role |
Managerial |
132.0 |
37.0 |
|
Job Role |
Operational Staff |
121.0 |
33.9 |
|
Job Role |
IT/Data Analyst |
104.0 |
29.1 |
|
Company |
Zain |
132 |
37.0 |
|
Company |
Orange |
118 |
33.0 |
|
Company |
Umniah |
107 |
30.0 |
3.3 Questionnaire design
The questionnaire for this study was prepared based on the existing theoretical and empirical literature of BDA, BMI, and SP. The instrument was in two parts. The first part was about the demographic data of respondents, such as gender, age, work experience, and position. In the second part, the constructs of the study were measured with previously validated scales. All topics were scored on a 5-point Likert scale ranging from 1 (“strongly disagree”) to 5 (“strongly agree”). The questionnaire was developed and administered in English; therefore, no translation or back-translation procedure was required.
BDA. The BDA construct was measured by five items derived from Sivarajah et al. [26] based on the measurement scale produced by Chatterjee et al. [27]. BMI was measured using four questions adopted from Clauss [13] and further adopted by Zhang et al. [23]. SP was measured by eight items modified from Khan et al. [21]. The items were modeled together as indications of one reflective construct expressing overall sustainable organizational performance, consistent with the study’s purpose and the original application of the scale. The study did not evaluate performance as discrete latent variables of environmental, operational and competitive performance. The questionnaire items were slightly reworded to be more suitable to the setting of the Jordanian telecoms sector without changing their original conceptual meaning. Table A1 contains the full list of measuring items utilized in this investigation.
Prior to the main data collection, the questionnaire was reviewed by academic experts and pilot tested for clarity, content validity, and reliability. The feedback received was used to improve the phrasing of a number of items without altering the basic concept. The measuring items and their descriptive data (mean and standard deviation of each item and construct) are shown in Table 2.
Table 2. Statements used for the measurement of constructs.
|
Code |
Measurement Item |
Mean |
SD |
|
BDA1 |
Value creation through BDA adoption |
3.896 |
0.962 |
|
BDA2 |
Skilled employees for effective BDA use |
3.910 |
0.953 |
|
BDA3 |
Top management support for BDA |
3.910 |
0.947 |
|
BDA4 |
BDA capability and market responsiveness |
3.891 |
0.949 |
|
BDA5 |
Operational efficiency through BDA |
3.896 |
0.976 |
|
Big Data Analytics (BDA) |
|
3.901 |
0.775 |
|
BMI1 |
Customer value proposition redesign |
3.768 |
0.965 |
|
BMI2 |
New business partnerships |
3.773 |
0.958 |
|
BMI3 |
New revenue generation methods |
3.773 |
0.961 |
|
BMI4 |
New digital products and services |
3.790 |
0.944 |
|
Business Model Innovation (BMI) |
|
3.776 |
0.810 |
|
SP1 |
Recycling and e-waste management initiatives |
3.966 |
0.939 |
|
SP2 |
Environmental impact reduction initiatives |
3.941 |
0.924 |
|
SP3 |
Energy efficiency policies |
3.938 |
0.943 |
|
SP4 |
Sales and profit growth |
3.947 |
0.951 |
|
SP5 |
Cost savings and operational efficiency |
3.958 |
0.919 |
|
SP6 |
Superior customer value |
3.941 |
0.877 |
|
SP7 |
Corporate social responsibility |
3.969 |
0.922 |
|
SP8 |
Ethical business practices |
3.969 |
0.928 |
|
Sustainable Performance (SP) |
|
3.954 |
0.741 |
3.4 Ethical considerations
Participation in the study was voluntary. The purpose of the study was explained to the respondents, and anonymity and confidentiality were assured. Informed consent was obtained prior to questionnaire completion, and the collected data were used solely for academic research purposes.
3.5 Common method bias
As the current study was based on a cross-sectional, self-administered questionnaire, procedural and statistical remedies were applied to limit the potential impact of common method bias [29]. Procedurally, questionnaire items were properly phrased and structured, and respondents’ anonymity was guaranteed to minimize evaluation fear, response bias, and social desirability effects. Following the recommendations by Sarstedt et al. [30], we statistically examined common method bias using Harman’s single-factor test in SPSS and the full-collinearity variance inflation factor (VIF) technique in PLS-SEM. Furthermore, multicollinearity was controlled using VIF values before testing the structural model so that it is not a concern. The findings of these assessments are shown in the section on findings.
3.6 Data analysis
Data analysis used PLS-SEM via SmartPLS 4. This involved assessing the measurement model using indicators of reliability (outer loadings), internal consistency reliability, convergent validity, discriminant validity (HTMT, Fornell-Larcker criterion, and cross-loading), collinearity, and common method bias. Subsequently, the structural model was evaluated using bootstrapping (resampling was done 5,000 times) in order to test for path coefficients, hypothesis testing, coefficient of determination (R²), effect size (f²), predictive relevance (Q²), and mediation analysis using the variance accounted for (VAF) method [29, 30].
Before the PLS-SEM analysis, the data were examined for missing values and outliers. There were no missing values found in the 357 data entries. Multivariate outliers were detected by examining Mahalanobis distances on the 17 variables with the conservative significance level p < 0.001. It was found that there were four observations that could be considered influential; yet, their elimination through sensitivity analysis resulted in minimal changes in structural models and R². Hence, all 357 valid data entries were used for analysis.
4.1 Measurement model assessment
Outer loadings, CA, rho_A, and composite reliability (CR) were used to assess the reliability of the measurement model, and average variance extracted (AVE) was used to assess convergent validity. Table 3 shows the outcomes of these assessments. All indicator loadings are above the suggested threshold value of 0.70, which supports indicator reliability. Moreover, the CA, rho_A, and CR scores of all constructs were above the suggested value of 0.70, which indicates excellent internal consistency and dependability. AVE values for all constructs were above the threshold of 0.50, suggesting adequate convergent validity. The overall results indicate that the measurement model has excellent indicator reliability, internal consistency reliability and convergent validity. These results indicate that the measuring model meets the stipulated requirements of reliability and validity and may thus be used for structural model assessment [29].
Table 3. Outer loadings
|
Variable |
Code |
Loading |
α |
rho_A |
CR |
AVE |
|
BDA |
BDA1 |
0.788 |
0.869 |
0.887 |
0.905 |
0.656 |
|
BDA2 |
0.825 |
|
|
|
|
|
|
BDA3 |
0.845 |
|
|
|
|
|
|
BDA4 |
0.785 |
|
|
|
|
|
|
BDA5 |
0.804 |
|
|
|
|
|
|
BMI |
BMI1 |
0.873 |
0.868 |
0.889 |
0.910 |
0.717 |
|
BMI2 |
0.846 |
|
|
|
|
|
|
BMI3 |
0.793 |
|
|
|
|
|
|
BMI4 |
0.872 |
|
|
|
|
|
|
SP |
SP1 |
0.791 |
0.920 |
0.927 |
0.934 |
0.641 |
|
SP2 |
0.813 |
|
|
|
|
|
|
SP3 |
0.827 |
|
|
|
|
|
|
SP4 |
0.807 |
|
|
|
|
|
|
SP5 |
0.812 |
|
|
|
|
|
|
SP6 |
0.792 |
|
|
|
|
|
|
SP7 |
0.767 |
|
|
|
|
|
|
SP8 |
0.794 |
|
|
|
|
Note: BDA = big data analytics, BMI = business model innovation, SP = sustainable performance, CR = composite reliability, AVE= average variance extracted.
4.2 Discriminant validity
Discriminant validity was tested by using the Fornell–Larcker criterion, cross-loadings, and the Heterotrait–monotrait ratio (HTMT). Results of these evaluations are summarized in Tables 4-6. The HTMT values in Table 4 are all below the threshold value of 0.85. The highest value was between BMI and SP (0.781), which confirms that the discriminant validity is adequate. The results were also confirmed by the Fornell–Larcker criterion (Table 5), where the square roots of the AVE of all constructs were greater than their respective inter-construct correlations. For example, the square root of AVE for BMI (0.846) exceeded its associations with BDA (0.666) and SP (0.699). Table 6 also shows the cross-loadings, which reveal that each indicator loaded higher on its assigned construct than on the other constructs, thus further supporting discriminant validity. The results generally confirm that the three notions are empirically diverse and capture different conceptual features sufficiently [29].
Table 4. Heterotrait–monotrait ratio
|
Construct |
BDA |
BMI |
SP |
|
BDA |
|
|
|
|
BMI |
0.766 |
|
|
|
SP |
0.757 |
0.781 |
|
Note: BDA = big data analytics, BMI = business model innovation, SP = sustainable performance.
Table 5. Fornell–Larcker criterion
|
Construct |
BDA |
BMI |
SP |
|
BDA |
0.810 |
|
|
|
BMI |
0.666 |
0.846 |
|
|
SP |
0.679 |
0.699 |
0.800 |
Note: BDA = big data analytics, BMI = business model innovation, SP = sustainable performance.
Table 6. Cross-loadings
|
Indicator |
BDA |
BMI |
SP |
|
BDA1 |
0.788 |
0.510 |
0.512 |
|
BDA2 |
0.825 |
0.541 |
0.560 |
|
BDA3 |
0.845 |
0.575 |
0.602 |
|
BDA4 |
0.785 |
0.521 |
0.497 |
|
BDA5 |
0.804 |
0.548 |
0.573 |
|
BMI1 |
0.606 |
0.873 |
0.646 |
|
BMI2 |
0.562 |
0.846 |
0.587 |
|
BMI3 |
0.529 |
0.793 |
0.534 |
|
BMI4 |
0.556 |
0.872 |
0.593 |
|
SP1 |
0.554 |
0.528 |
0.791 |
|
SP2 |
0.565 |
0.565 |
0.813 |
|
SP3 |
0.575 |
0.591 |
0.827 |
|
SP4 |
0.555 |
0.544 |
0.807 |
|
SP5 |
0.571 |
0.562 |
0.812 |
|
SP6 |
0.517 |
0.575 |
0.792 |
|
SP7 |
0.487 |
0.543 |
0.767 |
|
SP8 |
0.522 |
0.566 |
0.794 |
Note: BDA = big data analytics, BMI = business model innovation, SP = sustainable performance.
4.3 Collinearity and common method bias
Before analyzing the structural model, collinearity and common method bias were tested. All inner VIF values are below the recommended threshold of 5.0, showing no concern for multicollinearity in Table 7. Common method bias was examined by Harman's single-factor test and full-collinearity assessment. The first unrotated factor accounted for 47.848% of the total variance, which is less than the 50% required, showing that common technique bias is not likely to be a problem (Table 8). Moreover, the entire collinearity VIF values ranged from 2.142 to 2.329 (as shown in Table 9), all lower than the required threshold of 3.3. These data provide additional evidence that common technique bias had little impact on the study results [29].
Table 7. Inner collinearity assessment
|
Path |
VIF |
|
BDA -> BMI |
1.000 |
|
BDA -> SP |
1.798 |
|
BMI -> SP |
1.798 |
Note: BDA = big data analytics, BMI = business model innovation, SP = sustainable performance, VIF = variance inflation factor.
Table 8. Harman's single-factor test
|
Test |
Statistic |
Value |
Threshold |
Conclusion |
|
Harman single-factor |
Variance explained by first unrotated factor (%) |
47.848 |
<50% |
No serious CMB indication |
Table 9. Full-collinearity assessment
|
Construct |
Full Collinearity VIF |
|
BDA |
2.142 |
|
BMI |
2.255 |
|
SP |
2.329 |
Note: BDA = big data analytics, BMI = business model innovation, SP = sustainable performance, VIF = variance inflation factor.
4.4 Structural model and hypothesis testing
The structural model was evaluated using path coefficients, coefficient of determination (R2), effect size (f2) and predictive relevance (Q2). The significance of the hypothesized correlations was tested by the bootstrapping procedure with 5,000 resamples. The findings of structural model evaluation are presented in Tables 10-14.
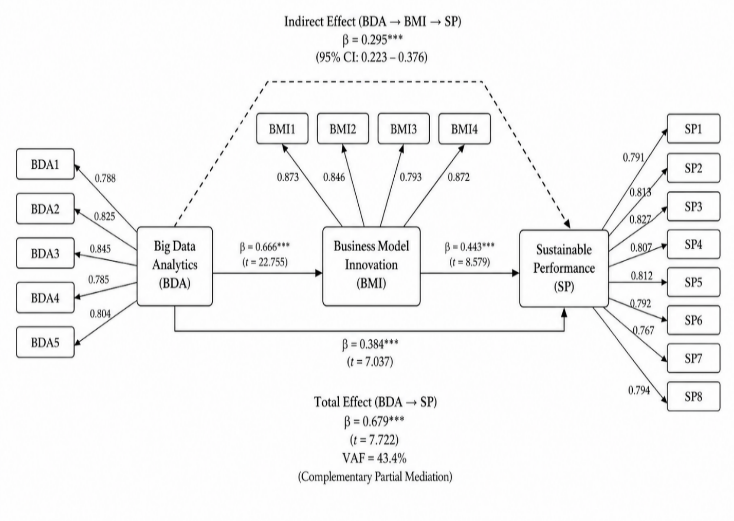
As seen in Table 10 and Figure 2, all hypothesized correlations were positive and significant. BDA had a significant positive effect on BMI (β = 0.666, t = 22.755, p < 0.001), and it was the strongest association in the structural model. Moreover, BDA was found to have a substantial positive effect on SP (β = 0.384, t = 7.037, p < 0.001) while BMI was found to have a positive effect on SP (β = 0.443, t = 8.579, p < 0.001). All direct hypotheses were therefore supported.
Table 10. Path coefficients and hypothesis testing
|
Effect |
Beta |
STDEV |
T Value |
P Value |
CI 2.5% |
CI 97.5% |
Decision |
|
BDA -> SP |
0.384 |
0.055 |
7.037 |
<0.001 |
0.276 |
0.490 |
Supported |
|
BDA -> BMI |
0.666 |
0.029 |
22.755 |
0.000 |
0.609 |
0.723 |
Supported |
|
BMI -> SP |
0.443 |
0.052 |
8.579 |
0.000 |
0.340 |
0.547 |
Supported |
Note: Two-tailed significance testing; 5,000 bootstrap resamples; percentile 95% confidence intervals. BDA = big data analytics, BMI = business model innovation, SP = sustainable performance.
Table 11. Coefficient of determination (R²)
|
Endogenous Construct |
R2 |
|
BMI |
0.444 |
|
SP |
0.571 |
Note: BMI = business model innovation, SP = sustainable performance.
Table 12. Effect size (f²)
|
Path |
f2 |
Magnitude |
|
BDA -> BMI |
0.798 |
Large |
|
BDA -> SP |
0.191 |
Medium |
|
BMI -> SP |
0.254 |
Medium |
Note: BDA = big data analytics, BMI = business model innovation, SP = sustainable performance.
Table 13. Predictive relevance (Q²)
|
Endogenous Construct |
Q² |
Predictive Relevance |
|
BMI |
0.433 |
Substantial |
|
SP |
0.560 |
Substantial |
Note: BMI = business model innovation, SP = sustainable performance.
Table 11 illustrates the explanatory power of the structural model. The model showed adequate explanatory power, explaining 44.4% of the variance in BMI (R² = 0.444) and 57.1% of the variance in SP (R² = 0.571). As shown in Table 12, BDA had a strong effect on BMI (f2 = 0.798), while the effects of BDA and BMI on SP were of medium magnitude (f2 = 0.191 and 0.254, respectively). Finally, as shown in Table 13, the Q² values of both endogenous constructs were more than zero (BMI = 0.433; SP = 0.560), indicating substantial predictive relevance of the structural model [30].
4.4.1 Out-of-sample predictive assessment (PLSpredict)
In addition to the Q²-based in-sample assessment of predictive relevance, out-of-sample prediction was examined via the PLSpredict algorithm in conjunction with 10-fold cross-validation and 10 repetitions. Considering that the model had a mediating nature, the direct-antecedents method was used. The prediction accuracy was measured through Q²_predict, root mean squared error (RMSE), and mean absolute error (MAE), with the linear model (LM) being the reference. The results of the PLSpredict assessment are presented in Table 14.
As can be seen in Table 14, all values of Q²_predict were positive, with values between 0.275 and 0.401, which shows predictive relevance for all indicators of the endogenous variables. Furthermore, the PLS-SEM model generated RMSEs that were smaller compared to those of the LM benchmark in all 12 indicators. The MAE values were also smaller in 11 of the 12 indicators, while the values were very close in one indicator (SP6), where PLS had an MAE value of 0.562 and LM had an MAE value of 0.561.
Table 14. PLSpredict assessment of out-of-sample predictive performance
|
Indicator |
Q²_Predict |
PLS RMSE |
LM RMSE |
PLS MAE |
LM MAE |
|
BMI1 |
0.363 |
0.772 |
0.781 |
0.622 |
0.628 |
|
BMI2 |
0.309 |
0.797 |
0.807 |
0.624 |
0.631 |
|
BMI3 |
0.275 |
0.819 |
0.828 |
0.655 |
0.663 |
|
BMI4 |
0.303 |
0.789 |
0.797 |
0.635 |
0.641 |
|
SP1 |
0.343 |
0.761 |
0.771 |
0.575 |
0.576 |
|
SP2 |
0.377 |
0.730 |
0.743 |
0.580 |
0.589 |
|
SP3 |
0.401 |
0.731 |
0.740 |
0.561 |
0.565 |
|
SP4 |
0.354 |
0.765 |
0.778 |
0.593 |
0.605 |
|
SP5 |
0.377 |
0.726 |
0.732 |
0.566 |
0.573 |
|
SP6 |
0.354 |
0.706 |
0.709 |
0.562 |
0.561 |
|
SP7 |
0.314 |
0.764 |
0.774 |
0.581 |
0.589 |
|
SP8 |
0.351 |
0.749 |
0.752 |
0.578 |
0.585 |
Note: RMSE = root mean squared error, MAE = mean absolute error, LM = linear model, BMI = business model innovation, SP = sustainable performance.
4.5 Mediation analysis
The bootstrapping approach was used to test the mediating function of BMI between BDA and SP. Table 15 displays the direct, indirect, and total effects, VAF, and bootstrap confidence interval.
As demonstrated in Table 15 and Figure 2, the indirect effect of BDA on SP via BMI was positive and significant (β = 0.295, t = 7.722, p < 0.001) and the 95% bootstrap confidence range (0.223–0.376) did not include zero, verifying the significance of the mediation effect. The direct effect of BDA on SP was significant (β = 0.384) and the total effect was 0.679. Furthermore, the value of VAF (43.4%) shows complementary partial mediation, which means that the BMI partially mediates the association between BDA and SP. Therefore, the mediation hypothesis (H4) was supported [30].
Table 15. Mediation analysis results
|
Path |
Direct |
Indirect |
Total |
t |
p |
VAF |
95% CI |
|
BDA → BMI → SP |
0.384 |
0.295 |
0.679 |
7.722 |
<0.001 |
43.4% |
0.223–0.376 |
Note: BDA = big data analytics, BMI = business model innovation, SP = sustainable performance, VAF = variance accounted for.
Figure 2. Structural model with standardized path coefficients
The findings show that BDA makes a considerable contribution to SP, which implies that businesses with a higher analytics capability are better positioned to increase their overall sustainable organizational performance. BDA is a significant organizational capacity that helps organizations to convert vast amounts of data into strategic knowledge and superior organizational performance from the RBV. As such, organizations become better equipped to make sound decisions, optimize resource utilization, and increase efficiency, thus enhancing sustainability in the long term. Such results correlate with previous studies, which proved that data-driven businesses can improve sustainability performance by making strategic decisions and utilizing resources effectively [10, 12]. Results also correlate with previous studies that pointed out the need for analytical skills to achieve the SP of the organization by managing its resources and improving organizational efficiency [11, 31].
Furthermore, results indicate that BDA has become one of the major drivers of BMI. Analytically mature organizations will be more capable of recognizing the opportunities in the market, analyzing the changing needs of consumers and adapting their approaches in terms of value generation and delivery. The finding aligns with the dynamic capabilities’ perspective, which suggests that businesses gain a competitive advantage through their ability to sense changes in the environment and continuously reallocate resources. With analytical skills, businesses can identify inefficiencies, forecast market trends, and introduce new business models that increase organizational adaptability. Such results correlate with the previous research proving that BDA is crucial in providing innovation and transforming business models in organizations [3, 32]. Results also confirm the findings pointing out that analytical skills are one of the major drivers of BMI and organizational competitiveness [1].
Moreover, the positive relationship between BMI and SP shows the importance of the organization's constant adaptability to achieve sustainability. Organizations that reconfigure their business models are better placed to embed sustainability into their value generating operations, maximize resource use and respond effectively to stakeholder’s expectations. This result is in line with the DCT that regards continual innovation as a critical process to sustain the organization’s competitive ability in the dynamic business environment. Meanwhile, Stakeholder Theory argues that creative business models enable enterprises to deliver value to a variety of stakeholder groups through the balancing of economic aims with environmental and social responsibilities. The results of this study support the findings of earlier studies, which reported that BMI enhances organizational sustainability through the integration of sustainable practices into core business operations and the improvement of operational efficiency [11, 33]. They are also in line with research that suggests that innovative business models enhance the overall SP of a firm [7, 14].
The mediation analysis also indicates that BDA contributes to sustained success through BMI, which is an essential mechanism. The analytical capabilities create more organizational value by translating the insights gathered from data into new innovative business models that reconfigure processes for value creation, value distribution and value capture, than by generating sustainable outcomes directly. This conclusion offers an integrated theoretical rationale for the suggested research model. While the RBV presents the BDA as a strategic capability of the firm, DCT illustrates how these capabilities are reconfigured through BMI to yield sustained outcomes. This approach is further supported by the Stakeholder Theory which states that new business models help firms to better meet the demands of customers, regulators and society, which ultimately strengthens SP. These findings are consistent with earlier studies highlighting the mediating role of BMI in converting analytical capabilities into sustainable outcomes [2, 9]. Moreover, the present research adds to the existing literature by demonstrating this process in the Jordanian telecommunications industry. It was revealed that companies are able to attain more powerful sustainability outcomes when they associate analytical capabilities with ongoing BMI than when they depend solely on data analytics [1, 19, 34].
This paper sought to investigate the impact of BDA on BMI and SP. The results have revealed the positive influence of BDA on SP, as well as the improvement of BMI. In addition, BMI partially mediates the relationship between BDA and SP; hence, it can be said that better results of sustainability are achieved when analytical abilities of an organization are successfully converted into innovative business models. The study uses RBV, dynamic capabilities, and stakeholder theory to provide a complete picture of the way analytical capabilities create sustainable value in organizations. In summary, the current study contributes to the expanding literature on digital transformation and sustainability with a case study undertaken within the Jordanian communications sector.
7.1 Theoretical contribution
The present study makes substantial theoretical contributions to the existing literature on BDA, BMI, and SP. Firstly, this research brings together three important theories, namely RBV, DCT, and ST, in a coherent conceptual framework that highlights how these mutually supportive theories can be employed to examine the relationships among BDA, BMI, and SP. This contribution addresses the limitations of past studies, which have separately studied these theories without considering their synergies, thereby providing a comprehensive view of how analytical capabilities create sustainable value.
Secondly, it acknowledges BMI as a crucial organizational approach which facilitates the translation of analytical skills into sustainable value. The findings confirm that firms achieve sustainability through the conversion of analytical knowledge into novel methods of value creation and delivery, thereby complementing previous mediation studies with empirical validation.
Lastly, this research contributes to the existing body of knowledge through empirical evidence drawn from the Jordanian telecommunication industry, thereby broadening the applicability of the current literature in an emerging economy context.
7.2 Practical implications
The conclusions have several practical consequences for the managers and decision-makers of the telecom’s firms. First, organizations should treat BDA as a strategic organizational skill and not only a technological investment. Development of analytical infrastructure, quality of data, and analytical skills of individuals can enable evidence-based decision-making and ensure sustainable organizational performance.
Second, companies must continue to develop their business models to complement their investments in analytical capability. Telecommunications firms need to redesign value-creation processes, build new digital services, improve consumer interaction, and uncover new business prospects using analytical data. The combination of analytical capabilities and innovation in the business model helps organizations better respond to changing market conditions and generally improve sustainable organizational performance.
Finally, managers need to promote collaboration among information technology, operations, and strategic planning divisions to embed sustainability goals into organizational innovation efforts. This integration allows organizations to translate analytical knowledge into sustainable business practices, to increase their competitiveness, and to better respond to the expectations of their stakeholders.
However, despite the strengths of the study, there are considerable weaknesses that require attention. Firstly, the research methodology adopted in this study is cross-sectional in nature, and the design limits the study in terms of establishing the cause-and-effect relationship between the study variables. A longitudinal research design might be adopted by future researchers to examine the development of the capabilities for analysis and BMI and their effects on SP.
Secondly, the study was conducted only in the Jordanian telecommunications industry and used the purposive sampling technique, and thus, this limits the generalizability of the results obtained from the study. It is therefore recommended that future research should be conducted using this model in different industries, countries, and probability samples.
Finally, although methodological and statistical techniques were used to control biases common to the method, the data for the study was collected using self-reporting questionnaires filled out by individual employees. Future research could therefore use survey research in combination with objective measures of organizational performance or a qualitative research approach. Another area for future research would be the inclusion of additional organizational variables like digitalization, organizational culture, environmental uncertainty, and firm size.
Fawwaz Tawfiq Awamleh: Conceptualization, methodology, investigation, data collection, formal analysis, interpretation of results, writing – original draft preparation, visualization, project coordination. Basema Mohammad Salem Abu Jaber: Methodology, validation, interpretation of results, writing – review and editing, supervision, and conceptual guidance. Ala Fathi Assi: Formal analysis, methodology, validation, data curation, visualization, literature review, writing – review and editing, and interpretation of results.
Ethics committee approval: This anonymous questionnaire-based study did not require formal ethics committee approval as per the research guidelines of Amman Arab University. Participation was voluntary, informed agreement was acquired, and respondents were anonymous.
The authors gratefully acknowledge Amman Arab University for its support of this research.
Table A1. Measurement items for the study constructs
|
Construct |
Code |
Measurement Items |
|
Big Data Analytics (BDA) |
BDA1 |
Adopting big data analytics technologies creates value for our telecommunications company. |
|
BDA2 |
Our company needs skilled employees to use big data analytics applications effectively. |
|
|
BDA3 |
Our company's top management provides adequate support for adopting big data analytics technologies. |
|
|
BDA4 |
Our company's big data analytics capability enables it to respond effectively to changing market conditions. |
|
|
BDA5 |
Successful implementation of big data analytics enhances our company's operational efficiency. |
|
|
Business Model Innovation (BMI) |
BMI1 |
Our company redesigned its customer value proposition. |
|
BMI2 |
Our company established new business relationships and involved new partners in the value creation process. |
|
|
BMI3 |
Our company created new ways to generate revenue. |
|
|
BMI4 |
Our company introduced new digital products, services, and information offerings. |
|
|
Sustainable Performance (SP) |
SP1 |
We have programs for reducing, reusing, and recycling our products and electronic waste. |
|
SP2 |
We have programs for reducing our products and services’ effects on the environment. |
|
|
SP3 |
Our policies aim to improve the energy efficiency of our operations and network. |
|
|
SP4 |
We have a competitive advantage in terms of sales and profitability. |
|
|
SP5 |
In terms of savings and efficiency, we have a competitive edge. |
|
|
SP6 |
We have a competitive edge when it comes to delivering more value to customers. |
|
|
SP7 |
We have policies on being responsible corporate citizens. |
|
|
SP8 |
We have policies for engaging in ethical business practices. |
Note: Measurement items for Big Data Analytics (BDA) were adapted from Sivarajah et al. [26], based on the measurement scale developed by Chatterjee et al. [27]. Measurement items for Business Model Innovation (BMI) were adapted from Clauss [13] and adopted by Zhang et al. [23]. Measurement items for Sustainable Performance (SP) were adapted from Khan et al. [21].
[1] Alraja, M.N., Imran, R., Khashab, B.M., Shah, M. (2022). Technological innovation, sustainable green practices and SMEs sustainable performance in times of crisis (COVID-19 pandemic). Information Systems Frontiers, 24(4): 1081-1105. https://doi.org/10.1007/s10796-022-10250-z
[2] Alarabiat, Y.A., Alayed, H.M., Awamleh, F.T. (2025). Green innovation strategies in achieving corporate sustainable performance through big data analytics. International Journal of Sustainable Development and Planning, 20(2): 751-759. https://doi.org/10.18280/ijsdp.200224
[3] Adiguzel, Z., Sonmez Cakir, F., Özbay, F. (2025). Big data analytics capability and sustainability in company innovation. International Journal of Innovation Science. https://doi.org/10.1108/IJIS-08-2024-0231
[4] Sun, J., Lim, W. (2026). Exploring nonlinear impacts of big data analytics capabilities on ESG integration and sustainable business model innovation in Chinese manufacturing. Journal of Asia Business Studies, 20(1): 178-201. https://doi.org/10.1108/JABS-08-2025-0468
[5] Awamleh, F.T., Shwawreh, S., Al-Kharabsheh, S.A.I., Alzghoul, A. (2025). The integration of renewable energy adoption in sustainability practices for sustainable competitive advantage in Jordanian SMEs. Challenges in Sustainability, 13(1): 135-145. https://doi.org/10.56578/cis130110
[6] Hwang, B.N., Jitanugoon, S., Puntha, P. (2026). AI integration in service delivery: Enhancing business and sustainability performance amid challenges. Journal of Services Marketing, 40(2): 263-281. https://doi.org/10.1108/JSM-10-2024-0511
[7] Futre, B., Crespo, N.F. (2026). Enhancing sustainable performance through sustainable business model innovation. Journal of Small Business Management, 64(4): 1474-1520. https://doi.org/10.1080/00472778.2025.2556764
[8] Krishnan, R., Phan, P.Y., Krishnan, S.N., Agarwal, R., Sohal, A. (2025). Industry 4.0-driven business model innovation for supply chain sustainability: An exploratory case study. Business Strategy and the Environment, 34(1): 276-295. https://doi.org/10.1002/bse.3970
[9] Ertz, M., Latrous, I., Dakhlaoui, A., Sun, S. (2025). The impact of big data analytics on firm sustainable performance. Corporate Social Responsibility and Environmental Management, 32(1): 1261-1278. https://doi.org/10.1002/csr.2990
[10] Mehmood, K., Jabeen, F., Rashid, M., Alshibani, S.M., Lanteri, A., Santoro, G. (2025). Unraveling the transformation: The three-wave time-lagged study on big data analytics, green innovation and their impact on economic and environmental performance in manufacturing SMEs. European Journal of Innovation Management, 28(6): 2189-2216. https://doi.org/10.1108/EJIM-10-2023-0903
[11] Bashir, M., Alfalih, A., Pradhan, S. (2022). Sustainable business model innovation: Scale development, validation and proof of performance. Journal of Innovation & Knowledge, 7(4): 100243. https://doi.org/10.1016/j.jik.2022.100243
[12] Mangal, U., Mogha, S., Malik, S. (2024). Data-driven decision making: Maximizing insights through business intelligence, artificial intelligence and big data analytics. In 2024 International Conference on Advances in Computing Research on Science Engineering and Technology (ACROSET), Indore, India, pp. 1-7. https://doi.org/10.1109/ACROSET62108.2024.10743399
[13] Clauss, T. (2017). Measuring business model innovation: Conceptualization, scale development, and proof of performance. R&D Management, 47(3): 385-403. https://doi.org/10.1111/radm.12186
[14] Zhou, N., Pan, L., Tian, Y., Zhu, N., Cai, X., Gao, J. (2023). How sustainable business model innovation and green technology innovation interact to affect sustainable corporate performance. Frontiers in Environmental Science, 11: 1049295. https://doi.org/10.3389/fenvs.2023.1049295
[15] Ferlito, R., Faraci, R. (2022). Business model innovation for sustainability: A new framework. Innovation & Management Review, 19(3): 222-236. https://doi.org/10.1108/INMR-07-2021-0125
[16] Wang, Z., Lin, S., Chen, Y., Lyulyov, O., Pimonenko, T. (2023). Digitalization effect on business performance: Role of business model innovation. Sustainability, 15(11): 9020. https://doi.org/10.3390/su15119020
[17] Alkaraan, F., Elmarzouky, M., de Sousa Jabbour, A.B.L., Jabbour, C.J.C., Gulko, N. (2025). Maximising sustainable performance: Integrating servitisation innovation into green sustainable supply chain management under the influence of governance and Industry 4.0. Journal of Business Research, 186: 115029. https://doi.org/10.1016/j.jbusres.2024.115029
[18] Awwad Al-Shammari, A.S., Alshammrei, S., Nawaz, N., Tayyab, M. (2022). Green human resource management and sustainable performance with the mediating role of green innovation: A perspective of new technological era. Frontiers in Environmental Science, 10: 901235. https://doi.org/10.3389/fenvs.2022.901235
[19] Madhavan, M., Sharafuddin, M.A., Chaichana, T. (2022). Impact of business model innovation on sustainable performance of processed marine food product SMEs in Thailand—A PLS-SEM approach. Sustainability, 14(15): 9673. https://doi.org/10.3390/su14159673
[20] Chang, Y.W. (2025). Analyzing the impact of ERP and BI integration on business performance: The technology-organization-environment framework and balanced scorecard perspective. Journal of Global Information Management, 33(1): 1-25. https://doi.org/10.4018/JGIM.389254
[21] Khan, A.N., Mehmood, K., Kwan, H.K. (2024). Green knowledge management: A key driver of green technology innovation and sustainable performance in the construction organizations. Journal of Innovation & Knowledge, 9(1): 100455. https://doi.org/10.1016/j.jik.2023.100455
[22] Awamleh, F.T., Al Hawamdeh, H.M., Aldejwi, S.F., Almajali, W.I., Aldalaien, B. (2025). Integrating green logistics and business intelligence models to achieve sustainable development goals. International Journal of Sustainable Development and Planning, 20(11): 4589-4596. https://doi.org/10.18280/ijsdp.201104
[23] Zhang, Y., Ma, X., Pang, J., Xing, H., Wang, J. (2023). The impact of digital transformation of manufacturing on corporate performance—The mediating effect of business model innovation and the moderating effect of innovation capability. Research in International Business and Finance, 64: 101890. https://doi.org/10.1016/j.ribaf.2023.101890
[24] Mili, K., Bengana, I., Zighed, R., Sabri, M. (2026). Validating a parsimonious two-dimensional business intelligence model for SME sustainability in an emerging economy. Discover Sustainability, 7: 746. https://doi.org/10.1007/s43621-026-03315-5
[25] Liu, D.Y., Zhang, J.Z., Sun, J.J., Dai, B. (2026). AI capability, digital agility, and strategic innovation: The moderating role of government intervention and competitive intensity. Thunderbird International Business Review. https://doi.org/10.1002/tie.70136
[26] Sivarajah, U., Kumar, S., Kumar, V., Chatterjee, S., Li, J. (2024). A study on big data analytics and innovation: From technological and business cycle perspectives. Technological Forecasting and Social Change, 202: 123328. https://doi.org/10.1016/j.techfore.2024.123328
[27] Chatterjee, S., Chaudhuri, R., Gupta, S., Sivarajah, U., Bag, S. (2023). Assessing the impact of big data analytics on decision-making processes, forecasting, and performance of a firm. Technological Forecasting and Social Change, 196: 122824. https://doi.org/10.1016/j.techfore.2023.122824
[28] Simester, D., Timoshenko, A., Zoumpoulis, S.I. (2025). A sample size calculation for training and certifying targeting policies. Management Science, 71(11): 9503-9522. https://doi.org/10.1287/mnsc.2022.02947
[29] Hair, J.F., Babin, B.J., Ringle, C.M., Sarstedt, M., Becker, J.M. (2025). Covariance-based structural equation modeling (CB-SEM): A SmartPLS 4 software tutorial. Journal of Marketing Analytics, 13(3): 709-724. https://doi.org/10.1057/s41270-025-00414-6
[30] Sarstedt, M., Richter, N.F., Hauff, S., Ringle, C.M. (2024). Combined importance–performance map analysis (CIPMA) in partial least squares structural equation modeling (PLS–SEM): A SmartPLS 4 tutorial. Journal of Marketing Analytics, 12(4): 746-760. https://doi.org/10.1057/s41270-024-00325-y
[31] Hussain, F., Zhou, Z., Abbas, H., Dusengemungu, D.R. (2025). The impact of sustainability disclosure on firm value in the energy sector of BRICS economies: The holistic approach of GRI guidelines. Sustainable Development, 33(4): 4960-4975. https://doi.org/10.1002/sd.3388
[32] Adewusi, A.O., Okoli, U.I., Adaga, E., Olorunsogo, T., Asuzu, O.F., Daraojimba, D.O. (2024). Business intelligence in the era of big data: A review of analytical tools and competitive advantage. Computer Science & IT Research Journal, 5(2): 415-431. https://doi.org/10.51594/csitrj.v5i2.791
[33] Tetteh, F.K., Gyamerah, K.K., Nyamekye, B., Atiki, G., Ashia, R. (2025). Digital transformation and business model innovation: The relevance of strategic orientations under varying conditions of competitive intensity. Journal of Manufacturing Technology Management, 36(3): 621-650. https://doi.org/10.1108/JMTM-07-2024-0394
[34] Li, Z., Sun, Y., Liu, J., Li, Y., Zhou, Z. (2024). Corporate violations and bank debt cost: The insurance effect of corporate social responsibility. Corporate Social Responsibility and Environmental Management, 31(5): 4487-4503. https://doi.org/10.1002/csr.2812