Darla Vicuña-Paucar | Astrid Ramírez-López | Pedro Ramírez-Correa | Daniel Garcés-León | Maurizio Mulas | Diego Capa-Sarango | Jessica Robles | Daniela Paz-Barzola | Edgar H. Cando | Kenny Escobar-Segovia*
© 2026 The authors. This article is published by IIETA and is licensed under the CC BY 4.0 license (http://creativecommons.org/licenses/by/4.0/).
OPEN ACCESS
This study analyzes multitemporal surface deformation within the area of influence of the Mazar Dudas Hydroelectric Project (MDHP), located in the Andean region of Ecuador, using Differential Interferometric Synthetic Aperture Radar (DInSAR) and Sentinel-1 images acquired in ascending and descending geometries during the years 2017, 2019, 2022, and 2024. The methodology was based on the generation of coherent interferograms from Single Look Complex SAR images, considering selection criteria such as low perpendicular baseline and appropriate temporal separation, followed by standard interferometric processing and multitemporal analysis. The results reveal persistent and spatially heterogeneous deformation patterns, with negative Line of Sight (LOS) displacements, indicating movements away from the satellite sensor. The maximum deformation rates reached approximately −2 cm/year in both ascending and descending geometries, whereas the minimum values recorded were −7 cm/year in the ascending geometry and between −8 and −10 cm/year in the descending geometry. These temporal increases, particularly pronounced in 2024, suggest the occurrence of localized surface instability processes possibly associated with the drought event recorded during that period. The combined use of both acquisition geometries enabled the identification of consistent deformation trends and the characterization of the displacement components along the LOS direction. The areas showing the greatest deformation are spatially associated with pre-existing geological structures, steep slopes, colluvial deposits, and active hydrographic dynamics. Together, these factors exhibit a direct spatial correlation with the observed deformation patterns, although this relationship requires further investigation.
DInSAR, surface deformation, Sentinel-1, SAR interferometry, multitemporal analysis, landslides
Surface deformation is a manifestation of instability processes that frequently occur in mountainous regions, where the interaction of geological, geomorphological, and hydrogeological conditions promotes the occurrence of mass movements, particularly in areas characterized by steep slopes and poorly consolidated materials, such as the Ecuadorian Andean region [1]. These processes represent a critical concern for the monitoring and management of strategic infrastructure, including hydroelectric projects.
Monitoring surface deformation is essential for understanding the evolution of these processes and reducing the associated risk. However, traditional in situ measurement techniques present limitations in terms of spatial coverage and accessibility, particularly in large or difficult-to-access areas [2].
In this context, Differential Interferometric Synthetic Aperture Radar (DInSAR) has become an effective technique for detecting millimeter-scale surface deformation [3]. Its application to the study of land subsidence and mass movements enables the identification of spatial and temporal deformation patterns under different environmental and land cover conditions [4, 5]. Recent studies have demonstrated the capability of DInSAR combined with Sentinel-1 SAR data to characterize surface deformation associated with geological hazards, applications in volcanic environments have shown the potential of this methodology to identify spatial and temporal displacement patterns, providing valuable information for the assessment of unstable areas and supporting geological hazard monitoring [6]. Furthermore, the increasing availability of open-access SAR data and their integration with optical information have expanded the possibilities for regional-scale surface characterization, improving the interpretation of land surface conditions and supporting the analysis of dynamic Earth processes [7, 8].
In reservoir-associated areas, deformation processes may exhibit greater complexity due to fluctuations in water levels, which can modify the subsurface hydrogeological conditions and alter the effective stresses acting on slopes, thereby promoting instability conditions [9, 10]. Nevertheless, these processes should be evaluated by considering their spatial relationship with the geological and structural characteristics of the terrain.
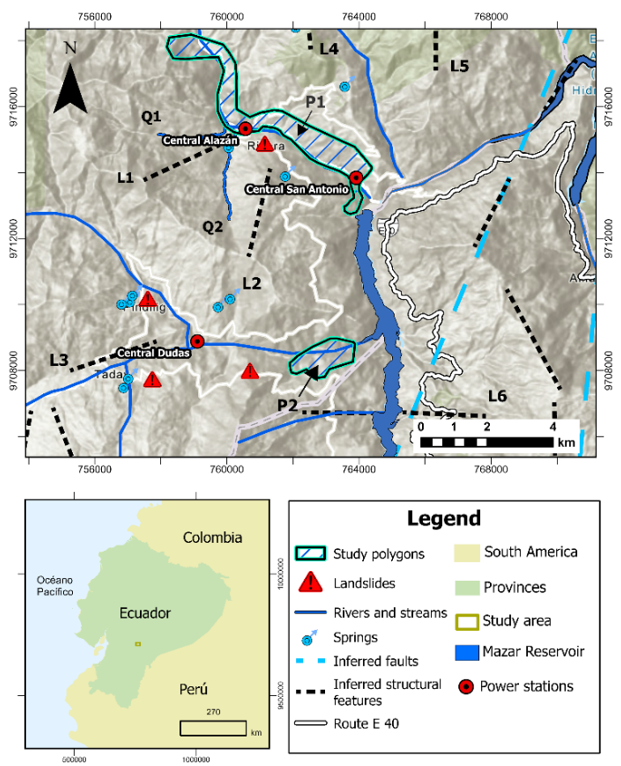
Figure 1. Location map of the Mazar Dudas Hydroelectric Project (MDHP), Cañar province, Azogues canton
The study area (Figure 1) is composed of colluvial materials, steep slopes, and geological structures that condition its geomechanical behavior. These characteristics provide the basis for analyzing the spatial distribution of surface deformation and its relationship with the physical factors controlling its evolution.
In this context, the main contribution of this research lies in the implementation of a multitemporal deformation analysis using DInSAR, identifying deformation patterns and providing objective information to support the continuous monitoring of landslide-susceptible areas within the area of influence of the Mazar Dudas Project.
The objective of this study is to analyze the spatial distribution and temporal evolution of surface deformation within the area of influence of the Mazar Dudas Hydroelectric Project (MDHP) during the periods 2017, 2019, 2022, and 2024.
Based on this objective, the following research question is proposed: (i) How is surface deformation spatially and temporally distributed within the area of influence of the MDHP; (ii) What instability patterns can be identified through DInSAR analysis?
The study hypothesizes that surface deformation exhibits distinct spatial and temporal patterns that can be identified through multitemporal DInSAR analysis, providing valuable information for the monitoring of areas susceptible to surface deformation.
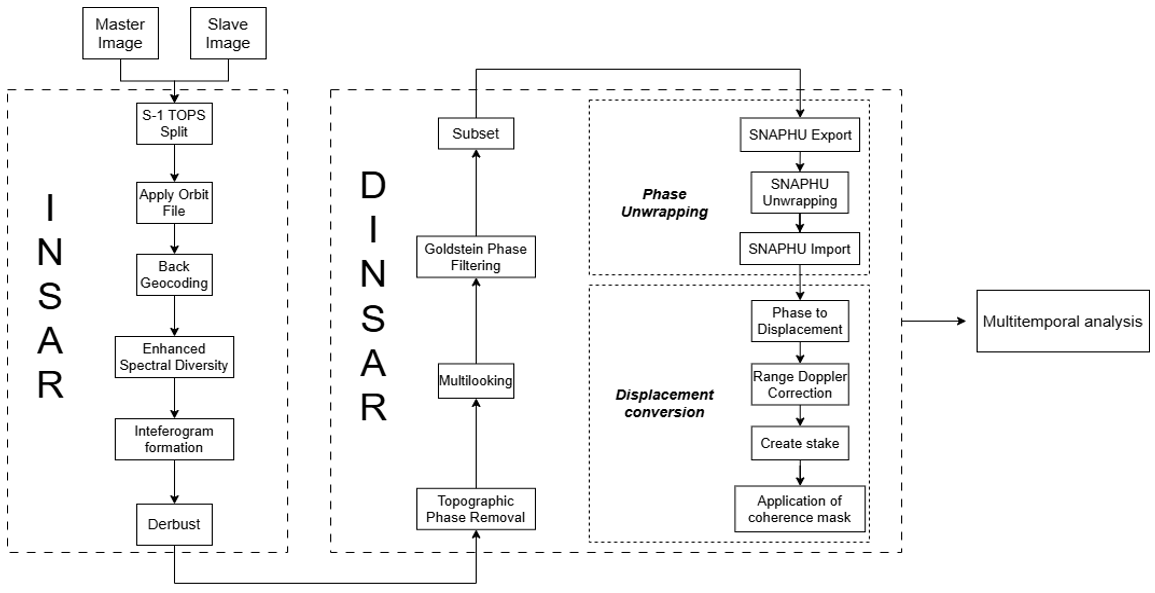
To address the research question and achieve the proposed objective, the DInSAR technique (Figure 2) was applied using Sentinel-1 imagery acquired in ascending and descending geometries for the years 2017, 2019, 2022, and 2024 over the MDHP. The use of both acquisition geometries improved the spatial interpretation of the deformation measured along the Line of Sight (LOS).
The methodological procedure was structured into three main phases: (1) image acquisition and selection, (2) image processing, and (3) multitemporal analysis of surface deformation.
Figure 2. Methodological workflow using InSAR-Differential Interferometric Synthetic Aperture Radar (DInSAR) techniques
2.1 Phase 1: Radar image acquisition and selection
The SAR images were obtained through the ASF Vertex platform, managed by NASA, which provides free search, acquisition, visualization, filtering, and download of Sentinel-1 products, as well as cloud-based preview and processing tools [11]. This platform constitutes an official source for the distribution of SAR data used in interferometric applications.
Image selection was performed based on general and specific parameters. The general parameters included the satellite platform (Sentinel-1A and Sentinel-1B), product type, acquisition mode, polarization, ascending and descending orbits, and the spatial coverage corresponding to the study area. These criteria ensured the geometric and radiometric compatibility required for the generation of coherent interferograms. Additionally, four analysis periods (2017, 2019, 2022, and 2024) were selected, representing different stages in the evolution of the surface deformation observed within the study area.
Table 1. Parameters for Sentinel-1 SAR data acquisition
|
Type |
Parameter |
Value |
|
General |
Product Type |
Single Look Complex |
|
Acquisition Mode |
Interferometric Wide |
|
|
Polarization |
Vertical-Vertical |
|
|
Orbit Direction |
ascending/descending orbit |
|
|
Specific |
Timeframe |
12 days |
|
Perpendicular Baseline |
0< Perpendicular Baseline ≤ 150 meters |
The selection of interferometric pairs also considered the perpendicular baseline, a parameter that influences the geometric coherence between SAR images. Studies conducted in areas with geomorphological characteristics and vegetation cover like those of the study area recommend maximum perpendicular baseline values ranging from 150 to 200 m [12]. Since the MDHP is characterized by moderate to dense vegetation cover, the more conservative criterion was adopted by establishing a maximum perpendicular baseline of 150 m to prioritize interferometric robustness. Table 1 presents the general and specific parameters selected for the acquisition of the SAR images.
A total of 103 images were downloaded for the ascending geometry and 118 for the descending geometry (Figure 3(a)). From these datasets, 89 interferograms were generated for the ascending orbit and 107 for the descending orbit (Figure 3(b)).
Figure 3. The number of (a) downloaded Sentinel-1 datasets and (b) the interferograms generated for the Mazar Dudas Hydroelectric Project (MDHP) during the 2017, 2019, 2022, and 2024 analysis periods
2.2 Phase 2: Interferometric processing using Differential Interferometric Synthetic Aperture Radar
Interferometric processing was carried out using SNAP (Sentinel-1 Toolbox v9.0), developed by the European Space Agency (ESA), applying the workflow of DInSAR. For this purpose, two or more SAR images acquired over the same area at different dates were used, allowing the estimation of ground displacements projected along the satellite LOS direction [13].
Initial processing involved co-registration of the slave image with respect to the master image, ensuring spatial correspondence between both images at the pixel level. Subsequently, precise orbital information and a Digital Elevation Model (DEM) were incorporated in order to minimize geometric differences and improve interferometric coherence.
The interferometric phase obtained previously from two SAR images is composed of multiple contributions: topographic, orbital, atmospheric, ground motion, and noise [14].
The total interferometric phase (∆φ) corresponds to the sum of the topographic (φtopo), orbital (φorbit), atmospheric (φatmos), deformation (φdef), and noise (φnoise) contributions, as expressed in Eq. (1) [15]. The topographic component is associated with terrain elevation; the orbital component represents inaccuracies in the satellite trajectory; the deformation component corresponds to surface motion; the atmospheric component accounts for delays induced by the atmosphere; and the noise component includes random errors from the system and processing.
$\Delta \varphi=\varphi_{\text {topo}}+\varphi_{\text {orbit}}+\varphi_{\text {def}}+\varphi_{\text {atmos}}+\varphi_{\text {noise}}$ (1)
The unwrapped phase was subsequently converted into displacement in metric units using the Phase to Displacement tool, while georeferencing was performed through Terrain Correction using the DEM. Finally, a coherence mask was applied, excluding pixels with values below 0.30 to retain only reliable observations for interferometric analysis.
The surface deformation maps obtained were exported in GeoTIFF format for subsequent processing and multitemporal analysis.
2.3 Phase 3: Multitemporal analysis
The surface deformation maps generated through DInSAR processing were integrated and analyzed in ArcGIS Pro using scripts developed in ArcPy, which allowed the processing to be automated, improved data handling efficiency, and ensured the reproducibility of the analysis.
As an initial step, a screening was performed to exclude interferograms affected by residual errors or atmospheric contributions that could not be fully corrected. This procedure allowed the selection of only those interferograms with suitable conditions for deformation analysis, in line with studies addressing quality control and deformation monitoring [16].
DInSAR represents only the component of displacement projected along the radar LOS and not the full three-dimensional ground motion. In this study, negative values indicate movement away from the satellite; however, this does not imply true vertical or horizontal motion, but rather only the projection of displacement onto the sensor geometry.
The average annual displacement in the LOS direction was estimated by integrating the individual displacements for each calendar year, according to Eq. (2). This calculation was performed independently for each acquisition geometry and each period, allowing the derivation of a representative annual rate of surface deformation in LOS, independent of the number of interferograms, thus ensuring interannual and inter-geometry comparability [17].
$d s p_{\text {prom}}=\frac{\sum \begin{array}{c}\left(d s p_1+d s p_2+d s p_3\right. \left.+d s p_4+d s p_5+\cdots+d s p_n\right)\end{array}}{n}$ (2)
Finally, the instability zones were delineated through an integrated spatial interpretation of the annual deformation maps obtained from both ascending and descending geometries. As an initial criterion, areas exhibiting deformation rates equal to or lower than −3.5 cm/year were considered. Subsequently, the temporal recurrence of deformation and its spatial continuity between consecutive dates and between both acquisition geometries were evaluated. Based on these criteria, representative polygons of unstable sectors were manually delineated, adjusting the polygons to the observed spatial distribution.
The multitemporal analysis of surface deformation maps obtained through DInSAR allowed the characterization of the spatial distribution and temporal evolution of deformation within the MDHP using DInSAR for the years 2017, 2019, 2022, and 2024.
Table 2. Surface deformation ranges used for the ascending and descending acquisition geometry maps
|
Ascending Deformation (cm/Year) |
Descending Deformation (cm/Year) |
|
>−9.0 |
>−10.0 |
|
[−9.0–−8.0] |
[−10.0–−8.5] |
|
[−8.0–−7.0] |
[−8.5–−7.0] |
|
[−7.0–−6.0] |
[−7.0–−6.0] |
|
[−6.0–−4.5] |
[−6.0–−5.0] |
|
[−4.5–−3.0] |
[−5.0–−4.5] |
|
[−3.0–−2.0] |
[−4.5–−3.5] |
|
<−2.0 |
<−3.5 |
The results revealed differences in the magnitude and spatial distribution of deformation between ascending and descending geometries. Due to these differences, specific classification intervals were established for each geometry (Table 2).
3.1 Ascending acquisition geometry
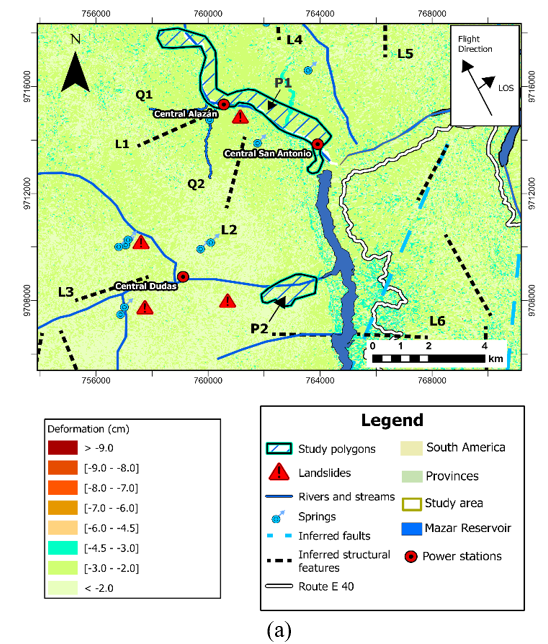
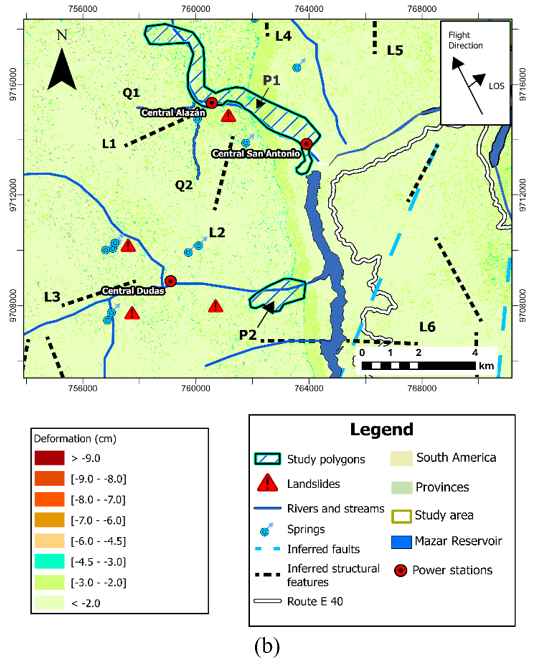
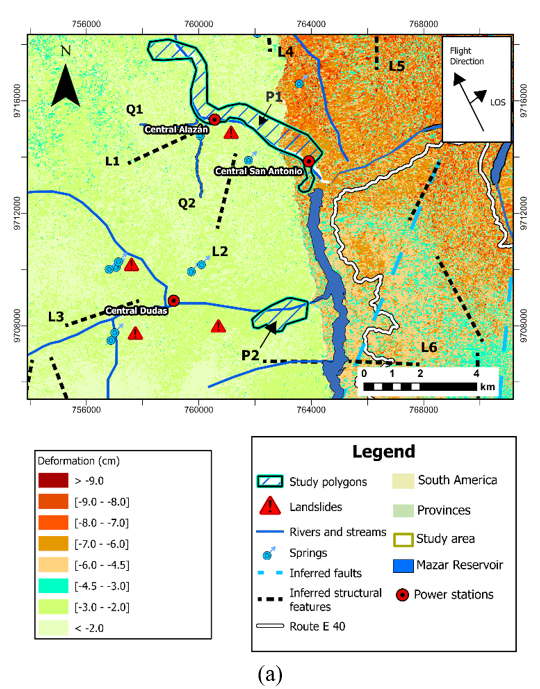
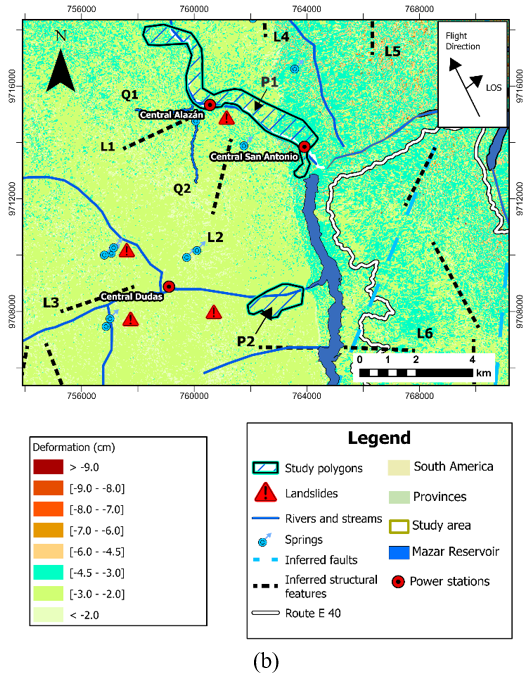
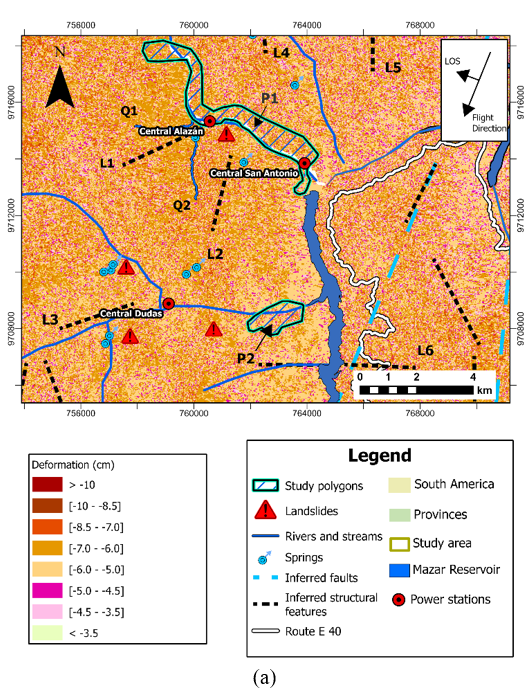
The multitemporal analysis in the ascending geometry covered representative years corresponding to the main phases of surface deformation evolution (Figures 4 and 5).
Figure 4. Representative evolution of surface deformation in ascending orbit mode for the years (a) 2017 and (b) 2019
Figure 5. Representative evolution of surface deformation in ascending orbit for the years (a) 2022 and (b) 2024
In 2017 (Figure 4(a)), surface deformation rates between −4.5 and −2 cm/year were recorded, distributed in a localized manner. For 2019 (Figure 4(b)), a slight decrease in deformation magnitude was observed, with values of approximately −2 cm/year, suggesting a reduction in surface deformation intensity compared to the previous period. In 2022 (Figure 5(a)), a significant increase in deformation was recorded, reaching values of up to −7 cm/year, mainly in sectors located east of the Mazar reservoir. Finally, in 2024 (Figure 5(b)), deformation was concentrated between −4.5 and −3.0 cm/year, maintaining a spatial distribution like that observed in previous periods.
3.2 Descending acquisition geometry
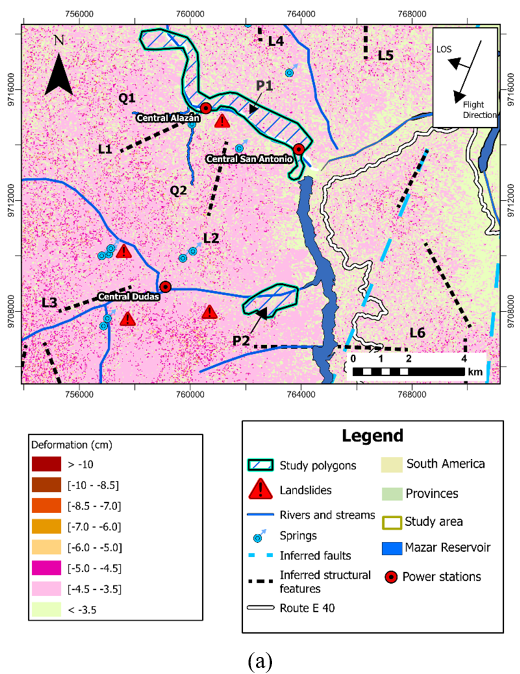
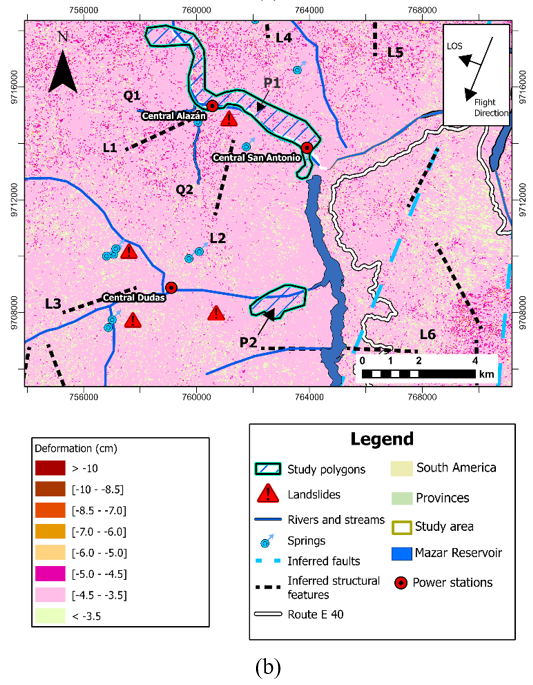
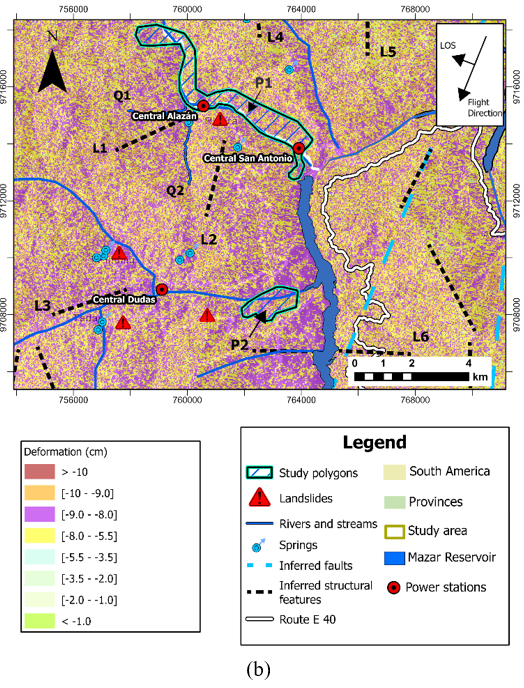
The multitemporal analysis in the descending geometry showed a progressive evolution of surface deformation during the study period.
Figure 6. Evolutionary behavior of surface deformation in descending orbit mode for the years (a) 2017 and (b) 2019
Figure 7. Evolutionary behavior of surface deformation in descending orbit mode for the years (a) 2022 and (b) 2024
In 2017 (Figure 6(a)), relatively stable behavior was observed, without a well-defined spatial distribution of deformation. In 2019 (Figure 6(b)), a greater spatial organization of the deformed sectors began to emerge. In 2022 (Figure 7(a)), deformation rates reached values between −6 and −5 cm/year. This trend intensified in 2024 (Figure 7(b)), when deformation values between −10 and −8 cm/year were recorded, higher in magnitude than those observed in previous years, where values close to −2 cm/year predominated.
3.3 Instability zones
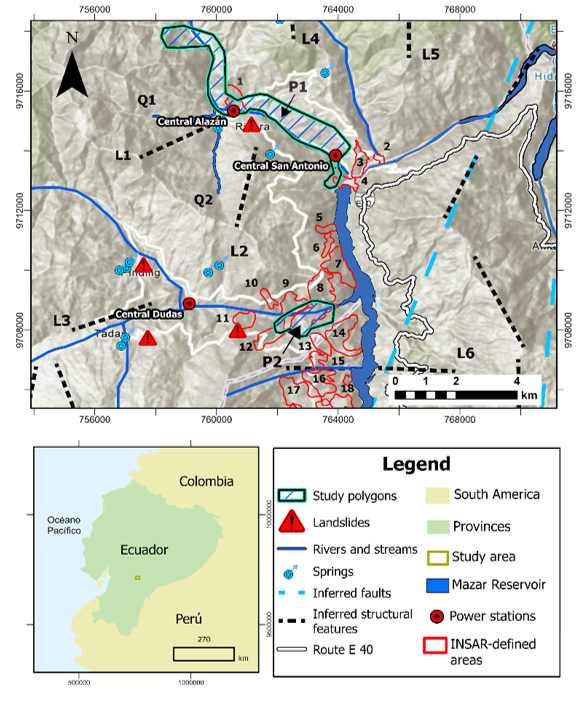
Applying the delineation criteria described in the methodology, 18 instability zones were identified within the study area (Figure 8). Zones 2 and 4 show spatial correspondence with the sector known as La Letra, previously identified in technical studies of the MDHP as an area of high susceptibility to landslides.
Overall, the instability zones, with the exception of Zone 1, were mainly concentrated in the western part of the study area, near the Mazar reservoir and the P2 polygon, showing spatial correspondence with the inferred structural lineament L6 and with the gullies that drain into the reservoir.
Zone 8 exhibited the largest extent within the study area, covering an area of 154.41 ha. In contrast, only localized deformation features were identified within polygon P1, which did not simultaneously satisfy the criteria of spatial continuity and temporal recurrence; therefore, they were not classified as instability zones.
Figure 8. Location map of the study zones within the Mazar Dudas Hydroelectric Project (MDHP), where P1 corresponds to Alazán and San Antonio, and P2 corresponds to Dudas Power Plant
The multitemporal analysis showed that surface deformation did not present a constant behavior during the study period, but rather an evolution characterized by phases of relative stability followed by localized increases in displacement magnitude. In particular, the highest deformation rates were recorded during the 2022 and 2024 periods, evidencing temporal variations in the detected deformation compared to 2017 and 2019.
These results show that surface deformation exhibits a differentiated temporal distribution that can be identified through DInSAR analysis. The persistence of deforming sectors across different periods and the variation in their magnitudes indicate that ground behavior was not uniform over the analyzed interval but instead evolved heterogeneously over time. Although DInSAR does not allow the underlying mechanisms responsible for these variations to be determined, the identification of persistent temporal patterns is consistent with the behavior described for slow-moving landslides in previous studies. In this regard, Osmanoğlu et al. [18] state that InSAR time-series analysis enables the recognition of progressive deformation trends that cannot be detected through point-based observations, while Shang et al. [10] highlight that multitemporal monitoring using SBAS-InSAR facilitates the identification of gradual changes in deformation in mountainous slopes.
Overall, these findings demonstrate that multitemporal DInSAR analysis enables the identification of differentiated temporal patterns of surface deformation, providing useful information for monitoring sectors with persistent deformation and contributing a basis for future research aimed at integrating geological, geotechnical, and hydrogeological data to better understand the mechanisms responsible for the observed deformation.
The DInSAR technique demonstrated its ability to identify spatial patterns of surface deformation in a complex geological environment such as the MDHP. Through multitemporal analysis and the application of the delineation criteria defined in the methodology, 18 instability zones were identified within the study area.
The integration of DInSAR results with available geological information allowed the identification of spatial correspondences between several instability zones and the structural lineament L6 (Figure 8), which is oriented approximately parallel to the river channel crossing the Dudas Power Plant. This spatial correspondence suggests a possible influence of the structural framework on the location of the identified deformations. Furthermore, this behavior is consistent with the findings reported by Ahmadi & Pekkan [19] and Pérez-Falls et al. [5], who indicate that structural lineaments can act as zones of weakness that favor the localization and propagation of surface deformation processes.
In contrast, in the vicinity of lineaments L1, L2, and L3, no persistent deformation zones were identified through DInSAR, although there are records of landslides previously mapped by governmental agencies in these sectors. This difference highlights the need to complement interferometric analysis with advanced geotechnical studies and field observations to better understand in greater detail the mechanisms controlling slope instability.
Although this spatial coincidence does not allow a causal relationship to be established between structural lineaments and the observed deformations, it does constitute a useful criterion to guide future research on the factors controlling the distribution of surface deformation within the study area.
The DInSAR technique allows the detection of deformation with centimetric or millimetric precision; however, one of its main limitations is that measurements correspond only to the component of displacement projected along the satellite LOS [20]. Therefore, deformation magnitudes depend on the acquisition geometry; therefore, the same ground movement may present different values in ascending and descending orbits.
The applied methodology and the obtained results demonstrate the potential of the DInSAR technique to identify spatial and temporal patterns of surface deformation over large areas. However, the deformations estimated in this study represent only the component of displacement projected along the satellite LOS and not the full three-dimensional ground motion. This condition limits the independent interpretation of the vertical and horizontal components of displacement..
A more complete characterization of the deformation field would require decomposing the LOS displacement by integrating observations from ascending and descending geometries, taking into account the sensor acquisition geometry parameters. This approach would allow the separation of ground motion components and strengthen the interpretation of the observed deformation processes.
In this context, the obtained results constitute a basis for future research aimed at integrating DInSAR analysis with geotechnical, geological, and hydrological information, with the purpose of improving the understanding of the mechanisms controlling surface deformation in the study area.
The application of multitemporal DInSAR analysis allowed the characterization of the spatial and temporal evolution of surface deformation within the area of influence of the MDHP during the periods 2017–2019–2022–2024. The results showed that deformation did not exhibit a uniform behavior, but rather a differentiated evolution, with higher deformation rates observed in 2022 and 2024. These findings demonstrate the potential of multitemporal analysis to identify areas with persistent deformation and to support continuous, non-invasive monitoring of potentially unstable sectors.
Interferometric processing using Sentinel-1 images with a 12-day temporal interval allowed the generation of a consistent set of interferograms for multitemporal analysis, enhancing interferometric coherence in an environment with moderate to high vegetation cover and strengthening the reliability of the obtained results.
The comparison of information obtained from ascending and descending geometries allowed the identification of differences in the magnitude of the observed deformations, associated with the different projection of displacement onto the satellite LOS. Likewise, the application of temporal recurrence criteria, spatial continuity, and a deformation threshold of −3.5 cm/year allowed the delineation of 18 instability zones distributed within the study area. Several of these zones show spatial correspondence with the structural lineament L6 and with sectors where historical landslide records exist, which constitutes a complementary criterion for the prioritization of monitoring areas.
Finally, the results obtained confirm that the DInSAR technique is an effective tool for regional monitoring of surface deformation in mountainous and difficult-to-access environments. However, since the measurements correspond only to the displacement projected along the satellite LOS, future research could incorporate the decomposition of motion components using observations from both geometries, as well as integrate geological, geotechnical, and hydrometeorological information, in order to strengthen the understanding of the processes controlling surface deformation in the study area.
This work was supported by the Faculty of Engineering in Earth Sciences (FICT-ESPOL) FICT-002-2026, whose academic, methodological, and technical contributions significantly contributed to the development of this research. The training provided, access to resources, and institutional support helped strengthen the specialized approach and the comprehensive execution of the study. Likewise, this research was supported by the Ecuadorian Electricity Corporation (CELEC EP), within the framework of the Tripartite Specific Cooperation Agreement for the development of the “Ground Deformation Study Project using DInSAR in the area of influence of CELEC SUR.” The institutional collaboration provided, along with access to technical information and study areas, was essential for the application of the interferometric methodology and for consolidating the obtained results.
Similarly, technical and logistical support provided during the processing, analysis, and interpretation of surface deformation activities is acknowledged, as these elements helped strengthen the quality and reliability of this research.
[1] SGTIERRAS. (2015). Manual de identificación de geoformas. Ministerio de Agricultura, Ganadería, Acuacultura y Pesca. https://fliphtml5.com/wtae/wepn/Manual,_Identificación_de_Geoformas,_Escala_1:25.000,_2015.
[2] Garthwaite, M.C., Nancarrow, S., Hislop, A., Thankappan, M., Dawson, J.H., Lawrie, S. (2015). The design of radar corner reflectors for the Australian geophysical observing system: A single design suitable for InSAR deformation monitoring and SAR calibration at multiple microwave frequency bands. Geoscience Australia Record 2015/003. Geoscience Australia, Canberra. http://doi.org/10.11636/Record.2015.003
[3] Gabriel, A.K., Goldstein, R.M., Zebker, H.A. (1989). Mapping small elevation changes over large areas: Differential radar interferometry. Journal of Geophysical Research, 94(B7): 9183-9191. https://doi.org/10.1029/jb094ib07p09183
[4] Tzouvaras, M., Kouhartsiouk, D., Agapiou, A., Danezis, C., Hadjimitsis, D.G. (2019). The use of sentinel-1 Synthetic Aperture Radar (SAR) images and open-source software for cultural heritage: An example from Paphos area in Cyprus for mapping landscape changes after a 5.6 magnitude earthquake. Remote Sensing, 11(15): 1766. https://doi.org/10.3390/rs11151766
[5] Pérez-Falls, Z., Martínez-Flores, G., Sarychikhina, O. (2022). Land subsidence detection in the coastal plain of Tabasco, Mexico using differential SAR interferometry. Land, 11(9): 1473. https://doi.org/10.3390/land11091473
[6] Chandra, Y.I., Maryanto, S., Susilo, A., Tolle, H. (2026). Analysis of DInSAR deformation changes to land surface temperature due to Mount Semeru eruption in 2022. International Journal of Environmental Impacts, 9(3): 627-638. https://doi.org/10.56578/ijei090301
[7] European Space Agency (ESA). (2021). Sentinel-1 User Guide. https://sentiwiki.copernicus.eu/web/sentinel-1.
[8] Joshi, P., Sharma, N., Bhatt, A. (2026). multi-sensor land-use and land-cover mapping using synthetic aperture radar and optical data over the Himalayan foothills. International Journal of Environmental Impacts, 9(4): 865-885. https://doi.org/10.56578/ijei090403
[9] Urgilez Vinueza, A., Robles, J., Bakker, M., Guzman, P., Bogaard, T. (2020). Characterization and hydrological analysis of the Guarumales deep-seated landslide in the tropical Ecuadorian Andes. Geosciences, 10(7): 267. https://doi.org/10.3390/geosciences10070267
[10] Shang, J., Wang, M., Wang, X., Yang, M., Wu, Y., Du, W. (2025). Three-dimensional surface deformation field monitoring and influencing factors analysis in mountainous areas based on SBAS-INSAR technology (Tianjin, China). Scientific Reports, 15: 25702. https://doi.org/10.1038/s41598-025-10894-2
[11] National Aeronautics Space Administration (NASA). (2020). Vertex – Synthetic Aperture Radar (SAR) Data Portal. https://www.earthdata.nasa.gov/s3fs-public/2022-01/VERTEX_FactSheet_OnePager_2020_FINAL.pdf.
[12] Bhattacharjee, S., Garg, R.D., Pandey, A.C. (2025). Monitoring glacier surface velocity in Zanskar Valley, India: Insights from DInSAR-based 2D velocity estimation. Results in Earth Sciences, 3: 100092. https://doi.org/10.1016/j.rines.2025.100092
[13] Braun, A., Veci, L. (2021). Sentinel-1 Toolbox TOPS Interferometry Tutorial. SkyWatch. https://step.esa.int/docs/tutorials/S1TBX%20TOPSAR%20Interferometry%20with%20Sentinel-1%20Tutorial_v2.pdf?1%20Tutorial_v2.pdf.
[14] Ullo, S.L., Addabbo, P., Di Martire, D., et al. (2019). Application of DInSAR technique to high coherence Sentinel-1 images for dam monitoring and result validation through in situ measurements. IEEE Journal of Selected Topics in Applied Earth Observations and Remote Sensing, 12(3): 875–890. https://doi.org/10.1109/jstars.2019.2896989
[15] Wassie, Y., Mirmazloumi, S.M., Crosetto, M., Palamà, R., Monserrat, O., Crippa, B. (2022). Spatio-temporal quality indicators for differential interferometric synthetic aperture radar data. Remote Sensing, 14(3): 798. https://doi.org/10.3390/rs14030798
[16] Crosetto, M., Monserrat, O., Cuevas-González, M., Devanthéry, N., Crippa, B. (2016). Persistent scatterer interferometry: A review. ISPRS Journal of Photogrammetry and Remote Sensing, 115: 78–89. https://doi.org/10.1016/j.isprsjprs.2015.10.011
[17] Sillerico, E., Marchamalo, M., Rejas, J.G., Martínez, R. (2010). La técnica DInSAR: bases y aplicación a la medición de subsidencias del terreno en la construcción. Informes de la Construcción, 62(519): 47–53. https://doi.org/10.3989/ic.09.063
[18] Osmanoğlu, B., Sunar, F., Wdowinski, S., Cabral-Cano, E. (2016). Time series analysis of InSAR data: Methods and trends. ISPRS Journal of Photogrammetry and Remote Sensing, 115: 90–102. https://doi.org/10.1016/j.isprsjprs.2015.10.003
[19] Ahmadi, H., Pekkan, E. (2021). Fault-based geological lineaments extraction using remote sensing and GIS—A review. Geosciences, 11(5): 183. https://doi.org/10.3390/geosciences11050183
[20] Fuhrmann, T., Garthwaite, M.C. (2019). Resolving three-dimensional surface motion with InSAR: Constraints from multi-geometry data fusion. Remote Sensing, 11(3): 241. https://doi.org/10.3390/rs11030241