Meyrano Ariwako | Adithya Sudiarno*
© 2026 The authors. This article is published by IIETA and is licensed under the CC BY 4.0 license (http://creativecommons.org/licenses/by/4.0/).
OPEN ACCESS
Confined space work in ammonia plants involves high occupational risks due to hazardous atmospheres, restricted access, process equipment, and worker competency. This study aimed to identify, assess, and prioritize occupational risk control measures for confined-space activities in the petrochemical industry using the HORshe (House of Risk for Safety, Health, Etc.), which integrates the SHELL (Software, Hardware, Environment, and Liveware) model and the Hierarchy of Control. A descriptive-analytical quantitative approach with a case study design was used. Primary data were collected through field observations, interviews, and Focus Group Discussions involving nine certified General Occupational Health and Safety (OHS) Experts and Confined Space OHS Technicians from four ammonia plants in Indonesia, while secondary data were obtained from company safety documents. The results identified 14 risk events and 13 risk agents, dominated by Liveware-Environment (50.0%), Liveware-Hardware (42.8%), and Liveware-Liveware (7.1%) interactions. The highest-priority risk agents were inert gas exposure, inadequate worker competency, flammable gases, residual catalysts or packing materials, and toxic gases. Based on the Effectiveness-to-Difficulty Ratio (ETDk), the priority Preventive Actions (PAs) included worker competency certification, blind isolation and lockout/tagout, awareness training, ventilation and atmospheric testing, and rescue systems. The HORshe Phase 3 evaluation estimated that the implemented PAs could reduce the Aggregate Risk Potential (ARP) by an average of 94.75% based on post-mitigation expert reassessment, representing the projected residual risk under the implemented control measures at the time of assessment.
confined space, HORshe method, petrochemical industry, risk analysis
The petrochemical industry plays a strategic role in the global economy by producing a wide range of essential products, such as fuels, plastics, and chemicals, which support the pharmaceutical, agricultural, and transportation sectors [1, 2]. This contribution makes the petrochemical industry important not only from an economic perspective but also in terms of its social and environmental impacts [3]. However, despite these benefits, the industry faces significant occupational safety challenges owing to exposure to hazardous chemicals, explosion hazards, and potential environmental contamination; implementing stringent safety systems is essential [4-6]. One of the highest-risk activities in this industry is confined space work, which is characterized by restricted access, inadequate ventilation, and the frequent presence of hazardous gases such as hydrogen sulfide and methane [7, 8]. Activities performed within confined spaces include tank cleaning, inspection, and maintenance, all of which require a thorough understanding of the potential hazards, including chemical exposure and atmospheric instability [8-10].
Occupational safety in confined spaces is strongly influenced by safety culture, communication, and the implementation of active supervision, training, and proper use of personal protective equipment (PPE) [2]. Previous studies have shown that a strong safety culture can improve individual safety performance, whereas participatory approaches to risk assessment enable more accurate hazard identification [7, 11]. The risks associated with confined space work encompass physical, chemical, ergonomic, psychosocial, and biological aspects. Physical risks are related to environmental conditions such as inadequate ventilation; chemical risks arise from exposure to hazardous gases, ergonomic risks result from awkward working positions, and psychosocial risks stem from ineffective communication and weak safety culture [8, 11]. In addition, biological risks, such as exposure to microorganisms, must be addressed through the implementation of hygiene procedures and infection control measures [8, 11-13]. Therefore, comprehensive risk management is essential to minimize occupational accidents.
Available data indicate that accidents in confined spaces are frequently fatal, with 39% caused by hazardous environmental conditions and 27% resulting from inadequate ventilation [12]. Noncompliance with safe work procedures is also a major contributing factor, particularly in the petrochemical industry, where hazardous chemicals are extensively used. The increasing number of confined space accidents reported in several countries underscores the need to evaluate existing safety systems [12]. In practice, traditional risk assessment methods, such as Hazard Identification and Risk Assessment (HIRA), Job Safety Analysis (JSA), Failure Mode and Effects Analysis (FMEA), and Fault Tree Analysis (FTA), still present several limitations because they tend to be partial and are unable to fully capture the complex interactions among risk factors [14, 15]. HIRA primarily provides risk scores, JSA focuses on work steps, FMEA is constrained by the limitations of the Risk Priority Number (RPN), and FTA emphasizes failure logic without offering a clear prioritization of Preventive Actions (PAs). Recent studies have emphasized the importance of adopting a systems perspective in occupational safety assessment. Although the Functional Resonance Analysis Method (FRAM) effectively analyses interactions within complex socio-technical systems [16], it does not provide a structured framework for prioritizing PAs or evaluating residual risk. Therefore, complementary approaches remain necessary for practical occupational risk management.
As an alternative, the HORshe (House of Risk for Safety, Health, Etc.) method was developed to provide a structured framework. This method integrates the SHELL (Software, Hardware, Environment, and Liveware) model and the principles of the Hierarchy of Control into a three-phase framework. The first phase identifies risk events and risk agents and calculates the Aggregate Risk Potential (ARP). The second phase determines the priority of PAs based on their effectiveness and the level of implementation difficulty, while the third phase evaluates the residual risk using the New Aggregate Risk Potential (NARP) and ensures that risks are maintained at an acceptable level in accordance with the As Low As Reasonably Practicable (ALARP) principle [14, 15]. Previous applications have demonstrated its applicability for systematic occupational risk assessment in high-risk industries [14, 15].
A case study was conducted at a large-scale ammonia plant in Indonesia with an annual production capacity of 2.74 million tonnes. Maintenance activities, such as shutdowns and turnarounds, involve more than 20 confined spaces, including reactors, tanks, and boilers, all of which present substantial risks due to exposure to toxic gases, oxygen deficiency, and the potential for fires and explosions [10-12, 17-20]. These risks arise from complex interactions among workers, equipment, procedures, and the working environment, as described by the SHELL model. Liveware-liveware interactions may lead to communication failures, liveware-hardware interactions are associated with equipment-related hazards, liveware-software interactions relate to work procedures, and liveware-environment interactions concern atmospheric conditions within confined space.
To date, risk management practices in ammonia plants have primarily relied on JSA, which has limitations in addressing the complexity of interrelated risks. Therefore, the implementation of the HORshe method integrated with the SHELL model is considered to provide a more comprehensive and systematic framework for identifying relationships among risk events, risk agents, and PAs while establishing measurable mitigation priorities. This approach has the potential to support companies in developing more structured and data-driven occupational risk management strategies for high-risk confined space operations.
This study aimed to identify risk events and risk agents, determine the level of risk, establish priorities for PAs, integrate control measures based on the Hierarchy of Control, and evaluate residual risks following implementation. Theoretically, this research is expected to enrich the body of knowledge in Occupational Health and Safety (OHS), particularly regarding the application of the HORshe method, and to serve as a reference for future studies. The findings are expected to provide guidance for the petrochemical industry in improving occupational safety, assist workers in understanding potential risks, and support the development of data-driven safety policies. This study is limited to confined space activities conducted during turnaround operations at an ammonia plant. In addition, the residual risk evaluation was based on a structured expert reassessment within the HORshe Phase 3 framework and therefore represents the projected residual risk rather than the validated long-term operational safety performance.
2.1 Occupational Health and Safety risk management in the petrochemical industry
OHS risk management in the petrochemical industry is a systematic process that involves hazard identification, risk assessment, and risk control to establish a safe working environment, particularly in industries with high-risk characteristics owing to the use of hazardous chemicals, extreme pressure and temperature conditions, and complex operational processes [8, 14, 15]. One of the most critical areas is confined space work, which is characterized by limited ventilation, the potential for oxygen deficiency, and the accumulation of toxic gases that may result in fatal accidents [2, 8]. Conceptually, a hazard is defined as a source with the potential to cause injury, whereas risk is the combination of the likelihood of an event occurring and the severity of its consequences [14, 15]. The risks associated with confined spaces include physical, chemical, biological, ergonomic, and psychosocial factors, which often occur simultaneously [8, 11, 13, 21]. Therefore, effective risk management requires a comprehensive approach supported by the implementation of Process Safety Management (PSM), the adoption of modern technologies such as sensors and inspection robots, and the strengthening of safety culture through communication and worker participation [2, 22, 23].
2.2 HORshe
The HORshe method is an extension of the HOR model, specifically developed to provide a structured framework for OHS risk analysis [14, 15]. HORshe integrates the SHELL model (Software, Hardware, Environment, and Liveware), the principles of the Hierarchy of Control, and a weighting system based on the Analytical Hierarchy Process (AHP) into three main phases: risk identification and assessment, prioritization of PAs, and evaluation of residual risk using the NARP [14, 15]. The integration of the SHELL model enables a systemic analysis of interactions among human factors, equipment, procedures, and the working environment, whereas the application of the Hierarchy of Control facilitates the prioritization of proposed PAs according to their relative effectiveness. The residual risk evaluation phase represents one of the principal advantages of HORshe, as it enables continuous measurement of risk reduction until risks are reduced to an acceptable level in accordance with the ALARP principle [14, 15].
2.3 Previous studies
Numerous previous studies have demonstrated that methods such as HIRA, JSA, FMEA, FTA, and resilience engineering-based approaches have been widely applied in confined space risk analysis [11, 19, 24-28]. However, most of these methods remain partial in nature and are not capable of comprehensively integrating the complex relationships among multiple risk factors. In contrast, the HOR method and its subsequent developments have shown considerable advantages in systematically identifying risk agents and measurably determining mitigation priorities [29, 30]. The latest development, HORshe, offers a more holistic approach by incorporating systemic interactions and residual risk evaluation [14, 15]. Nevertheless, the application of HORshe in the context of confined space work in the petrochemical industry remains limited, particularly in integrating the SHELL model for systematic risk event classification, incorporating the Hierarchy of Control into PA prioritization, and evaluating projected residual risk through HORshe Phase 3. Therefore, the novelty of this study lies in integrating the SHELL model with the HORshe framework to systematically identify risk events, applying the Hierarchy of Control through the Effectiveness-to-Difficulty Ratio (ETDk) for prioritizing PAs, and evaluating projected residual risk through post-mitigation expert reassessment within the context of confined space work in ammonia plants. This integrated approach provides a structured framework for identifying, prioritizing, and evaluating occupational risks in high-risk confined space operations.
3.1 Research design and approach
This study employed a descriptive analytical quantitative design using a positivist approach. A quantitative design was selected because the primary focus of the research was the numerical measurement of risk levels and the effectiveness of hazard control through the calculation of Severity, Occurrence, Detection, ARP, ETDk, and NARP scores for the combinations of risk events, risk agents, and PAs.
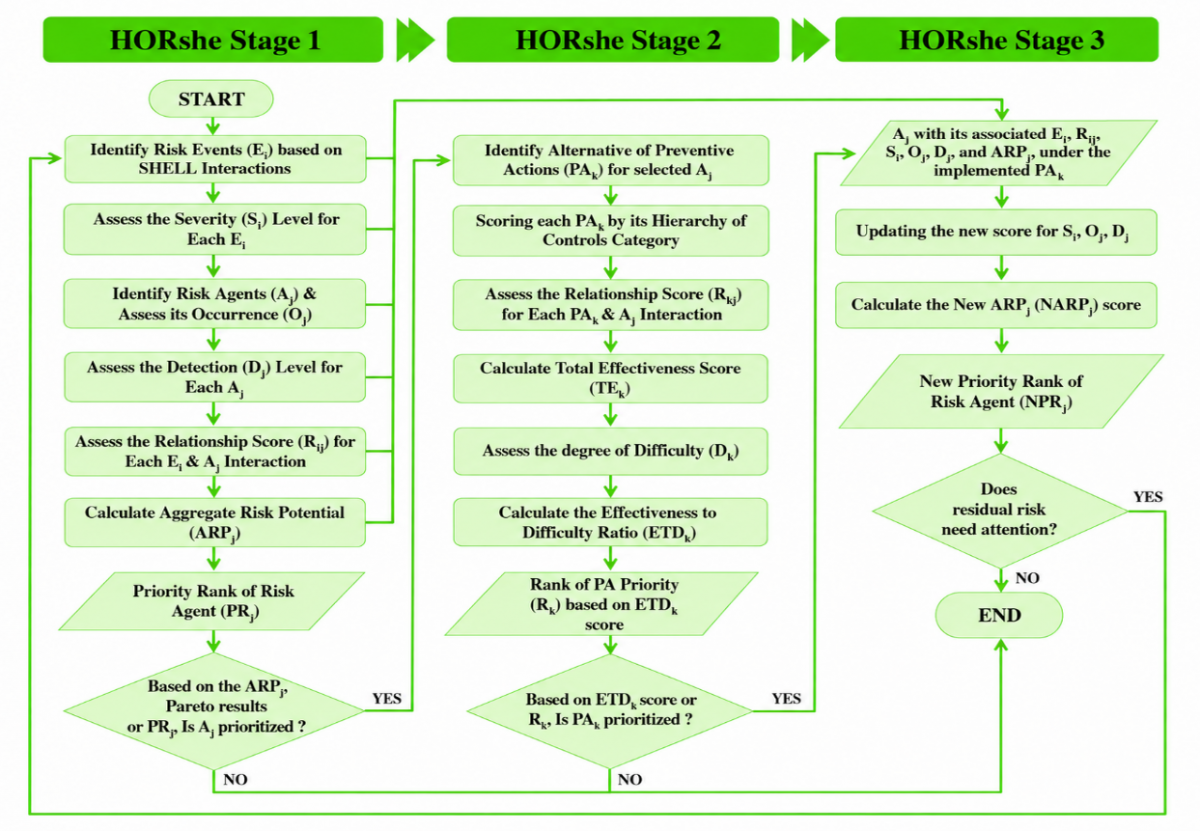
Figure 1. Research framework and integration of the HORshe method [14, 15]
The positivist approach was adopted because the phenomenon under investigation, namely occupational accident risks associated with confined space activities in the petrochemical industry, was viewed as an objective phenomenon that could be observed, measured, and systematically analyzed based on cause-and-effect relationships. This study was categorized as a case study conducted at Plant A, where field observations and implementation of the HORshe methodology were performed. To strengthen the expert assessment process, the Focus Group Discussions (FGDs) involved nine certified OHS practitioners representing four ammonia plants with comparable process characteristics in the Indonesian petrochemical industry. Overall, the research design combined a quantitative measurement orientation through the HORshe method (Figure 1), a systemic approach to the interactions among human factors, equipment, procedures, and the work environment, and an in-depth examination of confined space operations within the selected facilities.
3.2 Research object, subjects, and scope
The primary objective of this study was to analyze the risk of occupational accidents associated with confined space activities in the petrochemical industry using the HORshe method. Risk was defined as the result of the interaction between potential risk events, the risk agents that trigger them, and the effectiveness of the implemented PAs. The research subjects consisted of OHS management personnel, supervisors, and workers with direct experience in confined space work.
The scope of this study was limited to the operational and maintenance activities conducted in confined spaces at the selected research site. The analysis focused exclusively on occupational safety and health risks affecting the workers. Risk assessment was performed in accordance with the three phases of the HORshe methodology: Phase 1, Phase 2, and Phase 3.
3.3 Data collection techniques
The data used in this study consisted of both primary and secondary data. Primary data were collected through field observations, in-depth interviews, and Focus Group Discussions (FGDs) involving nine practitioners with expertise and practical experience in OHS, particularly in confined space work. The expert panel comprised nine certified General OHS Experts and Confined Space OHS Technicians, each with a minimum of five years of professional experience, representing four ammonia plants with comparable process characteristics in the Indonesian petrochemical industry. The selection of these experts was intended to support an assessment that reflected both technical competence and practical experience in confined space operations.
Field observations were conducted to obtain a comprehensive understanding of work activities, workplace conditions, and the potential hazards associated with confined space operations. In-depth interviews were conducted to gather technical information and practical insights regarding hazard identification, risk events, risk agents, and existing risk control practices. Before the assessment process, all experts were provided with standardized guidance regarding the research objectives, definitions of each assessment parameter, HORshe scoring criteria, and practical scoring examples to facilitate a common understanding of the evaluation.
Subsequently, FGDs were conducted to identify risk events and risk agents and to evaluate the Severity, Occurrence, Detection, and relationship scores for each risk event–risk agent combination, both before and after the implementation of PAs. The assessments were based on field observations, company documents, the relevant literature, and expert operational experience. Whenever differences in judgment occurred, each expert was required to provide a technical justification, and the proposed scores were discussed until a consensus was achieved. Consequently, the final assessment values used in this study were established through expert consensus rather than by averaging individual scores. The consistency and credibility of the assessment were further strengthened by the involvement of qualified practitioners, application of standardized assessment criteria, and a structured consensus-based validation process.
Secondary data were obtained from relevant company documents, including the company profile, Standard Operating Procedures (SOPs), permit-to-work records, safety reports, occupational accident records, and OHS audit results. The integration of primary and secondary data enabled methodological triangulation, thereby strengthening the credibility of the findings and providing a comprehensive evidence-based assessment of the occupational risks associated with confined space work.
3.4 Research procedure
3.4.1 HORshe Phase 1—Identification and prioritization of risk agents
In HORshe Phase 1, risk events are identified based on the interactions defined in the SHELL model, namely Liveware-Software, Liveware-Hardware, Liveware-Environment, and Liveware-Liveware. Each risk event was assigned a severity score (Si) on a scale of 1–5 according to its potential to cause injury or fatality (Table 1).
Subsequently, the risk agents responsible for triggering each risk event were identified and assigned an occurrence score (Oj), which reflects the likelihood of their occurrence (Table 2). Tables 1 and 2 are adapted from the standard of observed company.
Table 1. Severity rating levels and categories
|
Score |
Category |
Description |
|
1 |
Insignificant |
First aid case |
|
2 |
Minor |
Medical treatment case |
|
3 |
Moderate |
Temporary disability/restricted work absence |
|
4 |
Major |
Single fatality/prolonged work absence |
|
5 |
Catastrophic |
Multiple fatalities |
Table 2. Occurrence rating levels and categories
|
Score |
Category |
Description |
|
1 |
Rare |
The probability of risk occurrence is below 20%. |
|
2 |
Unlikely |
The probability of risk occurrence ranges from 20% to 40%. |
|
3 |
Possible |
The probability of risk occurrence ranges from 40% to 60%. |
|
4 |
Likely |
The probability of risk occurrence ranges from 60% to 80%. |
|
5 |
Almost Certain |
The probability of risk occurrence ranges from 80% to 100%. |
Table 3. Detection mode level and categories [14, 15]
|
Score |
Category |
Description |
|
1 |
Visual Test |
The design control almost always detects the potential cause/mechanism and subsequent failure mode. |
|
2 |
Manual Test |
Design control is highly likely to detect the potential cause/mechanism and subsequent failure mode. |
|
3 |
Checklist/Pre-Process Test Sequence |
There is a moderate likelihood that the design control will detect the potential cause/mechanism and subsequent failure mode. |
|
4 |
Instrument Testing |
The likelihood that the design control will detect the potential cause/mechanism and subsequent failure mode is very low. |
|
5 |
Lack of or No Effective Method |
The design control will not or cannot detect the potential cause/mechanism and the subsequent failure mode, or no design control is in place. |
A detection score (Dj) was also assigned to assess the ability of the existing control system to detect each risk agent before it leads to a risk event. The more difficult it is to detect a risk agent, the higher the detection score assigned (Table 3).
The ARP value was calculated for each risk agent using the following formula:
$A R P_j=O_j \times D_i \sum\left(S_i \times R_{i j}\right)$ (1)
where, $R_{i j}$ represents the relationship score between the i-th risk event and the j-th risk agent, using a scale of 0 = no relationship, 1 = low, 3 = moderate, and 9 = strong.
3.4.2 HORshe Phase 2—Determination and prioritization of PAs
In HORshe Phase 2, alternative PAs were identified and classified according to the Hierarchy of Controls: Elimination, Substitution, Engineering Controls, Administrative Controls, and Personal Protective Equipment (PPE) (Table 4). Each preventive action is assigned a weighting factor based on its position in the hierarchy (SCk).
The Total Effectiveness (TEk) value was calculated using the following formula:
$T E_k=S C_k \times \sum\left(R_{k i} \times A R P_i\right)$ (2)
The ETDk was then calculated to determine the implementation priority of each Preventive Action:
$E T D_k=\frac{T E_k}{D_k}$ (3)
where, $D_k$ represents the degree of difficulty associated with implementing the preventive action, measured on a scale of 3 = low, 4 = moderate, and 5 = high.
3.4.3 HORshe Phase 3—Residual risk evaluation
In HORshe Phase 3, the Occurrence, Detection, and Severity values were reassessed after the implementation of PAs. The NARP was calculated using the same formula as the ARP, but with the updated parameter values. The NARP values were then compared with the initial ARP values to estimate the projected reduction in the ARP. The reassessed severity values represent the projected residual consequences following the verified implementation of PAs, rather than changes in the intrinsic hazard severity.
Table 4. Hierarchy of control strategy [14, 15, 31]
|
Hierarchy of Control |
Description |
AHP Scale |
|
Elimination |
Eliminating the hazard (e.g., discontinuing the use of hazardous chemicals or eliminating monotonous tasks or work activities that cause negative stress). |
9 |
|
Substitution |
Replacing existing products, materials, or systems with safer alternatives (e.g., replacing solvent-based paint with water-based paint). |
7 |
|
Engineering Control |
Modifying equipment, machinery, or the workplace to improve safety, isolating hazards, and implementing collective protection measures (e.g., installing machine guards, noise-dampening systems, or isolating electrical energy sources). |
5 |
|
Administrative Controls |
Implementing administrative and procedural measures (e.g., conducting routine inspections of safety equipment, providing training, and enforcing permit-to-work procedures). |
3 |
|
PPE |
Providing and ensuring the use of adequate personal protective equipment to protect workers from hazards (e.g., safety shoes, safety glasses, hearing protection, and gloves). |
1 |
Note: Analytical Hierarchy Process (AHP); Personal Protective Equipment (PPE)
3.5 Data analysis
Data analysis was conducted using a combination of quantitative and qualitative approaches. The quantitative approach was implemented through the full application of the HORshe methodology, including Phase 1 (ARP calculation), Phase 2 (ETDk calculation), and Phase 3 (NARP calculation). A qualitative approach was employed to interpret and contextualize the numerical results based on findings obtained from field observations, in-depth interviews, Focus Group Discussions (FGDs), and document reviews. The characteristics of the nine experts involved in the assessment are presented in Table 5.
Table 5. Characteristics of expert participants
|
No. |
Initials |
Years of Experience |
Company |
Position |
|
1 |
ATS |
17 years |
Plant A |
Supervisor |
|
2 |
EBS |
17 years |
Plant A |
Safety Officer |
|
3 |
DH |
14 years |
Plant B |
PSM Engineer |
|
4 |
DC |
12 years |
Plant B |
PSM Engineer |
|
5 |
AB |
17 years |
Plant C |
Assistant Vice President |
|
6 |
IR |
12 years |
Plant C |
Safety Officer |
|
7 |
TA |
14 years |
Plant C |
Safety Officer |
|
8 |
RBS |
9 years |
Plant D |
Safety Officer |
|
9 |
RL |
8 years |
Plant D |
Safety Officer |
4.1 General overview of the research site
Plant A is located in East Kalimantan, Indonesia, and is one of the largest producers of ammonia and urea fertilizers in Indonesia. The company’s production facilities include five ammonia, five urea, and several NPK plants.
4.2 Data collection
Data were collected through direct field observations conducted during the plant turnaround period, during which all reactors, vessels, and tanks were opened for inspection and maintenance activities. In addition, a Focus Group Discussion (FGD) was conducted involving nine certified General OHS practitioners from four ammonia companies in Indonesia.
In this study, the identification of risk events and risk agents constituted a crucial initial step prior to conducting further risk assessment. Risk events were identified by integrating data obtained from all the data collection methods described previously. This process was carried out at Plant A, specifically at the ammonia plant operating under Haldor Topsoe technology licensing. The primary confined space activities observed in this study are presented in the table of main confined space observation objects (Table 6). In addition to these major units, the researcher observed numerous smaller confined spaces, such as separators and heat exchangers, between the main vessels listed in Table 6.
Table 6. Main confined space observation objects
|
Confined Space |
Type |
Chemicals |
|
Fuel NG KO Drum |
A separator used to separate methane from its condensate. |
Natural gas or methane (gas) |
|
Desulfurizer |
A reactor used to remove sulfur from methane. |
Methane (gas), hydrogen sulfide (gas), zinc oxide catalyst (solid) |
|
Primary Reformer |
A reactor that converts methane into hydrogen by reacting it with steam. |
Methane (gas), hydrogen (gas), carbon monoxide (gas), carbon dioxide (gas), nickel catalyst (solid) |
|
Secondary Reformer |
A reactor that converts methane into hydrogen by reacting with oxygen. |
Hydrogen (gas), carbon monoxide (gas), carbon dioxide (gas), nitrogen (gas), RKS catalyst or ceramic rings (solid) |
|
High Temperature Shift |
A reactor that converts carbon monoxide into carbon dioxide and hydrogen is used. |
Hydrogen (gas), carbon monoxide (gas), carbon dioxide (gas), nitrogen (gas), LKS catalyst or copper-zinc-chromium oxide (solid) |
|
Low Temperature Shift |
A reactor that converts carbon monoxide into carbon dioxide and hydrogen is used. |
Hydrogen (gas), carbon monoxide (gas), carbon dioxide (gas), nitrogen (gas), LK-801 catalyst or copper-zinc-aluminum oxide (solid) |
|
Absorber and Stripper |
A separator used to remove carbon dioxide from the process gas. |
Hydrogen (gas), carbon dioxide (gas), nitrogen (gas), potassium carbonate (liquid) |
|
Methanator |
A reactor that converts carbon dioxide and carbon monoxide not absorbed in the absorber into methane. |
Hydrogen (gas), nitrogen (gas), methane (gas), nickel catalyst (solid) |
|
Ammonia Converter |
A reactor that reacts nitrogen and hydrogen to produce ammonia. |
Hydrogen (gas), nitrogen (gas), ammonia (gas), iron catalyst (solid) |
|
Bona Pipe |
An underground pipeline network that utilizes seawater as a cooling medium. |
Seawater (liquid) |
4.3 HORshe Phase 1—Risk identification and assessment
4.3.1 Mapping of risk events based on the SHELL model
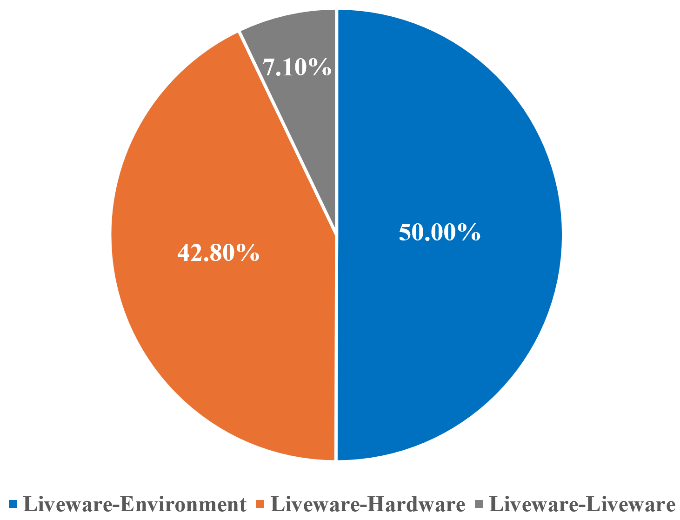
Based on the collected data, risk events were mapped using the SHELL model (Table 7), which consists of software (S), hardware (H), environment (E), and liveware (L) components [10]. The results identified 14 risk events, of which seven risk events (50.0%) were associated with Liveware-Environment interactions, six risk events (42.8%) were associated with Liveware-Hardware interactions, and one risk event (7.1%) was associated with Liveware-Liveware interactions.
Based on Table 7, the risks associated with confined space work are diverse and arise from interactions between the Liveware component and the Environment, Hardware, and other Liveware components of the SHELL model. The majority of the identified risk events belonged to the Liveware-Environment category, accounting for 7 of the 14 risk events (50.0%), including E1 (workers exposed to toxic gases), E2 (workers experiencing oxygen deficiency), E3 (workers exposed to explosions or fires caused by flammable gases), E5 (workers falling from a height), E6 (workers slipping or tripping due to slippery conditions and confined space structures), E10 (overheating/heat stress in confined spaces), and E12 (entrapment caused by narrow confined space access structures). These findings indicate that hazardous atmospheric conditions, restricted access, and adverse environmental conditions are the dominant sources of occupational risks.
Table 7. Risk event mapping
|
Code |
Risk Event |
Mapping |
|
E1 |
Workers exposed to toxic gases |
Liveware-Environment |
|
E2 |
Workers experiencing oxygen deficiency |
Liveware-Environment |
|
E3 |
Workers exposed to explosions or fires caused by flammable gases |
Liveware-Environment |
|
E4 |
Workers suffering electric shock |
Liveware-Hardware |
|
E5 |
Workers falling from height |
Liveware-Environment |
|
E6 |
Workers slipping or tripping due to slippery conditions and confined space structures |
Liveware-Environment |
|
E7 |
Delayed evacuation |
Liveware-Hardware |
|
E8 |
Secondary victim incidents resulting from attempts to rescue the first victim |
Liveware-Liveware |
|
E9 |
Loss of communication during emergencies |
Liveware-Hardware |
|
E10 |
Overheating/heat stress in confined spaces |
Liveware-Environment |
|
E11 |
Entrapment in substances (pall rings or catalysts) |
Liveware-Hardware |
|
E12 |
Entrapment caused by narrow confined space access structures |
Liveware-Environment |
|
E13 |
Workers being pinched, punctured, struck, or cut by work equipment |
Liveware-Hardware |
|
E14 |
Noise exposure |
Liveware-Hardware |
Liveware-Hardware interactions account for 6 risk events (42.8%), comprising E4 (workers suffering electric shock), E7 (delayed evacuation), E9 (loss of communication during emergencies), E11 (entrapment in substances such as pall rings or catalysts), E13 (workers being pinched, punctured, struck, or cut by work equipment), and E14 (noise exposure).
These findings highlight the importance of equipment integrity, electrical safety, communication systems, emergency response facilities, and safe work equipment in preventing occupational accidents in the petrochemical industry. Finally, only one risk event (7.1%), E8 (secondary victim incidents resulting from attempts to rescue the first victim), was classified as a Liveware-Liveware interaction, emphasizing the importance of effective communication, coordination, and strict adherence to rescue procedures to prevent additional casualties during confined space emergencies. Collectively, these findings demonstrate that environmental hazards represent the dominant source of occupational risk in confined space work, followed by equipment-related hazards, while human interaction contributes a smaller but equally critical risk, requiring effective communication and coordinated emergency response (Figure 2).
Figure 2. Distribution of risk events based on the SHELL model
4.3.2 Determination of risk event severity
Severity assessment was conducted based on the greatest impact on human aspects.
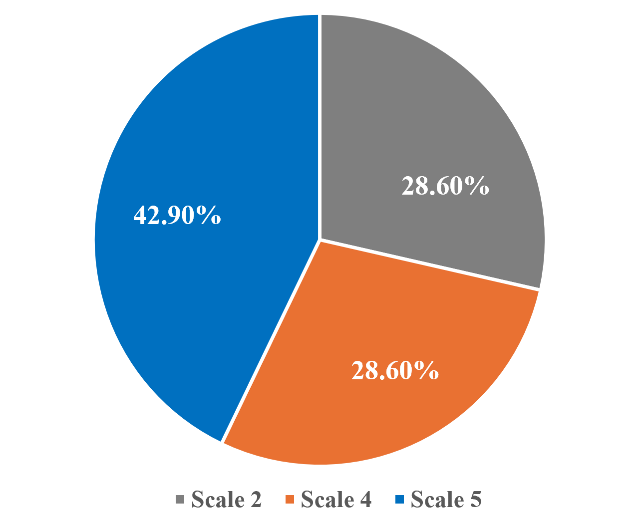
As shown in Table 8, the identified risk events exhibit varying levels of severity according to their potential consequences. Six risk events (42.9%) were assigned a severity score of 5, indicating catastrophic consequences that may result in multiple fatalities. These events include exposure to toxic gases, oxygen deficiency, explosions or fires caused by flammable gases, electric shock, delayed evacuation during emergencies, and secondary victim incidents resulting from attempts to rescue the first victim. Furthermore, four risk events (28.6%) were assigned a severity score of 4, indicating hazards that may result in a single fatality or major injury, including falls from height, loss of communication during emergencies, entrapment in catalysts or packing materials, and entrapment caused by restricted confined space access. The remaining four risk events (28.6%) were assigned a severity score of 2, representing hazards that may result in injuries requiring medical treatment, including slips or trips, heat stress, injuries caused by work equipment, and noise exposure. Overall, the Severity assessment indicates that confined space work is characterized by a substantial proportion of high-consequence hazards, with nearly half of the identified risk events classified at the catastrophic severity level. These findings highlight the importance of implementing effective preventive and protective measures to reduce occupational risks and improve worker safety (Figure 3).
Table 8. Severity of risk events for HORshe Phase 1
|
Code |
Risk Event |
Severity |
|
E1 |
Workers exposed to toxic gases |
5 |
|
E2 |
Workers experiencing oxygen deficiency |
5 |
|
E3 |
Workers exposed to explosions or fires caused by flammable gases |
5 |
|
E4 |
Workers suffering electric shock |
5 |
|
E5 |
Workers falling from height |
4 |
|
E6 |
Workers slipping or tripping due to slippery conditions and confined space structures |
2 |
|
E7 |
Delayed evacuation |
5 |
|
E8 |
Secondary victim incidents resulting from attempts to rescue the first victim |
5 |
|
E9 |
Loss of communication during emergencies |
4 |
|
E10 |
Overheating/heat stress in confined spaces |
2 |
|
E11 |
Entrapment in substances (pall rings or catalysts) |
4 |
|
E12 |
Entrapment caused by narrow confined space access structures |
4 |
|
E13 |
Workers being pinched, punctured, struck, or cut by work equipment |
2 |
|
E14 |
Noise exposure |
2 |
Figure 3. Distribution of severity scores for risk events (HORshe Phase 1)
4.3.3 Determination of risk agent occurrence
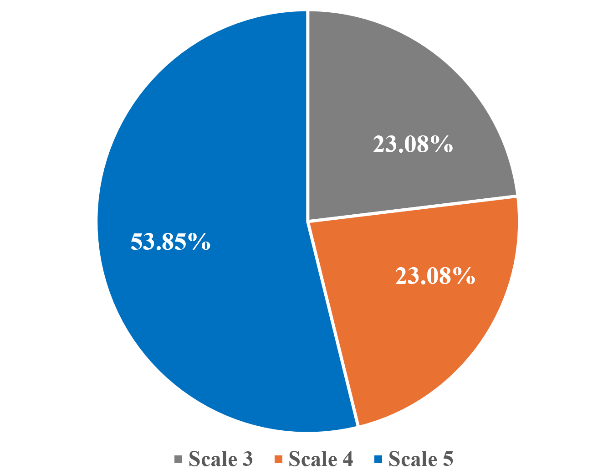
Occurrence assessment was conducted for each risk agent using a scale of 1–5. A total of 53.85% of the risk agents (A3, A4, A5, A7, A8, A10, and A11) were assigned an occurrence score of 5, indicating a very high likelihood of occurrence, while 23.08% were assigned an occurrence score of 4, and the remaining 23.08% were assigned an occurrence score of 3.
As shown in Table 9, the likelihood of risk occurrence in confined space work varies across five rating levels, with the majority, representing 53.85% (A3, A4, A5, A7, A8, A10, and A11), classified at an occurrence scale 5 (very high) owing to factors such as exposure to toxic gases, flammable gases, high-voltage electricity, and differences in elevation. Furthermore, 23.08% (A1, A2, and A12) were classified as occurrence scale 4 (high), influenced by inadequate worker knowledge, the absence of periodic atmospheric testing, and limited access. Another 23.08% (A6, A9, and A13) were classified at occurrence scale 3 (moderate, approximately 40–60%), resulting from heat stress, improper use of personal protective equipment (PPE), and the use of mechanical equipment. Overall, more than half of the identified risks exhibited a very high likelihood of occurrence in the absence of PAs, with a distribution of seven risk agents (53.85%) at scale 5, three risk agents (23.08%) at scale 4, and three risk agents (23.08%) at scale 3, underscoring the importance of implementing effective controls to reduce the probability of occupational accidents (Figure 4).
Table 9. Occurrence of risk agents for HORshe Phase 1
|
Code |
Risk Agent |
Occurrence |
|
A1 |
Workers’ lack of knowledge regarding confined space hazards (inadequate competence) |
4 |
|
A2 |
Failure to conduct atmospheric testing before entry and periodically during work |
4 |
|
A3 |
Work environments containing toxic gases such as ammonia, carbon monoxide, and hydrogen sulfide |
5 |
|
A4 |
Work environments containing flammable gases such as methane and hydrogen |
5 |
|
A5 |
Work environments containing inert gases such as nitrogen and carbon dioxide |
5 |
|
A6 |
Work environments with high temperatures (heat stress) |
3 |
|
A7 |
Use of electrical power exceeding 50 VAC and 120 VDC inside confined spaces |
5 |
|
A8 |
Work environments containing residual solid substances such as catalysts or confined space packing materials (pall rings) |
5 |
|
A9 |
Personal protective equipment (PPE) that is unsuitable for the type of hazard |
3 |
|
A10 |
Work environments with inadequate lighting |
5 |
|
A11 |
Work environments with significant elevation differences |
5 |
|
A12 |
Work environments containing obstacles (restricted access or confined space configurations) |
4 |
|
A13 |
Use of mechanical equipment in confined spaces (hammers, power tools, lifting gear, and pneumatic tools) |
3 |
Figure 4. Distribution of occurrence scores for risk agents (HORshe Phase 1)
4.3.4 Determination of risk agent detection
Detection assessment was conducted through discussions with experts using a scale of 1-5 [14, 15]. Risk agent A5 (inert gas) received the highest detection score (5) because gases such as nitrogen are odorless and colorless, making them extremely difficult to detect without specialized instruments. In contrast, risk agents A11 and A12 were assigned a detection score of 1 because these risks could be identified visually.
The detection assessment was conducted using a scale of 1-5, ranging from risks that are very easy to detect to those that cannot be detected at all. In general, the results presented in Table 10 indicate that most risks associated with confined space work were assigned detection scores of 2 and 3, meaning that they can be identified through observation or condition inspections. This includes A1, A6, and A9 (score of 2) and A2, A3, A4, and A7 (score of 3), which require detection instruments. In contrast, A5 was assigned a detection score of 5 because inert gases, such as nitrogen, are colorless and odorless, making them extremely difficult to detect. Meanwhile, A11 and A12 were assigned detection scores of 1 because these risks could be predicted visually.
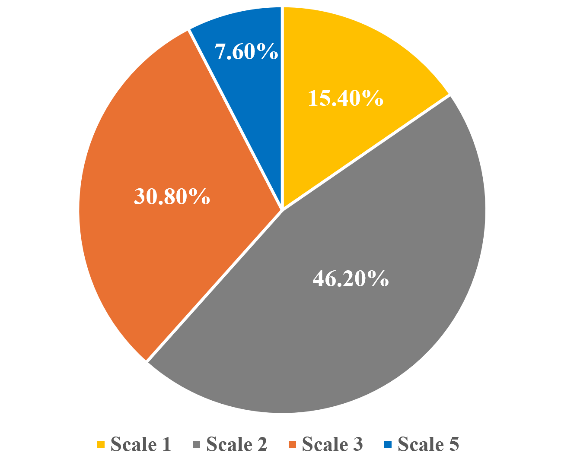
Overall, the distribution consisted of one risk agent (7.7%) at scale 5, four risk agents (30.8%) at scale 3, six risk agents (46.2%) at scale 2, and two risk agents (15.4%) at scale 1. These findings indicate that although most risks can still be detected, several critical hazards require more advanced detection and mitigation systems to ensure worker safety (Figure 5).
Table 10. Detection of risk agents for HORshe Phase 1
|
Code |
Risk Agent |
Detection |
|
A1 |
Workers’ lack of knowledge regarding confined space hazards (inadequate competence) |
2 |
|
A2 |
Failure to conduct atmospheric testing before entry and periodically during work |
3 |
|
A3 |
Work environments containing toxic gases such as ammonia, carbon monoxide, and hydrogen sulfide |
3 |
|
A4 |
Work environments containing flammable gases such as methane and hydrogen |
3 |
|
A5 |
Work environments containing inert gases such as nitrogen and carbon dioxide |
5 |
|
A6 |
Work environments with high temperatures (heat stress) |
2 |
|
A7 |
Use of electrical power exceeding 50 VAC and 120 VDC inside confined spaces |
3 |
|
A8 |
Work environments containing residual solid substances such as catalysts or confined space packing materials (pall rings) |
2 |
|
A9 |
Personal protective equipment (PPE) that is unsuitable for the type of hazard |
2 |
|
A10 |
Work environments with inadequate lighting |
2 |
|
A11 |
Work environments with significant elevation differences |
1 |
|
A12 |
Work environments containing obstacles (restricted access or confined space configurations) |
1 |
|
A13 |
Use of mechanical equipment in confined spaces (hammers, power tools, lifting gear, and pneumatic tools) |
2 |
Figure 5. Distribution of detection scores for risk agents (HORshe Phase 1)
4.3.5 Calculation of Aggregate Risk Potential
The ARP value was calculated using the following formula:
$A R P_j=O_j \times D_j \times \sum\left(S_i \times R_{i j}\right)$ (4)
An example of this calculation is presented below.
$\begin{aligned} & A R P_1=4 \times 2 \times[ (5 \times 9)+(5 \times 9)+(5 \times 9)+(5 \times 9) \\ &+(5 \times 9)+(4 \times 9)+(2 \times 9)+(5 \times 9) \\ &+(5 \times 9)+(4 \times 9)+(2 \times 9)+(4 \times 9) \\ &+(4 \times 9)+(2 \times 9)] \\ & A R P_1=4,104\end{aligned}$
Based on the ARP calculation (Table 11), the highest-priority risk agent was A5 (inert entry) because of its severe consequences, association with multiple risk events, and very low detectability owing to the characteristics of inert gases, such as nitrogen, which are colorless and odorless. The second priority was A1 (workers’ lack of knowledge regarding confined space hazards), which exhibited a high ARP value because it was related to nearly all identified risk events and had a high occurrence score, despite being relatively easier to detect. The third priority was A4 (work environments containing flammable gases such as methane and hydrogen), which is highly relevant to ammonia plant processes, is associated with several risk events, and requires gas detectors to ensure that gas concentrations remain below the established explosive limits.
Table 11. Aggregate Risk Potential (ARP) values for HORshe Phase 1
|
Code |
Risk Agent |
ARP |
Priority Ranking |
|
A5 |
Work environments containing inert gases such as nitrogen and carbon dioxide |
4,250 |
1 |
|
A1 |
Workers’ lack of knowledge regarding confined space hazards (inadequate competence) |
4,104 |
2 |
|
A4 |
Work environments containing flammable gases such as methane and hydrogen |
3,600 |
3 |
|
A8 |
Work environments containing residual catalysts or confined space packing materials |
3,030 |
4 |
|
A3 |
Work environments containing toxic gases such as ammonia, carbon monoxide, and hydrogen sulfide |
2,775 |
5 |
|
A2 |
Failure to conduct atmospheric testing before entry and periodically during work |
2,436 |
6 |
|
A9 |
Personal protective equipment (PPE) that is unsuitable for the type of hazard |
2,322 |
7 |
|
A10 |
Work environments with inadequate lighting |
2,040 |
8 |
|
A7 |
Use of electrical power exceeding 50 VAC and 120 VDC inside confined spaces |
1,995 |
9 |
|
A6 |
Work environments with high temperatures (heat stress) |
1,002 |
10 |
|
A13 |
Use of mechanical equipment in confined spaces (hammers, power tools, lifting gear, and pneumatic tools) |
918 |
11 |
|
A12 |
Work environments containing obstacles (restricted access or confined space configurations) |
860 |
12 |
|
A11 |
Work environments with significant elevation differences |
715 |
13 |
Figure 6. Pareto analysis of Aggregate Risk Potential (ARP)
4.3.6 Pareto analysis and selection of priority risk agents
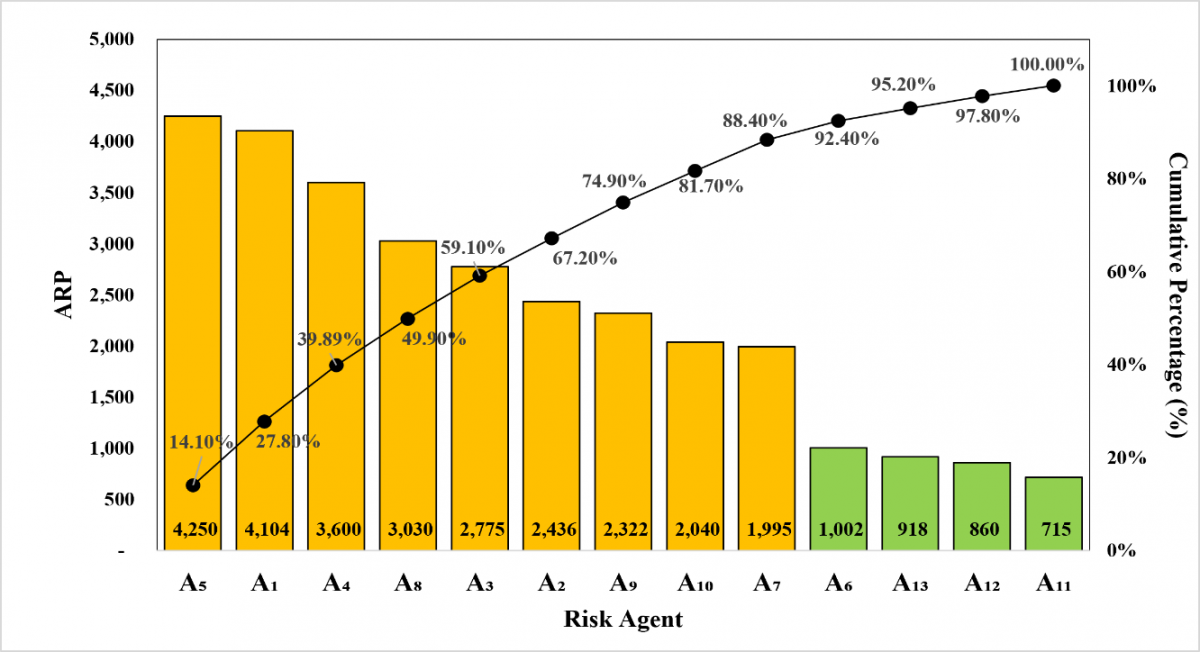
The Pareto diagram was used to assist the researchers in prioritizing interventions for the most dominant contributing factors, although the 80/20 principle is not rigid and may be adjusted according to the context of the data [32, 33]. The Pareto analysis result indicated that 88.4% of the cumulative risk agent values contributed significantly to the occurrence of risk events (Figure 6); therefore, these risk agents were designated as priorities for mitigation. The determination of this threshold was further validated through expert discussions, particularly considering the extensive use of electrical equipment in confined space work, where the severity level may reach scale 5, indicating the potential for multiple fatalities (Table 12). Consequently, nine priority risk agents were selected for further analysis in HORshe Phase 2.
Table 12. Results of risk agent mapping based on Pareto analysis
|
Code |
Risk Agent |
ARP |
Percentage |
Cumulative |
|
A5 |
Work environments containing inert gases such as nitrogen and carbon dioxide |
4,250 |
14% |
14.1% |
|
A1 |
Workers’ lack of knowledge regarding confined space hazards (inadequate competence) |
4,104 |
14% |
27.8% |
|
A4 |
Work environments containing flammable gases such as methane and hydrogen |
3,600 |
12% |
39.8% |
|
A8 |
Work environments containing residual catalysts or confined space packing materials |
3,030 |
10% |
49.9% |
|
A3 |
Work environments containing toxic gases such as ammonia, carbon monoxide, and hydrogen sulfide |
2,775 |
9% |
59.1% |
|
A2 |
Failure to conduct atmospheric testing before entry and periodically during work |
2,436 |
8% |
67.2% |
|
A9 |
Personal protective equipment (PPE) that is unsuitable for the type of hazard |
2,322 |
8% |
74.9% |
|
A10 |
Work environments with inadequate lighting |
2,040 |
7% |
81.7% |
|
A7 |
Use of electrical power exceeding 50 VAC and 120 VDC inside confined spaces |
1,995 |
7% |
88.4% |
|
A6 |
Work environments with high temperatures (heat stress) |
1,002 |
3% |
92.4% |
|
A13 |
Use of mechanical equipment in confined spaces (hammers, power tools, lifting gear, and pneumatic tools) |
918 |
3% |
95.2% |
|
A12 |
Work environments containing obstacles (restricted access or confined space configurations) |
860 |
3% |
97.8% |
|
A11 |
Work environments with significant elevation differences |
715 |
2% |
100.0% |
4.4 HORshe Phase 2—Determination and prioritization of Identification of Preventive Actions
4.4.1 Identification of Preventive Actions
Based on the nine priority risk agents, 13 PAs (PA1–PA13) were identified and classified according to the Hierarchy of Controls [12, 13, 27]. These actions consisted of elimination (PA1, PA5, and PA8), substitution (PA9 and PA11), Engineering Controls (PA2, PA6, PA7, and PA10), Administrative Controls (PA3, PA12, and PA13), and Personal Protective Equipment (PPE) (PA4) (Table 13).
Table 13. Effectiveness to Difficulty Ratio (ETDk) Values and Priority of Preventive Actions (PAs)
|
Code |
Preventive Action |
Hierarchy of Control |
ETDk |
Priority |
|
PA5 |
Eliminating the involvement of incompetent workers through mandatory certification as Confined Space Occupational Health and Safety (OHS) Technicians issued by the Ministry of Manpower for all confined space workers. |
Elimination |
537,678 |
1 |
|
PA1 |
Eliminating the potential entry of inert, toxic, or flammable gases from connected vessels by isolating the inlet and outlet lines using blinds and lockout/tagout (LOTO) procedures. |
Elimination |
264,728 |
2 |
|
PA13 |
Implementing administrative control by conducting awareness training before the project begins to improve workers’ understanding of confined space hazards and work procedures. |
Administrative Control |
238,968 |
3 |
|
PA6 |
Engineering the internal vessel atmosphere through draining, venting, inerting, and forced ventilation using blowers or ejectors until atmospheric parameters comply with Threshold Limit Values (TLVs). |
Engineering Control |
224,325 |
4 |
|
PA2 |
Engineering access, monitoring, and evacuation systems for confined space work through the installation of wireless UHF cameras, rope access, and rescue systems as engineered access and retrieval systems, and the use of portable gas detectors by authorized personnel. |
Engineering Control |
220,455 |
5 |
|
PA12 |
Implementing administrative control by requiring gas testing and completion of safety release checks by certified testing personnel before confined space work begins. |
Administrative Control |
148,923 |
6 |
|
PA3 |
Implementing administrative controls through confined space permits, confined space work procedures, authorized personnel and rescuers, medical examinations, safety signs, safety release checks, and entry boards. |
Administrative Control |
147,708 |
7 |
|
PA8 |
Eliminating the use of high-voltage equipment by limiting the voltage of power tools and lighting to a maximum of 50 VAC or 120 VDC. |
Elimination |
123,458 |
8 |
|
PA9 |
Substituting electrical equipment with pneumatic tools powered by compressed air reduces the potential for electrical energy exposure. |
Substitution |
118,440 |
9 |
|
PA7 |
Implementing engineered rope access and rescue systems, temporary vertical access systems (scaffolding), and scaffold-based temporary working platforms. |
Engineering Control |
70,805 |
10 |
|
PA4 |
Providing standard and task-specific PPE (e.g., airline respirators, chemical suits, half-face masks, full-body harnesses). |
Personal Protective Equipment (PPE) |
62,024 |
11 |
|
PA11 |
Substituting mechanical tools that may generate sparks with non-sparking tools made of brass. |
Substitution |
56,700 |
12 |
|
PA10 |
Engineering electrical protection systems through the installation of Earth Leakage Circuit Breakers (ELCBs), functional testing using RCD/RCCB testers, and cable protection using protective hoses. |
Engineering Control |
28,415 |
13 |
4.4.2 Calculation of Total Effectiveness (TEk)
The Total Effectiveness (TEk) value was calculated using the following formula:
$T E_k=S C_k \times \sum\left(R_{k j} \times A R P_j\right)$ (5)
An example of this calculation is presented below.
$\begin{aligned} T E_1=9 \times((9 \times & 4,250)+(1 \times 4,104)+(9 \times 3,600) \\ & +(9 \times 3,030)+(3 \times 2,775) \\ & +(3 \times 2,436)+(0 \times 2,322) \\ & +(0 \times 2,040)+(0 \times 1,995) \\ T E_1=1,058,913 & \end{aligned}$
PA5 achieved the highest Total Effectiveness (TEk) value of 2,150,712, indicating its strong effectiveness in eliminating the risk associated with worker incompetence.
4.4.3 Calculation of Effectiveness-to-Difficulty Ratio and prioritization of Preventive Actions
The ETDk was calculated using the following formula:
$E T D_k=\frac{T E_k}{D_k}$ (6)
An example of the calculation for PA1 is presented as follows:
$\begin{aligned} & E T D_1=\frac{1,058,913}{4} \\ & E T D_1=264,728\end{aligned}$
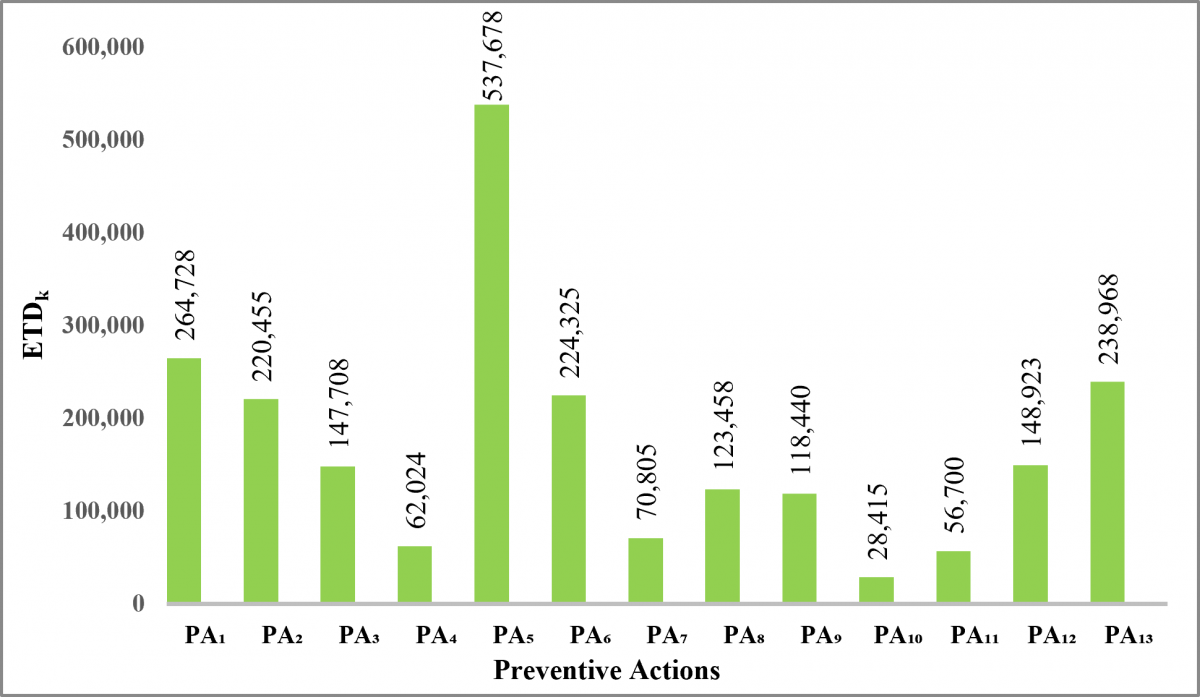
Figure 7 shows that PA5 (mandatory certification for confined space OHS technicians) obtained the highest ETDk value (537,678), followed by PA1 (blind isolation and lockout/tagout [LOTO], 264,728), and PA13 (awareness training, 238,968).
Figure 7. Effectiveness to difficulty ratio (ETDk) values for Preventive Actions (PAs)
4.5 HORshe Phase 3—Residual risk evaluation
The implementation of the proposed PAs was carried out during the two-week preparation period before the turnaround and continued throughout the first two days of turnaround execution. Initially, awareness training on safe confined space work practices was provided to workers who had previously obtained certification as Confined Space OHS technicians. This was followed by coordination meetings involving the OHS, Project Planning, Process Management, Operations, Electrical and Mechanical Maintenance Departments to ensure that all PAs were integrated into the turnaround schedule, including their implementation sequence and assigned responsibilities.
Before confined space entry was authorized, safety inspectors from the OHS Department conducted field verification to confirm that all PAs had been fully implemented in accordance with the predetermined control plan. In addition, all workers were granted Stop Work Authority, enabling them to suspend or postpone work whenever any required control measure was satisfactorily implemented.
Following field verification, the Severity, Occurrence, and Detection parameters were reassessed through structured Focus Group Discussions (FGDs) involving expert consensus in accordance with the HORshe Phase 3 methodology. This reassessment was undertaken to estimate the projected residual risk under the implemented control measures rather than to demonstrate confirmed long-term operational safety performance, which would require extended operational monitoring and safety performance data. Accordingly, the post-mitigation severity values represent expert-based estimates of the expected residual consequences after the verified control measures had been implemented, rather than changes in the intrinsic severity of the original hazards.
For example, blind isolation prevents the ingress of inert, toxic, and flammable gases from interconnected process equipment into the confined space, thereby substantially reducing the expected consequences of hazardous atmospheric exposure. Likewise, engineering controls, such as rope access systems, full-body harnesses, and lifelines, reduce the expected consequences of falls from elevated work locations or into catalyst beds. Furthermore, replacing electrically powered tools with pneumatic equipment eliminates potential ignition sources in flammable atmospheres while simultaneously removing workers' exposure to electrical hazards. Consequently, the expected consequences of hazardous gas exposure, fire, explosion, falls, and electrical shock were considered substantially lower after implementing the verified control measures.
However, the implementation of PAs does not eliminate occupational risk because residual risk is inherently dynamic and may change over time owing to variations in workplace conditions, equipment integrity, operational activities, environmental factors, and human performance. Therefore, the reassessed severity values should be interpreted as expert-based estimates of the projected residual consequences under the implemented control measures at the time of assessment, rather than as permanent reductions in risk severity. Continuous monitoring, periodic reassessment, and ongoing implementation of risk controls remain essential to ensure that residual risks are maintained at an acceptable level throughout the operational lifecycle.
Based on the post-mitigation reassessment, the occurrence values decreased for all risk agents, with five risk agents (55.6%) classified as Scale 1 and four risk agents (44.4%) as Scale 2. Likewise, all Detection values improved to Scale 1 (100%), indicating that the implemented control measures substantially enhanced hazard detectability. The reassessed severity values showed that nine risk events (64.3%) were classified as Scale 2 and five risk events (35.7%) as Scale 1, representing the projected residual consequences following the implementation of PAs.
The NARP was calculated using the same formula as follows:
$A R P_j=O_j \times D_j \sum\left(S_j \times R_{i j}\right)$ (7)
An example of this calculation is presented below:
$\begin{aligned} A R P_1=2 \times 1 \times[ & (2 \times 9)+(2 \times 9)+(2 \times 9)+(2 \times 3) \\ & +(2 \times 9)+(2 \times 9)+(2 \times 9)+(2 \times 9) \\ & +(1 \times 9)+(1 \times 3)+(1 \times 9)+(1 \times 9) \\ & +(1 \times 9)+(2 \times 9)]\end{aligned}$
$A R P_1=414$
This calculation was also performed for several priority risk agents, namely A3, A10, A9, A5, A8, A4, A2, and A7.
The results presented in Table 14 indicate that the risk agent related to workers' lack of knowledge regarding confined space hazards (i.e., inadequate competence) (A1) became the highest-priority residual risk following the HORshe Phase 3 evaluation, whereas the highest-priority risk agent before implementation of the PAs was the work environment containing inert gases, such as nitrogen and carbon dioxide (A5). Nevertheless, the ARP value for risk agent A1 was estimated to decrease by 89.91%, whereas the ARP value for risk agent A5 was estimated to decrease by 96.24%.
Furthermore, the largest estimated reduction in ARP was observed for the risk agent associated with the use of electrical systems exceeding 50 VAC and 120 VDC in confined spaces (A7), with an estimated reduction of 98.80%. Overall, the HORshe Phase 3 evaluation estimated that the implemented PAs could reduce the ARP by an average of 94.75% compared with the initial risk condition. This estimated reduction was derived from the post-mitigation reassessment of the Severity, Occurrence, and Detection parameters through a structured expert consensus process conducted during the turnaround period. Therefore, the reported reduction should be interpreted as an expert-based estimate of the projected residual risk under the implemented PAs at the time of assessment, recognizing that occupational risks remain dynamic and require continuous monitoring and periodic reassessment.
Table 14. Aggregate Risk Potential (ARP) values in HORshe Phase 3—Comparison before and after mitigation
|
Code |
Risk Agent |
New ARP |
Previous ARP |
Priority |
Risk Reduction |
|
A1 |
Workers’ lack of knowledge regarding confined space hazards (inadequate competence) |
414 |
4,104 |
1 |
89.91% |
|
A3 |
Work environments containing toxic gases such as ammonia, carbon monoxide, and hydrogen sulfide |
172 |
2,775 |
2 |
93.80% |
|
A10 |
Work environments with inadequate lighting |
168 |
2,040 |
3 |
91.76% |
|
A9 |
Personal protective equipment (PPE) that is unsuitable for the type of hazard |
165 |
2,322 |
4 |
92.89% |
|
A5 |
Work environments containing inert gases such as nitrogen and carbon dioxide |
160 |
4,250 |
5 |
96.24% |
|
A8 |
Work environments containing residual catalysts or confined space packing materials |
132 |
3,030 |
6 |
95.64% |
|
A4 |
Work environments containing flammable gases such as methane and hydrogen |
105 |
3,600 |
7 |
97.08% |
|
A2 |
Failure to conduct atmospheric testing before entry and periodically during work |
83 |
2,436 |
8 |
96.59% |
|
A7 |
Use of electrical power exceeding 50 VAC and 120 VDC inside confined spaces |
24 |
1,995 |
9 |
98.80% |
|
Average ARP Reduction: 94.75% |
|||||
4.6 Advantages of the HORshe method in confined space risk analysis
The HORshe method offers significant advantages over the JSA and HIRA methods, currently used at the research site.
HORshe encompasses a more comprehensive set of parameters, including additional components such as Detection, the SHELL model, the degree of implementation difficulty, preventive action evaluation, and the analysis of relationships between risk agents and risk events (Table 15). The integration of the SHELL model enables a holistic examination of the interactions among workers, equipment, systems, and environmental conditions of the work environment. By incorporating implementation difficulty through the ETDk, HORshe produces risk control recommendations that are more practical and can be prioritized rationally based on a balanced consideration of both effectiveness and ease of implementation.
Table 15. Comparison of HORshe, Job Safety Analysis (JSA), and Hazard Identification and Risk Assessment (HIRA) at the research site
|
Parameter |
HORshe |
JSA |
HIRA |
|
Severity |
√ |
√ |
√ |
|
Occurrence |
√ |
√ |
√ |
|
Detection |
√ |
|
|
|
SHELL Model |
√ |
|
|
|
Degree of Difficulty |
√ |
|
|
|
Preventive Action Evaluation |
√ |
|
|
|
Activity Description |
√ |
√ |
|
|
Relationship between risk agents and risk events |
√ |
|
|
|
Residual Risk |
√ |
|
√ |
4.7 Managerial implications
The results of the risk analysis using the HORshe method indicate that PAs should be established as mandatory prerequisites for all confined space work, particularly during plant turnaround activities. During this period, risk levels increase significantly because numerous process equipment units are opened for inspection, cleaning, and repair; multiple tasks are carried out simultaneously; large numbers of workers and contractors are involved; and all activities are performed under strict schedule constraints. Therefore, PAs must be fully integrated into turnaround planning, including the work breakdown structure, project schedules, and Stop Work Authority mechanisms. Work should not commence until all critical controls have been verified, including energy isolation, atmospheric testing, ventilation, gas detectors, personal protective equipment (PPE), standby personnel, rescue team readiness, and worker competency. The principle of Stop Work Authority serves as a fundamental safeguard to ensure that safety is maintained without compromising the project objectives.
From a managerial perspective, HORshe provides a quantitative framework for prioritizing risk-control measures. The ARP is used to identify critical risk agents, the ETDk is used to select PAs that are both effective and feasible, and the NARP is used to evaluate residual risks following mitigation. Consequently, safety-related decisions are based not only on experience and professional judgment but also on measurable and systematic analyses. Effective implementation requires a clear allocation of responsibilities among project management, operations, maintenance, and OHS departments to ensure that turnaround activities are conducted safely, systematically, and in support of achieving zero incidents.
This study successfully identified 14 risk events associated with confined space work, dominated by liveware-environment interactions (50.0%), followed by liveware-hardware interactions (42.8%) and liveware-liveware interactions (7.1%). In addition, 13 principal risk agents were identified, including hazardous atmospheres, restricted access, high-risk equipment, and inadequate worker competence. The assessment of Severity, Occurrence, and Detection indicated that confined space work is characterized by a high proportion of hazards with serious to fatal potential consequences, emphasizing the need for comprehensive risk control measures. The highest ARP was associated with inert gas environments (A5), followed by inadequate worker competence (A1), flammable gases (A4), the presence of catalysts (A8), and toxic gases (A3), confirming that atmospheric hazards and human factors are the dominant sources of occupational risk.
The prioritization of PAs based on the ETDk identified mandatory confined space competency certification, blind isolation, awareness training, atmospheric control, and monitoring and rescue systems as the highest-priority PAs. A total of 13 PAs were implemented during the turnaround period and systematically structured according to the Hierarchy of Control. The HORshe Phase 3 evaluation provided an expert-based estimate that the implemented PAs could reduce the ARP, with the largest estimated reductions observed for A7 (98.80%), A4 (97.08%), A2 (96.59%), and A5 (96.24%). The post-mitigation reassessment further indicated that inadequate worker competence (A1) and toxic gas exposure (A3) remained the most significant residual risks. These findings demonstrate the potential of the integrated HORshe framework to systematically identify, prioritize, and evaluate occupational risks through a structured post-mitigation expert reassessment.
Although the implemented PAs demonstrated substantial potential for reducing occupational risks, the HORshe Phase 3 evaluation represents an expert-based estimate of the projected residual risk at the time of assessment rather than confirmed long-term operational safety performance. Moreover, residual risk remains inherently dynamic and may change with variations in workplace conditions, equipment integrity, operational activities, environmental factors, and human performance. Therefore, continuous monitoring, periodic reassessment, and validation using operational safety performance data are required to confirm the long-term effectiveness of the implemented PAs.
Future research should involve a broader range of petrochemical industries, including urea, ammonium nitrate, and soda ash plants, to improve the generalizability of these findings to other petrochemical industries. In addition, long-term studies are recommended to validate the operational effectiveness of the implemented PAs using safety performance indicators, such as accident records, near-miss reports, compliance monitoring, and atmospheric testing results. Further comparative studies involving HORshe, HIRA, FTA, and FMEA are recommended to evaluate their relative effectiveness and applicability across different industrial contexts and organizational safety management systems.
The authors extend their gratitude to all practitioners who participated in the Focus Group Discussions (FGDs) and contributed to the risk validation process.
[1] Alhamdani, Y.A., Hassim, M.H., Shaik, S.M. (2024). A holistic approach for assessing occupational health risk due to fugitive emissions in petrochemical processes: Inherent health hazard level index (IHHLI). Canadian Journal of Chemical Engineering, 102(11): 3676-3691. https://doi.org/10.1002/cjce.25404
[2] Yu, K., Liu, P., Zhou, L., Feng, R. (2024). Research on integration of safety policy system in petrochemical enterprises based on risk hierarchical control and hidden danger investigation. Sustainability, 16(20): 8746. https://doi.org/10.3390/su16208746
[3] Dasgupta, A., Islam, M.M. (2024). Engineering management perspectives on safety culture in chemical and petrochemical plants: A systematic review. Academic Journal on Science, Technology, Engineering & Mathematics Education, 1(1): 10-69593. https://papers.ssrn.com/sol3/papers.cfm?abstract_id=5049271.
[4] Hien, N.N., Kiet, N.T., Nguyen, A.T. (2024). The influence of safety culture on safety attitude, personnel error behavior, and safety citizenship behavior: Research in the Vietnam oil and gas industry. International Journal of Safety and Security Engineering, 14(2): 399-409. https://doi.org/10.18280/ijsse.140208
[5] Wen, I.J., Liang, C.W. (2021). Integration of safety knowledge into three-dimensional model design and construction plan from the perspective of project executors in petrochemical industry. International Journal of Safety and Security Engineering, 11(2): 185-192. https://doi.org/10.18280/ijsse.110207
[6] Sajedian, A.A., Karimi, A., Yarandi, M.S., Moshiran, V.A., Koozekonan, A.G., Golbabaei, F. (2023). Quantitative risk assessment of respiratory exposure to acrylonitrile vapor in petrochemical industry by U.S. Environmental Protection Agency method: A cross-sectional study. Medical Gas Research, 13(3): 142-148. https://doi.org/10.4103/2045-9912.350859
[7] da Silva, C.M.I., Amaral, F.G. (2025). Participatory risk diagnosis: A preliminary approach to confined space work in the oil, gas, and petrochemical industries. Work, 80(1): 212-223. https://doi.org/10.3233/WOR-230703
[8] da Silva, C.M.I., Amaral, F.G. (2025). Study on safely working in confined spaces in the petroleum industry: Risk factors, current control procedures, and alternatives. Journal of Industrial Safety, 2(2): 90-98. https://doi.org/10.1016/j.jinse.2025.04.005
[9] Dermawan, B.C., Asy’ari, M.K. (2025). Full-scale task risk assessment of crude oil tank cleaning job using qualitative risk matrix and control in PT. saka (indonesia-pangkah) limited. IOP Conference Series: Earth and Environmental Science, 1473(1): 012042. https://doi.org/10.1088/1755-1315/1473/1/012042
[10] Selman, J., Spickett, J., Jansz, J., Mullins, B. (2019). Confined space rescue: A proposed procedure to reduce the risks. Safety Science, 113: 78-90. https://doi.org/10.1016/j.ssci.2018.11.017
[11] Arifin, K., Ahmad, M.A., Abas, A., Juhari, M.L., Ali, M.X.M., Mohd Fadzil, L. (2024). Identification of root cause of fatal confined space incidents in Malaysia and strategies for prevention. Discover Sustainability, 5(1): 36. https://doi.org/10.1007/s43621-024-00197-3
[12] Chiu, C.C., Chang, Y.M., Wan, T.J. (2020). Characteristic analysis of occupational confined space accidents in Taiwan and its prevention strategy. International Journal of Environmental Research and Public Health, 17(5): 1752. https://doi.org/10.3390/ijerph17051752
[13] Stefana, E., Marciano, F., Paltrinieri, N., Cocca, P. (2024). A systematic approach to develop safety-related undesired event databases for machine learning analyses: Application to confined space incidents. Process Safety and Environmental Protection, 182: 279-297. https://doi.org/10.1016/j.psep.2023.11.046
[14] Sudiarno, A., Majid, M.B., Rizkiyah, E., Fikri, M.N., Ramli, A. (2025). HORshe: A novel systematic method for safety risk assessment using shell and hierarchy of control. MethodsX, 15: 103669. https://doi.org/10.1016/j.mex.2025.103669
[15] Pasaribu, A., Sudiarno, A. (2024). Risk management practices using the house of risk for safety, health, etc.(HORshe) method: A case study on wastewater treatment in the pharmaceutical industry. In 2024 IEEE International Symposium on Consumer Technology (ISCT), Kuta, Bali, Indonesia, pp. 547-553. https://doi.org/10.1109/ISCT62336.2024.10791136
[16] Sudiarno, A., Ma’arij, A.M.D. (2023). System safety assessment of the warehouse operation using functional resonance analysis method and resilience analysis grid. Kesmas, 18(4): 271-278. https://doi.org/10.21109/kesmas.v18i4.7396
[17] Yang, C., Liu, Y., Dong, Y., Hao, S., Liu, Y., Qin, Y. (2025). Analysis of research hotspots and trends in confined-space work safety based on CiteSpace. Applied Sciences, 15(5): 2452. https://doi.org/10.3390/app15052452
[18] Duong, P.A., Lee, J., Kang, H. (2025). LPG dispersion in confined spaces: A comprehensive review. Engineering Reports, 7(3): e70064. https://doi.org/10.1002/eng2.70064
[19] Dhanistha, W.L., Silvianita, S. (2023). Risk analysis of hot working in confined space using confined space risk analysis (CRSA) and bowtie analysis method on LPG tanker repair process. Maritime Park: Journal of Maritime Technology and Society, 2(1): 22-27. https://doi.org/10.62012/mp.v2i1.25486
[20] Mufaidah, V., Dwiyanti, E. (2022). Hazard identification of welding in confined space of the cement production company. The Indonesian Journal of Public Health, 17(1): 132-144. https://doi.org/10.20473/ijph.v17i1.2022.132-144
[21] Byeon, J., Park, H., Ko, W. (2024). Comparative analysis of electrostatic charging characteristics considering the flow conditions of nonconductive flammable liquids. Energies, 17(23): 5987. https://doi.org/10.3390/en17235987
[22] Ayomoh, M., Ongwae, B. (2025). A systematic review of asset integrity and process safety management sustainability for onshore petrochemical installations. Sustainability, 17(1): 286. https://doi.org/10.3390/su17010286
[23] Jia, J., Wang, X., Xu, Y., et al. (2024). Digital twin technology and ergonomics for comprehensive improvement of safety in the petrochemical industry. Process Safety Progress, 43(3): 507-522. https://doi.org/10.1002/prs.12575
[24] Fithri, P., Wirdianto, E., Asri, Y.O. (2020). Risk assessment in confined space of the ship repair at PT Bandar Abadi ship builders and dry-docks. AIP Conference Proceedings, 2227(1): 040001. https://doi.org/10.1063/5.0001026
[25] Gulen, M.F., Soares, C.G., Arslan, O. (2025). A comprehensive risk assessment of enclosed space operations on ships. Reliability Engineering & System Safety, 111543. https://doi.org/10.1016/j.ress.2025.111543
[26] Mombelli, M., Reis, R., Zilly, A., Marziale, M., Braga, W., Santos, C. (2022). Risk factors for working in confined spaces: Contributions for psychosocial assessment. Paidéia (Ribeirão Preto), 32: e3212. https://doi.org/10.1590/1982-4327e3212
[27] Mentes, A., Mollaahmetoglu, E. (2022). A resilient approach of safety assessment for confined space operations on FPSO units. Ocean Engineering, 252: 111141. https://doi.org/10.1016/j.oceaneng.2022.111141
[28] Mustafa, A.M., Al-Mahadin, A. (2018). Risk assessment of hazards due to the installation and maintenance of onshore wind turbines. In: 2018 Advances in Science and Engineering Technology International Conferences (ASET), Dubai, Sharjah, Abu Dhabi, United Arab Emirates, pp. 1-7. https://doi.org/10.1109/ICASET.2018.8376789
[29] Salasamuharram, F., Hamid, A.H., Zikria, V., et al. (2024). Mitigation of Gayo Arabica coffee supply chain risk using the house of risk method in Aceh Tengah. IOP Conference Series: Earth and Environmental Science, 1297(1): 012064. https://doi.org/10.1088/1755-1315/1297/1/012064
[30] Setiawan, E., Mahendra, T. (2024). Formulating disaster mitigation strategies for Surakarta City, Indonesia by using risk matrix and house of risk phase 2. E3S Web of Conferences, 517: 03002. https://doi.org/10.1051/e3sconf/202451703002
[31] Ajslev, J.Z.N., Møller, J.L., Andersen, M.F., Pirzadeh, P., Lingard, H. (2022). The hierarchy of controls as an approach to visualize the impact of occupational safety and health coordination. International Journal of Environmental Research and Public Health, 19(5): 2731. https://doi.org/10.3390/ijerph19052731
[32] Keumalasari, S., Hamid, A.H., Indra, I., Nugroho, A. (2025). Risk management in sustainable patchouli supply chain. International Journal of Safety and Security Engineering, 15(5): 963-972. https://doi.org/10.18280/ijsse.150510
[33] Alkiayat, M. (2021). A practical guide to creating a Pareto chart as a quality improvement tool. Global Journal on Quality and Safety in Healthcare, 4(2): 83-84. https://doi.org/10.36401/jqsh-21-x1