

Bayu Budi Irawan | Dewanti* | Sigit Priyanto | Muhammad Hadid
© 2026 The authors. This article is published by IIETA and is licensed under the CC BY 4.0 license (http://creativecommons.org/licenses/by/4.0/).
OPEN ACCESS
Railway accidents remain a major challenge in the transportation sector, especially in Indonesia, as a developing country. To strengthen transportation safety governance, the Indonesian Government enacted Regulation No. 62 of 2013 on transportation accident investigation, with particular emphasis on railway accidents. A longitudinal study empirically measuring this safety policy against train accident trends in Indonesia remains limited. This study aims to analyze the association between railway transportation safety policies and accident trends in Indonesia, using interrupted time series analysis (ITSA). The results indicate that railway accident trends experienced a structural change following the implementation of the policy. The 2014 model, interpreted as a one-year lagged intervention model, provides a more empirically consistent explanation of the delayed translation of policy into operational safety practices. The pre-intervention slope was negative (= −1.786), indicating that accident counts had already been declining before the intervention. After the intervention, the post-intervention slope remained negative but became less steep (= −0.428), suggesting that accident counts continued to decline, although at a slower rate. The findings show that the Government Regulation No. 62/2013 and broader safety governance reforms were associated with sustained improvements in railway safety performance. This study highlights the need for stronger data integration, institutional learning, and safety management implementation. Future research should concentrate on modeling the impacts of safety policies concerning operational exposure variables, including train-kilometers, service frequency, infrastructure maintenance, and environmental factors. Other research can be directed at implementing railway safety management systems (SMS) at the operator level.
fatal accident, interrupted time series analysis, policy impact, railway safety, trends
Railway safety is a fundamental pillar in achieving a sustainable transportation system, particularly in developing countries characterized by high levels of operational complexity [1-4]. Despite substantial improvements in infrastructure and technology, the risk of railway accidents in Indonesia remains relatively high [5]. Human factors have been consistently identified as the dominant contributors to accidents, especially to railway accidents [6-9], followed by deficiencies in safety management systems (SMS) [10]. These conditions highlight the critical need for integrated public safety policies aimed at systematically reducing accident risks and improving overall railway safety performance [11-13].
In many developed countries, railway safety policies are commonly classified into two main categories: general policies, which encompass legal frameworks and national SMS, and specific policies, which regulate technical aspects such as signaling systems, rolling stock certification, and level crossing protection [14]. The implementation of SMS has been shown to reduce fatal railway accidents significantly [15-19]. This policy-oriented approach emphasizes systematic intervention through regulatory frameworks, technological integration, and the promotion of a safety culture.
The Government of Indonesia has aligned its safety development agenda with the Railway Law [20]. This law serves as the foundation for reforms in national railway governance and safety. Since its enactment, various implementing regulations have been issued to strengthen the safety system, including regulations on railway operations [21], transportation accident investigation [22], automatic train protection systems [23], railway safety standards [24], railway SMS [25], and railway safety assessment mechanisms [26]. In addition, the government has issued a national railway master plan policy as a reference for developing long-term national railway development and construction programs, particularly with respect to safety aspects [27]. However, the effectiveness of these policies in influencing long-term accident trends has not yet been empirically evaluated.
Railway safety research in Indonesia has largely focused on technical and behavioral factors, such as infrastructure maintenance [28], operations [8, 29], integration [30, 31], demand prediction [32], human factors [7-9], risk-taking behavior at level crossings [9], as well as policy development for urban rail services in Indonesia [32-34]. International studies have also highlighted the effectiveness and efficiency of signaling policies [35-37], privatization [38], maintenance strategies [39], safety management practices [40-42], leadership and safety training [43], and risk assessment approaches [44-50]. However, most of these studies are cross-sectional and concentrate on technical or managerial aspects without linking policy dynamics to long-term accident data. Consequently, an important research gap remains: there has been no empirical longitudinal study measuring the effects of safety policies on railway accident trends in Indonesia.
This study aims to analyze the impact of railway safety policies on accident trends in Indonesia over the period 2007–2024 using interrupted time series analysis (ITSA). This approach makes it possible to measure changes in trends before and after policy implementation. The study contributes to strengthening quantitative evidence on the effectiveness of safety policies based on longitudinal data in the transportation sector. Practically, the findings can serve as a basis for evaluating and improving railway safety management policies in Indonesia in support of a sustainable transportation system.
2.1 Data collection
This study uses data on the annual number of fatal railway accidents and victims in Indonesia obtained from official investigation reports published by the National Transportation Safety Committee (NTSC) over the period 2007–2024 [51]. The unit of analysis is the annual count of fatal railway accidents, observed longitudinally to capture temporal dynamics and structural changes in accident trends over time. The use of a longitudinal design enables the examination of both pre and post-intervention trajectories, allowing for robust evaluation of policy impacts within a quasi-experimental framework.
The study period 2007–2024 was deliberately selected to ensure sufficient temporal coverage for evaluating long-term trends and policy impacts on fatal railway accidents in Indonesia. This period captures multiple phases of railway safety governance, including the pre-intervention baseline, the implementation of major national safety policies, and the post-intervention adjustment phase. The availability of consistent and systematically documented accident investigation reports from the NTSC since 2007 further supports the reliability of this temporal window.
A longitudinal design was employed to observe the evolution of fatal railway accidents over time, allowing for the identification of underlying trends, structural breaks, and dynamic responses to policy interventions. Unlike cross-sectional approaches, longitudinal data enable the assessment of within-system changes, which is essential for causal inference in policy evaluation studies. This design is particularly suitable for ITSA, as it provides the necessary pre- and post-intervention observations to distinguish policy-related effects from secular trends.
2.2 Interrupted time series analysis
Time-series analysis is used to understand the dynamics of accident counts over the study period. It is a technique used to describe, explain, predict, and control changes in variables over time [52]. Periodic observation of variables aims to identify data movement patterns, such as horizontal, trend, seasonal, and cyclical patterns, across specific time intervals, including daily, weekly, monthly, or annual observations [53].
This study employed OLS-based segmented ITSA to evaluate whether railway safety policy was associated with structural changes in accident trends over time [54, 55]. This method was selected because it allows comparison of pre- and post-intervention patterns by estimating the pre-intervention trend, the immediate level change after the intervention, and the post-intervention slope change. Although accident data are count outcomes and can be modeled using Poisson or negative binomial regression, the primary objective of this study was not to develop a count prediction model, but to evaluate changes in level and slope associated with the policy intervention. Thus, ITSA enables the analysis to distinguish accident reductions that had already occurred before the policy from trend changes that emerged after policy implementation.
The ITSA model used in this study is expressed in Eq. (1) as follows:
${{Y}_{t}}={{\beta }_{0}}+{{\beta }_{1}}.T+{{\beta }_{2}}.{{X}_{t}}+{{\beta }_{3}}.X{{T}_{t}}$ (1)
The dependent variables ${{Y}_{t}}$ consist of the number of fatal train accidents, the equivalent number of accident victims, and the ratio of the equivalent number of accidents divided by the total number of train accidents. The independent variable is observed at time t, where t is measured in years during the study period. This variable captures the longitudinal evolution of accident outcomes and serves as the primary indicator of railway safety performance.
The parameter ${{\beta }_{0}}$ denotes the baseline level at the beginning of the observation period ($T~$= 0), ${{\beta }_{1}}$ represents pre-intervention trend, ${{\beta }_{2}}$ captures the immediate level change associated with the policy intervention, and ${{\beta}_{3}}$ represents the change in trend during the post-intervention period. Therefore, the post-intervention trend is interpreted as ${{\beta }_{1}}+{{\beta }_{3}}$. This interpretation follows the standard ITSA specification in which policy effects are evaluated through both level and slope changes rather than through a simple before-and-after comparison.
Time is denoted by $T$, which measures the number of years elapsed since the start of the study period, providing a continuous temporal scale for trend estimation. The variable ${{X}_{t}}$ is a binary dummy indicating the timing of the policy intervention, coded as 0 for all periods before the intervention and 1 for periods after the intervention. To capture the duration of exposure to the policy, the variable $X{{T}_{t}}$ is defined as a post-intervention time index, taking sequential values (1, 2, 3, …) for each year following the intervention. This specification enables the estimation of both immediate and gradual policy effects within a unified regression framework. Policy effects are considered statistically significant when the p-value is <0.05; conversely, when the p-value is >0.05, the policy effect is not statistically significant.
This study adopts a trend-pattern approach to examine whether accident counts tend to increase or decrease following policy interventions. The data exhibit a long-term trend without a strong seasonal pattern; therefore, a linear model is used to analyze the tendency of year-to-year changes in accident counts. The primary focus of the analysis is not forecasting but identifying shifts in patterns attributable to policy interventions. The interpretation of coefficient signs depends on the parameter being examined. A negative ${{\beta }_{1}}$ indicates a declining pre-intervention trend, while ${{\beta }_{2}}$ reflects the immediate level change at the time of intervention. The coefficient β₃ indicates whether the slope becomes steeper or flatter after the intervention. Accordingly, the post-intervention slope is assessed using ${{\beta }_{1}}+{{\beta }_{3}}$. Sensitivity analysis is used to see the significance of the impact on the timing of policy implementation [56]. Sensitivity analysis takes into account a 1-year (in 2014) delay in policy implementation due to institutional adaptation, resource limitations, and technical factors in the field [57, 58].
Regarding the number of accident victims, the Center for Research and Development established the Equivalent Accident Number (EAN) to accommodate variations in the severity of accident casualties [59]. EAN is calculated based on severity using the formula:
$EAN=\left( 12\times DD \right)+\left( 6\times LB \right)+\left( 3\times LR \right)$ (2)
where, DD represents fatalities, LB represents serious injuries, and LR represents minor injuries. The data available from the NTSC includes fatalities and injuries, so minor injuries are considered equivalent to serious injuries. Details of the number of accidents are shown in Table 1.
Table 1. The Equivalent Accident Number (EAN) is based on the severity of the victim [51]
|
Year |
Number of Accidents |
Number of Victims |
EAN |
Ratio |
|
|
Fatalities |
Injuries |
||||
|
a |
b |
c |
d |
e = (12c) + (6d) |
f = e/b |
|
2007 |
13 |
9 |
185 |
1218 |
14,92 |
|
2008 |
8 |
7 |
36 |
300 |
5,38 |
|
2009 |
8 |
6 |
139 |
906 |
18,13 |
|
2010 |
10 |
42 |
125 |
1254 |
16,70 |
|
2011 |
1 |
5 |
35 |
270 |
40,00 |
|
2012 |
3 |
4 |
42 |
300 |
15,33 |
|
2013 |
2 |
0 |
0 |
0 |
0,00 |
|
2014 |
6 |
0 |
13 |
78 |
2,17 |
|
2015 |
6 |
3 |
47 |
318 |
8,33 |
|
2016 |
6 |
0 |
1 |
6 |
0,17 |
|
2017 |
7 |
1 |
0 |
12 |
0,14 |
|
2018 |
11 |
1 |
1 |
18 |
1,64 |
|
2019 |
7 |
0 |
0 |
0 |
0,00 |
|
2020 |
2 |
0 |
0 |
0 |
0,00 |
|
2021 |
5 |
0 |
1 |
6 |
0,20 |
|
2022 |
4 |
2 |
8 |
72 |
2,50 |
|
2023 |
4 |
0 |
32 |
192 |
8,00 |
|
2024 |
2 |
4 |
37 |
270 |
20,50 |
2.4 Statistical analysis and model validation
Before the modeling process, statistical analysis is performed. Statistical analysis aims to understand data characteristics, detect errors, and ensure baseline conditions. Statistical analysis is performed using the Augmented Dickey-Fuller (ADF) test to determine data stationarity [54-57]. Data is declared statistically significant if the p-value is <0.05. The test results determine the method to be used to ensure the resulting model is accurate, efficient, and unbiased. The next step is to create a model using the ITSA method and validate the model [60].
Model validation is a critical step to ensure the validity and reliability of inferences regarding policy impacts based on time series data. Validation plays an essential role in assessing whether observed trend patterns and intervention-related changes genuinely reflect system dynamics or are artifacts of model misspecification and residual autocorrelation. Autocorrelation in residuals can lead to biased variance estimates and misleading statistical significance tests [61]. Therefore, detecting residual autocorrelation is crucial in the evaluation of policy impacts using time series models. To assess the presence of residual autocorrelation across years, this study applies the Durbin-Watson (DW) test [62].
DW test is widely used to examine the assumption of residual independence in time series regression models, particularly in ITSA-based evaluations of long-term policy interventions. Specifically, the test detects first-order autocorrelation, defined as a linear correlation between the error term at time t and the error term at time t−1. DW statistic ranges from 0 to 4, with interpretation as follows:
where, ${{d}_{L}}$ represents the lower critical value, and ${{d}_{U}}$ represents the upper critical value used as a decision threshold in the test.
The runs test is a reliable alternative for detecting the presence of autocorrelation in model residuals. Its application is particularly useful when conventional diagnostic procedures, such as the DW test, yield inconclusive results. A key advantage of the runs test is its nonparametric nature, which eliminates the requirement for the residuals to satisfy the assumption of normality. When the residuals generated by a regression model are randomly distributed and exhibit no systematic dependence between successive observations, the model can be considered free from autocorrelation bias. The test decision is based on the Asymp. Sig. value (2-tailed), with a significance level of 0.05. An Asymp. Sig. value greater than 0.05 indicates that the residuals are randomly distributed and there is no significant autocorrelation.
3.1 Accident characteristics
Figure 1 shows that the total number of train accidents resulting in death in Indonesia from 2007 to 2024 was 105 accidents. The highest number of fatal accidents occurred in 2007, with 13 accidents, followed by a substantial decline to one fatal accident in 2011. However, the number of accidents increased again in 2018, reaching 11 fatal accidents. In the most recent years, four fatal accidents were recorded in 2023, decreasing further to two fatal accidents in 2024.
Figure 1. Number of accidents and types of railway accidents based on the National Transportation Safety Committee (NTSC) investigations, period 2007–2024 [51]
Figure 2 shows the distribution of accident types. Derailments account for the majority of fatal railway accidents (64.13%), followed by collisions (25.00%). Other accident types account for 8.69%, including locomotive failures, signaling failures, broken rails, and operational disturbances. The remaining 2.00% of fatal accidents are attributed to train fires. The highest number of fatalities occurred in 2010, with 42 deaths, while the highest number of injured victims was recorded in 2007, totaling 185 injuries. This pattern indicates that although the frequency of railway accidents has declined, the fatality and injury ratios per accident tend to increase, suggesting a rise in accident severity over time.
Figure 2. Number of victim railway fatality accidents, period 2007–2024 [51]
3.2 Policy impact analysis on railway accidents
The Government of the Republic of Indonesia established a safety committee to investigate aircraft accidents through the Decree of the Minister of Transportation No. KP. 3/LT.403/Phb-94 dated July 15, 1994. In 1997, a commission to investigate the causes of aircraft accidents was established through the Minister of Transportation Decree No. 2/HK.601/PHB-97 for the 1997-1999 period. Subsequently, in 1999, the National Transportation Accident Commission was established, and in 2012, its position, duties, and organizational structure were strengthened. Finally, in 2013, an accident investigation policy was implemented covering all modes of transportation and strengthened with a 2022 regulation to ensure that funding and bureaucratic processes do not hinder independent results from transportation safety. The history of the founding of the NTSC is presented in Figure 3.
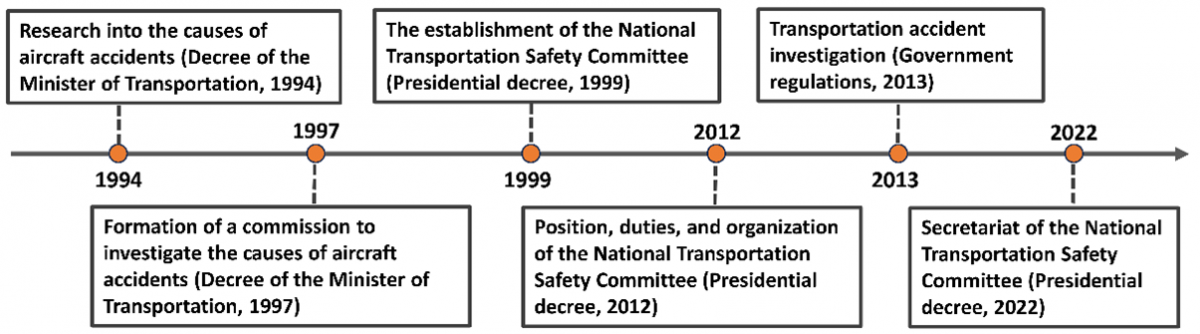
Figure 3. History of the National Transportation Safety Committee (NTSC)
Figure 4 illustrates the policy interruption point, which represents a universal intervention influencing railway safety outcomes. Before 2013, the Indonesian railway regulatory framework was primarily characterised by normative and administrative provisions aimed at establishing the legal, institutional, and operational foundations of the railway sector. Key regulations, including Law No. 23 of 2007 on Railways, Government Regulation No. 56 of 2009 concerning Railway Administration, and the National Railway Master Plan (RIPNAS) under Ministerial Regulation No. 43 of 2011, mainly focused on infrastructure development, operational governance, licensing arrangements, and sectoral planning. Although these regulations contained safety-related provisions, their primary orientation was directed towards system establishment and regulatory compliance rather than systematic accident learning and safety feedback mechanisms. Consequently, accident investigation had not yet been formally positioned as a core instrument for safety governance or continuous policy improvement within the railway system.
Figure 4. Time intervention of railway safety policies and the number of fatal railway accidents in Indonesia (2007–2024)
Therefore, the enactment of Government Regulation No. 62 of 2013 represents a qualitatively different policy intervention. Unlike previous regulations, which primarily established technical, operational, and institutional requirements, Government Regulation No. 62/2013 institutionalized independent accident investigations as a formal mechanism for organizational learning, policy adaptation, and safety improvement across various transportation modes. Post-2013, however, the policy has become more operational and technical in nature, focusing on improving safety through technical safety standards, SMS, and safety assessments.
The analytical considerations underlying this policy intervention encompass regulatory, theoretical, empirical, and methodological dimensions. This policy serves as a critical instrument within the national safety policy chain, reinforcing transportation safety governance, particularly within the railway sector. From a regulatory perspective, this policy is a direct derivative of the law as the legal basis for railway administration [21].
From a regulatory perspective, this policy is a direct derivative of the law as the legal basis for railway administration [21]. Accident investigations operate through systemic, objective, independent mechanisms and are grounded in organizational learning through the involvement of NTSC. The “learning from accidents” approach emphasizes root-cause analysis to generate corrective recommendations for policies, operational procedures, and safety-system design [16]. In general, this policy strengthens transportation safety governance, clarifies accident investigation processes, enhances public transparency, and improves inter-agency integration in building a continuous learning system from every accident.
From a theoretical perspective, the policy is categorized as a reactive-regulatory measure intended to prevent the recurrence of similar accidents in the future. It aligns with the SMS framework implemented in the transport systems of developed countries such as the United Kingdom, Australia/New Zealand, and Canada [63-66]. This modern safety paradigm emphasizes the Plan-Do-Check-Act (PDCA) cycle as a continuous process for identifying, managing, and evaluating accident risks at both system and organizational levels [62, 63, 67, 68].
Empirically, the policy was issued at a time when the national investigation system remained sectoral and not yet integrated. The regulation strengthened the institution’s role as an independent body responsible for factual, technical, and organizational investigations, particularly for railway accidents. Its implementation improved the transparency of accident reporting, enhanced investigation outcomes, supported operational policy improvements and safety culture development, and reduced systemic risks in the public transport sector [69].
From a methodological perspective, selecting 2013 as the intervention point meets the criteria for a structural change in national transportation safety policy. The policy is cross-modal in scope and provides recommendations for railway operators covering both rolling stock and infrastructure. Accordingly, the ITSA applied in this study can identify both immediate-level changes and long-term slope changes, reflecting the effectiveness of railway safety policies in Indonesia. This approach represents an administrative policy and a systemic transition point in the evolution of national transportation safety governance.
Figure 4 presents the progression of major railway safety-related policies from 2007 to 2024, illustrating continuous reforms involving structural policies such as strengthened technical standards, enhanced operational requirements, and gradual safety governance reforms. In contrast, the transportation accident investigation policy represents a corrective intervention with a specific focus on fatal accidents.
In accordance with the procedure, the data were tested using the ADF test. The data included the number of accidents (Model 1), the number of victims-the EAN (Model 2), and the ratio of the number of victims to the accident number (Model 3). The ADF test results for the number of accidents were 0.957 (p = 0.5426), the number of victims was −0.789 (p = 0.9509), and the ratio (the number of accident victims divided by the number of accidents) was −1.5755 (p = 0.7341). These results indicate that all three data sets are non-stationary (p > 0.05), indicating that the data exhibit inconsistent characteristics over time. Based on the research objectives, an analysis was conducted to examine the relationship between policy and the changing trends of these three variables. Furthermore, the ITSA model was fitted to each variable, and a sensitivity analysis was conducted based on the policy's implementation in 2013 and 2014. ITSA modeling data are shown in Table 2.
Based on the data in Table 2, regression analysis was conducted to examine the effects before and after the policy intervention. The results of the regression model analysis are presented in Table 3. The following describes the analysis of the results of each model.
Table 2. Interrupted time series analysis (ITSA) variable data
|
Year |
Model 1 ${{Y}_{1}}$ |
Model 2 ${{Y}_{2}}$ |
Model 3 ${{Y}_{3}}$ |
Time $X$ |
Time Policy Intervention (2013) |
Time Policy Intervention (2014) |
||
|
Treatment ${{X}_{t}}$ |
Post $X{{T}_{t}}$ |
Treatment ${{X}_{t}}$ |
Post $X{{T}_{t}}$ |
|||||
|
2007 |
13 |
1218 |
14,92 |
1 |
0 |
0 |
0 |
0 |
|
2008 |
8 |
300 |
5,38 |
2 |
0 |
0 |
0 |
0 |
|
2009 |
8 |
906 |
18,13 |
3 |
0 |
0 |
0 |
0 |
|
2010 |
10 |
1254 |
16,70 |
4 |
0 |
0 |
0 |
0 |
|
2011 |
1 |
270 |
40,00 |
5 |
0 |
0 |
0 |
0 |
|
2012 |
3 |
300 |
15,33 |
6 |
0 |
0 |
0 |
0 |
|
2013 |
2 |
0 |
0,00 |
7 |
1 |
1 |
0 |
0 |
|
2014 |
6 |
78 |
2,17 |
8 |
1 |
2 |
1 |
1 |
|
2015 |
6 |
318 |
8,33 |
9 |
1 |
3 |
1 |
2 |
|
2016 |
6 |
6 |
0,17 |
10 |
1 |
4 |
1 |
3 |
|
2017 |
7 |
12 |
0,14 |
11 |
1 |
5 |
1 |
4 |
|
2018 |
11 |
18 |
1,64 |
12 |
1 |
6 |
1 |
5 |
|
2019 |
7 |
0 |
0,00 |
13 |
1 |
7 |
1 |
6 |
|
2020 |
2 |
0 |
0,00 |
14 |
1 |
8 |
1 |
7 |
|
2021 |
5 |
6 |
0,20 |
15 |
1 |
9 |
1 |
8 |
|
2022 |
4 |
72 |
2,50 |
16 |
1 |
10 |
1 |
9 |
|
2023 |
4 |
192 |
8,00 |
17 |
1 |
11 |
1 |
10 |
|
2024 |
2 |
270 |
20,50 |
18 |
1 |
12 |
1 |
11 |
Table 3. Results of interrupted time series analysis (ITSA) of the policy intervention model
|
Variable |
Time Policy Intervention (2013) |
Time Policy Intervention (2014) |
||||||||||
|
Value |
p-value |
Value |
p-value |
|||||||||
|
M1 |
M2 |
M3 |
M1 |
M2 |
M3 |
M1 |
M2 |
M3 |
M1 |
M2 |
M3 |
|
|
Coefficient |
|
|
|
|
|
|
|
|
|
|
|
|
|
Constant (${{\beta }_{0}})$ |
14.067 |
1141.200 |
49.188 |
<0.001 |
<0.001 |
0.315* |
13.571 |
1219.714 |
105.596 |
<0.001 |
<0.001 |
0.070* |
|
Time (${{\beta }_{1}})$ |
−1,971 |
−123.771 |
21.177 |
0.008 |
0.072* |
0.103* |
−1.786 |
−153.214 |
0.024 |
0.001 |
0.010 |
0.998* |
|
Treatment (${{\beta }_{2}})$ |
4.201 |
−368.026 |
−188.746 |
0.122* |
0.167* |
0.002 |
6.947 |
−92.887 |
−115.804 |
0.007 |
0.721* |
0.073* |
|
Post (${{\beta }_{3}})$ |
1.776 |
131.534 |
−15.760 |
0.021 |
0.071* |
0.240* |
1.358 |
158.887 |
5.779 |
0.016 |
0.015 |
0.675* |
|
Model Fit Summary |
|
|
|
|
|
|
|
|
|
|
|
|
|
R² |
0.470 |
0.651 |
0.593 |
|
|
|
0.595 |
0.638 |
0.358 |
|
|
|
|
Adjusted R² |
0.356 |
0.577 |
0.506 |
|
|
|
0.509 |
0.560 |
0.221 |
|
|
|
|
F Change |
4.135 |
8.722 |
6.806 |
0.027 |
0.002 |
0.005 |
6.868 |
8.222 |
2.604 |
0.004 |
0.002 |
0.093 |
|
Durbin-Watson (DW) |
2.054 |
2.361* |
2.218 |
|
|
|
2.226 |
2.300 |
1.689* |
|
|
|
|
Run Test (Asimp. Sig. (2-tailed) |
1.000 |
0.224 |
0.808 |
|
|
|
0.466 |
0.808 |
0.089 |
|
|
|
Note: *Not Supported (p > 0.05), ${{M}_{1}}$ = Model 1 (Number of accidents); ${{M}_{2}}$ = Model 2 (Number of victims); ${{M}_{3}}$ = Model 3 (Accident-to-Casualty Ratio).
1. Model 1 (Number of accidents)
The model summary indicates that the regression models fit well in explaining variation in railway accident counts based on the national policy intervention. For the 2013 intervention model, the coefficient of determination (R²) is 0.470, and the adjusted R² is 0.356, indicating that approximately 35.6% of the variation in accident counts is explained by the model. The F Change value of 4.135 indicates that the overall model is statistically significant, meaning the observed changes in accident trends can be considered statistically meaningful. For the 2014 intervention model, R² is 0.595 and adjusted R² is 0.509, indicating that approximately 50.9% of the variation in accident counts is explained by the model. The F-change value of 6.868 indicates that the inclusion of post-intervention parameters significantly improves model fit in explaining changes in the accident trend (p < 0.05).
In addition, the DW autocorrelation test results (2.054 for 2013 and 2.262 for 2014) fall within the required range of 1.6961 < d < 2.3039. These DW values indicate no residual autocorrelation in either model, meaning the models satisfy the assumption of independence, thereby strengthening model validity. The run test results for Model 1 (2013 and 2014) yielded Asymp. Sig. (2-tailed) values greater than 0.05. These findings indicate that the estimated model does not exhibit significant autocorrelation and satisfies the independence assumption.
The estimated ITSA regression model shows that the railway safety policy intervention has a statistically significant relationship to changes in accident trends after the implementation period. The intercept coefficient ${{\beta }_{0}}$ is 14.067 (p = <0.001) for the 2013 model and 13.751 (p = <0.001) for the 2014 model. These ${{\beta }_{0}}$ values are relatively close to the accident count at the start of the series in 2007. Meanwhile, the pre-intervention time trend coefficient (${{\beta }_{1}}$ = −1.971 for the 2013 model; ${{\beta }_{1}}$ = −1.786 for the 2014 model) indicates a significant (p < 0.05) long-term decline in accident counts over 2007–2024.
The ${{\beta }_{2}}$ coefficient captures the immediate effect during the initial period of policy implementation. In the 2013 intervention model, this effect was not statistically significant (${{\beta }_{2}}$ = 4.201, p = 0.122), but became significant in the 2014 intervention model (${{\beta }_{2}}$ = 6.947, p = 0.007). This indicates that the policy's impact became statistically observable in 2014. A positive ${{\beta }_{2}}$ coefficient value indicates an increase in the initial period of policy implementation. This condition is interpreted as an institutional adjustment phase that involves operational readiness and oversight, thereby enabling the policy to be implemented more effectively. The post-policy interaction coefficient (${{\beta }_{3}}$) indicates a change in the direction of the accident trend after the policy was introduced, with ${{\beta }_{3}}$ = 1.776 (p = 0.021) for the 2013 model and ${{\beta }_{3}}$ = 1.358 (p = 0.016) for the 2014 model. Although the ${{\beta }_{3}}$ coefficient value is still positive (indicating an increase), when compared with ${{\beta }_{2}}$, it can be interpreted as a slowdown in the rate of accident reduction.
2. Model 2 (Number of victims)
The model summary shows that the regression model performs well in explaining the variation in the number of train accident victims based on national policy interventions. For the 2013 intervention model, the coefficient of determination (R²) is 0.651, and the adjusted R² is 0.577, indicating that approximately 57.7% of the variation in the number of train accident victims is explained by the model. The F-Change value of 8.722 indicates that the model as a whole is statistically significant, meaning that the observed change in the number of train accident victims can be considered statistically significant. The R² value for 2014 is 0.638, and the adjusted R² is 0.560, indicating that approximately 56.0% of the variation in the number of train accident victims can be explained by the model. The overall regression model remained statistically significant (F = 8.222, p = 0.002), indicating that the segmented regression specification adequately explains variation in railway accident casualties following the policy intervention.
Furthermore, the DW autocorrelation test results for 2013 (DW = 2.361) were outside the required range, namely 1.6961 < d < 2.3039, except for 2014 (DW = 2.300). This DW value indicates the presence of residual autocorrelation in the model, thus failing to meet the independence assumption and weakening the model's validity. Furthermore, the run test results for 2013 (0.224) and 2014 (0.808) yielded Asymp. Sig. (2-tailed) values greater than 0.05. These results indicate that the estimated model does not exhibit significant autocorrelation and satisfies the assumption of independence.
The estimated ITSA regression models show that railway safety policy interventions have a statistically significant relationship with changes in accident trends after the implementation period. The intercept coefficient (β₀) is 1141.200 (p < 0.001) for the 2013 model and 1219.714 (p < 0.001) for the 2014 model. This ${{\beta }_{0}}$ value is slightly lower than at the beginning of the series in 2007. Meanwhile, the pre-intervention time trend coefficient ${{\beta }_{1}}$ = −123.771 (p = 0.072) for the 2013 model and ${{\beta }_{1}}$ = −153.214 (p = 0.010) for the 2014 model indicates a significant long-term decrease (p < 0.05) in the number of casualties during the period 2007–2024, except for the 2013 model.
The ${{\beta }_{2}}$ coefficient captures the immediate effect during the initial period of policy implementation. The ${{\beta }_{2}}$ values for the 2013 and 2014 models were −368.026 (p = 0.167) and −92.887 (p = 0.721), respectively. This indicates a statistically insignificant relationship for both, despite the negative ${{\beta }_{2}}$ sign. The post-policy interaction coefficient (${{\beta }_{3}}$) indicates a change in the direction of the number of victim trend after the policy was introduced, with ${{\beta }_{3}}$ = 131.534 (p = 0.071) for the 2013 model and ${{\beta }_{3}}$ = −158.887 (p = 0.015) for the 2014 model.
Overall, the two intervention models provide complementary evidence that the policy was associated with a gradual transition in railway safety outcomes rather than an immediate structural change. The absence of a statistically significant immediate level change suggests that improvements in casualty outcomes were not realised instantaneously following policy enactment. Instead, the significant post-intervention trend observed in the one-year lagged intervention model supports the interpretation that policy effects accumulated progressively as institutional reforms, accident investigation practices, and SMS became operational. The consistency of the direction of change across both models reinforces the robustness of the findings while recognising that policy implementation requires time before measurable safety benefits become evident.
3. Model 3 (Accident-to-Casualty Ratio)
The model summary indicates that the regression models fit well in explaining variation in railway accident counts based on the national policy intervention. For the 2013 model, the coefficient of determination (R²) is 0.593, and the adjusted R² is 0.506, indicating that approximately 50.6% of the variation in accident counts is explained by the model. The F Change value of 6.806 (p = 0.005) indicates that the overall model is statistically significant, meaning the observed changes in accident trends can be considered statistically meaningful. For the 2014 model, R² is 0.358 and adjusted R² is 0.221, indicating that approximately 22.1% of the variation in accident counts is explained by the model. The F-change value of 2.604 indicates that the post-intervention parameters jointly contribute to explaining variation in accident outcomes, with the model being statistically significant (p < 0.05).
In addition, the results of the DW autocorrelation test for 2013 (DW = 2.218) were within the required range, namely 1.6961 < d < 2.3039, except for 2014 (DW = 1.689). These DW values indicate no residual autocorrelation in either model, meaning the models satisfy the assumption of independence, thereby strengthening model validity. The run test results for Model 1 (2013 and 2014) yielded Asymp. Sig. (2-tailed) values greater than 0.05. These findings indicate that the estimated model does not exhibit significant autocorrelation and satisfies the independence assumption.
The estimated ITSA regression models show that railway safety policy interventions have a statistically significant relationship with changes in accident trends after the implementation period. The intercept coefficient ${{\beta }_{0}}$ is 49.188 (p = 0.315) for the 2013 model and 105.596 (p = 0.070) for the 2014 model. This ${{\beta }_{0}}$ value varies compared to the beginning of the data series in 2007. Meanwhile, the pre-intervention time trend coefficient ${{\beta }_{1}}$ = 21.177 (p = 0.103) for the 2013 model; ${{\beta }_{1}}$ = 0.024 (p = 0.998) for the 2014 model, indicates a non-significant long-term decrease (p > 0.05) in the number of casualties during the period 2007–2024.
The ${{\beta }_{2}}$ coefficient captures the immediate effect during the initial period of policy implementation. The ${{\beta }_{2}}$ values for the 2013 and 2014 models are −188.746 (p = 0.002) and −115.804 (p = 0.073), respectively. This indicates a statistically significant relationship for 2013 but not for 2014. The post-policy interaction coefficient (${{\beta }_{3}}$) indicates a change in the direction of the number of victim trend after the policy was introduced, with ${{\beta }_{3}}$ = −15.760 (p = 0.240) for the 2013 model and ${{\beta }_{3}}$ = 5.779 (p = 0.675) for the 2014 model.
The findings indicate that although both the casualty ratio and the number of accidents declined during the initial stage of the observation period, the intervention was associated with a sustained improvement in railway safety performance over the longer term. Overall, the regression results suggest that the policy intervention was associated with a structural change in accident trends, although its observable effect was not necessarily immediate. The sensitivity analysis using the 2013 and 2014 intervention points was intended to account for a possible implementation lag between the formal introduction of the policy and its operational translation into safety practices. Therefore, the 2014 specification should be interpreted as a one-year lagged intervention model rather than as a separate policy event. Compared with the 2013 specification, the 2014 model provides a more empirically consistent lagged specification, suggesting that the effect of the intervention became more observable after a period of institutional adaptation, resource adjustment, and technical implementation in the field [57, 58].
In the 2014 model, the pre-intervention slope was negative (${{\beta }_{1}}$ = −1.786), indicating a declining accident trend before the intervention. The post-intervention slope was calculated as ${{\beta }_{1}}+{{\beta }_{3}}$ = −1.786 + 1.358 = −0.428. This indicates that accident counts continued to decline after the intervention, but at a slower rate. In relative terms, the post-intervention declining slope represented approximately 23.96% of the pre-intervention slope, calculated as (${{\beta }_{1}}+{{\beta }_{3}}$) / ${{\beta }_{1}}$ × 100. This suggests a weakening of the downward trend rather than an acceleration of accident reduction. Substantively, this pattern may reflect a gradual adjustment process within the railway safety system. The policy contributed to broader safety governance reforms through independent accident investigations, organizational learning, safety management implementation, and risk-based oversight.
The policy intervention appears to have more association with accident incidence than with accident consequences. Although there was a significant reduction in accident frequency after the intervention, changes in accident outcomes emerged gradually and were linked to long-term safety governance processes. These findings suggest that accident investigations can initially contribute to accident prevention, while reducing accident severity requires broader organizational learning, operational improvements, and the implementation of safety management.
This pattern aligns with the theory of policy learning and safety governance, which states that the benefits of independent accident investigations often emerge through organizational learning processes, revisions to safety standards, improvements to operational procedures, and strengthening of SMS through direct changes that can be observed immediately after policy implementation.
However, these results also indicate that reductions in accident numbers are not always accompanied by proportional reductions in accident severity. The number of fatalities resulting from accidents is influenced by a variety of additional factors, including collision characteristics, the number of passengers involved, the effectiveness of emergency responses, infrastructure conditions, and other operational factors. Therefore, while accident investigation policies contribute to improving overall safety governance, their impact on accident severity requires further evaluation using approaches that explicitly account for other dimensions, such as train-km, infrastructure maintenance, and environmental factors. These findings support the need for further research that integrates accident frequency and severity indicators to gain a more comprehensive understanding of the effectiveness of railway safety policies.
The literature indicates that efforts to improve railway safety have undergone a policy paradigm shift—from a technical, compliance-oriented approach toward a framework centered on systemic learning and risk management. Integrating accident investigation findings into the national safety planning process is a key instrument to ensure that recommendations are followed up through updates to technical standards, training curricula, and safety audit mechanisms [70]. Safety policies should be designed to connect investigation processes with continuous improvement cycles so that organizational learning can make a tangible contribution to risk mitigation at both the system and operator levels [71]. Oversight is also a critical factor in achieving a sustainable safety and security system.
In addition, policy implications underline the need to broaden the regulatory focus on human factors, including enhancing operator competence, fatigue management, professional certification, and strengthening safety culture [7]. The effectiveness of safety audits requires improvements through the use of quantitative performance indicators, increased capacity of independent auditors, and consistent implementation of sanctions and incentives to improve compliance [72]. Cross-sector harmonization is a key prerequisite to ensure that regulators, operators, relevant ministries, and investigation bodies work within a single, integrated national safety framework. Thus, sustained improvements in railway safety depend heavily on institutional consolidation and the ability of the regulatory system to synchronize technical, organizational, and human-factor dimensions simultaneously.
The ITSA results indicate that railway accident trends in Indonesia experienced a structural change associated with the implementation of railway safety policies. The findings suggest that the policy intervention was followed by a sustained improvement in railway safety performance, although the observable effect was not immediate. The 2014 specification, interpreted as a one-year lagged intervention model, provides a more empirically consistent explanation of the delayed translation of policy into operational safety practices.
The accident trend showed a negative pre-intervention slope ($\beta_1$= −1.786), indicating that accident counts had already been declining before the intervention. After the intervention, the post-intervention slope remained negative but became less steep ($\beta_1+\beta_3$= −0.428). This means that accident counts continued to decline, but at a slower rate. Therefore, the intervention should not be interpreted as directly accelerating accident reduction, but rather as being associated with a gradual safety governance process through institutional adaptation, resource adjustment, and technical implementation.
The findings also show that railway safety policies contributed to strengthening institutional roles, technical standards, safety management practices, and risk-based oversight. However, reductions in accident frequency were not always accompanied by proportional reductions in accident severity. Additional factors, including collision characteristics, passenger exposure, emergency response effectiveness, infrastructure condition, operational practices, and human factors may influence fatalities and casualty outcomes. Therefore, improving railway safety in Indonesia requires a holistic approach that integrates technical, organizational, institutional, and human dimensions.
This study has several limitations. The analysis was based on fatal railway accident data from the NTSC for the 2007–2024 period. Near-miss events and minor incidents were not included, which limits the ability to capture the broader spectrum of railway safety risk. In addition, the ITSA model did not explicitly incorporate exposure and operational variables such as train-kilometers, infrastructure investment, maintenance intensity, traffic volume, or environmental conditions. Another methodological limitation is that the ITSA model was estimated using OLS-based segmented regression, whereas the outcome variable represents annual accident counts. Although this approach is useful for estimating policy-related changes in level and slope, count data with a relatively small number of annual observations may not fully satisfy linear regression assumptions, particularly normality and homoscedasticity of residuals. Therefore, the findings should be interpreted as evidence of structural changes in accident trends rather than as a fully specified count-data prediction model. Nevertheless, the study demonstrates that ITSA is a useful longitudinal approach for evaluating policy-related changes in railway safety trends.
Future research should incorporate additional explanatory variables, such as train-kilometers, infrastructure maintenance, investment, operational exposure, and environmental factors, to provide a more comprehensive assessment of railway safety policy effectiveness. With longer time series or higher-frequency data, future studies should also consider count-based extensions of segmented regression, such as Poisson or negative binomial interrupted time series models, to better account for the distributional characteristics of accident count data. Further validation can also be strengthened through qualitative studies involving regulators, operators, investigators, and frontline railway personnel. Comparative studies with other developing and developed countries may also provide useful insights into how railway safety governance evolves across different institutional and technological contexts. Finally, future research may develop a railway safety performance index to help regulators and operators periodically monitor policy effectiveness and safety outcomes.
The research presented in this article is supported by Indonesian Education Scholarship, Center for Higher Education Funding and Assessment, and Indonesian Endowment Fund for Education.
|
${{Y}_{t}}$ |
number of railway accidents at time (year) t |
|
${{\beta }_{0}}$ |
baseline level of railway accidents before intervention T = 0 |
|
${{\beta }_{1}}$ |
changes in intervention outcomes over time |
|
${{\beta }_{2}}$ |
condition before intervention |
|
${{\beta }_{3}}$ |
condition after intervention (using the relationship between time and intervention) |
|
$T$ |
time (in years) elapsed since the start of the study period |
|
${{X}_{t}}$ |
dummy variable for policy intervention time, before (code: 0) and after (code: 1) |
|
$X{{T}_{t}}$ |
dummy variable time after policy intervention (code: 1, 2, 3, etc.) |
|
EAN |
Equivalent Accident Number |
|
DD |
Fatality |
|
LB |
Severe injury |
|
LR |
Minor injury |
|
DW |
Durbin–Watson Value |
|
${{d}_{L}}$ |
Lower critical value of Durbin-Watson |
|
${{d}_{U}}$ |
Upper critical value of Durbin-Watson |
[1] Kravchenko, O.H., Bohomolova, N. (2019). Determinants of railway transport sustainability. SHS Web of Conferences, 67: 04008. https://doi.org/10.1051/shsconf/20196704008
[2] Stasiak-Betlejewska, R., Török, Á. (2019). Creating safe and competitive conditions for the provision of rail transport services. System Safety: Human - Technical Facility - Environment, 1(1): 653-660. https://doi.org/10.2478/czoto-2019-0083
[3] Strelko, O.H., Muzykin, M.I., Nesterenko, H.I., Bibik, S.I., Soloviova, O.S. (2024). Strategic approach to sustainable development of railway transport and optimizing the use of empty cars in organizing transportation of dangerous goods. IOP Conference Series: Earth and Environmental Science, 1415(1): 012034. https://doi.org/10.1088/1755-1315/1415/1/012034
[4] Wangai, A.W., Rohacs, D., Boros, A. (2020). Supporting the sustainable development of railway transport in developing countries. Sustainability (Switzerland), 12(9): 3572. https://doi.org/10.3390/su12093572
[5] Shahrir, A.H., Manan, M.M.A. (2022). Assessment of railway safety in Southeast Asia region. The Journal of The Institution of Engineers, Malaysia, 82(2): 1-9. https://doi.org/10.54552/v82i2.88
[6] Aouragh, L., Ouazraoui, N., Boubaker, L., Bourmada, N., Sekhri, A. (2025). Integrating human performance factors to improve occupational risk assessment. International Journal of Safety and Security Engineering, 15(3): 609-619. https://doi.org/10.18280/ijsse.150319
[7] Auliani, S., Puspasari, M.A., Mahachandra, M., Susilo, Y.O., Iridiastadi, H. (2024). Fatigue among Indonesian freight-train drivers: A study utilizing eye blink duration and changes in facial expressions. Transportation Research Interdisciplinary Perspectives, 24: 101056. https://doi.org/10.1016/j.trip.2024.101056
[8] Brata, A.A., Arifin, J., Kania, D.D., Ricardianto, P., Parakhnenko, I.L. (2023). Analysis of railway operational safety (case study of Manggarai Station, Jakarta). AIP Conference Proceedings, 2624(1): 040093. https://doi.org/10.1063/5.0132699
[9] Restuputri, D.P., Febriansyah, A.M., Masudin, I. (2022). Risk behavior analysis in Indonesian logistic train level crossing. Logistics, 6(2): 1-16. https://doi.org/10.3390/logistics6020030
[10] Yuantoko, T.D., Djunaidi, Z., Wirawan, M. (2024). A socio-technical systems approach of the accident analysis in Indonesian multiple train accident cases: An application of AcciMap methodology. Journal of Emergency Management, 22(2): 155-167. https://doi.org/10.5055/jem.0830
[11] Berawi, M.A., Miraj, P. (2023). Rail liberalization for Indonesian railways: Learn from the experience of Germany and France. Transportation Research Interdisciplinary Perspectives, 22: 100916. https://doi.org/10.1016/j.trip.2023.100916
[12] Gleser, M., Elbert, R. (2024). Combined rail-road transport in Europe - A practice-oriented research agenda. Research in Transportation Business and Management, 53: 101101. https://doi.org/10.1016/j.rtbm.2024.101101
[13] Hong, W.-T., Clifton, G., Nelson, J.D. (2024). A data-driven conceptual framework for understanding the nature of hazards in railway accidents. Transport Policy, 152: 102-117. https://doi.org/10.1016/j.tranpol.2024.05.007
[14] Hendra, F., Mohammad, R., Amrin, A., Maarop, N., Zagloel, T.Y. (2024). Systematic literature review of risk assessment techniques, standard and guidelines for railway. International Journal of Technology, 15(4): 1148-1161. https://doi.org/10.14716/ijtech.v15i4.6384
[15] Evans, A.W. (2007). Rail safety and rail privatisation in Britain. Accident Analysis and Prevention, 39(3): 510-523. https://doi.org/10.1016/j.aap.2006.09.007
[16] Evans, A.W. (2011). Fatal accidents at railway level crossings in Great Britain 1946-2009. Accident Analysis and Prevention, 43(5): 1837-1845. https://doi.org/10.1016/j.aap.2011.04.019
[17] Evans, A.W. (2011). Fatal train accidents on Europe’s railways: 1980-2009. Accident Analysis and Prevention, 43(1): 391-401. https://doi.org/10.1016/j.aap.2010.09.009
[18] Evans, A.W. (2013). The economics of railway safety. Research in Transportation Economics, 43(1): 137-147. https://doi.org/10.1016/j.retrec.2012.12.003
[19] Zuschlag, M., Ranney, J.M., Coplen, M. (2016). Evaluation of a safety culture intervention for Union Pacific shows improved safety and safety culture. Safety Science, 83: 59-73. https://doi.org/10.1016/j.ssci.2015.10.001
[20] Government of the Republic of Indonesia. (2007). Law Number 23 of 2007 concerning Railways. Jakarta, Indonesia. https://peraturan.bpk.go.id/Details/39896. Accessed August 11, 2025.
[21] Government of the Republic of Indonesia. (2009). Government Regulation of the Republic of Indonesia Number 56 of 2009 concerning Railway Management. Jakarta, Indonesia. https://peraturan.bpk.go.id/Details/4982/pp-no-56-tahun-2009. Accessed August 11, 2025.
[22] Government of the Republic of Indonesia. (2013). Government Regulation of the Republic of Indonesia Number 62 of 2013 concerning Transportation Accident Investigation. Jakarta, Indonesia. https://peraturan.bpk.go.id/Details/5396/pp-no-62-tahun-2013. Accessed August 11, 2025.
[23] Ministry of Transportation of the Republic of Indonesia. (2014). Minister of Transportation Regulation Number PM 52 of 2014 concerning Automatic Railway Safety System Devices. Jakarta, Indonesia. https://peraturan.bpk.go.id/Details/103768/permenhub-no-52-tahun-2014. Accessed August 11, 2025.
[24] Ministry of Transportation of the Republic of Indonesia. (2015). Regulation of the Minister of Transportation of the Republic of Indonesia Number 24 of 2015 concerning Railway Safety Standards. Jakarta, Indonesia. https://peraturan.bpk.go.id/Details/103404/permenhub-no-24-tahun-2015. Accessed August 11, 2025.
[25] Ministry of Transportation of the Republic of Indonesia. (2018). Minister of Transportation Regulation Number 69 of 2018 concerning the Railway Safety Management System. Jakarta, Indonesia. https://peraturan.bpk.go.id/Details/102625/permenhub-no-69-tahun-2018. Accessed August 11, 2025.
[26] Ministry of Transportation of the Republic of Indonesia. (2024). Regulation of the Minister of Transportation of the Republic of Indonesia Number 31 of 2024 concerning Assessment of Railway Safety. Jakarta, Indonesia. https://peraturan.bpk.go.id/Details/311517/permenhub-no-31-tahun-2024. Accessed August 11, 2025.
[27] Minister of Transportation of the Republic of Indonesia. (2011). Regulation of the Minister of Transportation of the Republic of Indonesia Number 43 of 2011 concerning the National Railway Master Plan. Jakarta, Indonesia. https://peraturan.bpk.go.id/Details/106446/permenhub-no-43-tahun-2011. Accessed August 11, 2025.
[28] Arisikam, D., Lubis, H.A.R., Kusumawati, A., Indrayana, D.V. (2024). The development of the train accident model to the infrastructure factors in Indonesia. International Journal of GEOMATE, 26(114): 34-41. https://doi.org/10.21660/2024.114.4084
[29] Purba, A., Purba, J.T. (2020). Jakarta-Bandung High-Speed rail transportation project: Facts and challenges. IOP Conference Series: Materials Science and Engineering, Novosibirsk, Russia: IOP Publishing Ltd, 918(1): 012034. https://doi.org/10.1088/1757-899X/918/1/012034
[30] Setiawan, D., Priyanto, S., Amrozi, M.R.F., Muthohar, I. (2025). The comparison of main features and minimum service standards of air-rail integrated services (ARIS) implementation in Indonesia. Multimodal Transportation, 4(3): 100224. https://doi.org/10.1016/j.multra.2025.100224
[31] Setiawan, D., Priyanto, S., Amrozi, M.R.F., Sugiarto, S. (2025). Optimization of air-rail integrated services (ARIS) with urban transportation in serving airplane passengers in Indonesia. Transportation Research Interdisciplinary Perspectives, 31: 101446. https://doi.org/10.1016/j.trip.2025.101446
[32] Wijayanto, Y., Fauzi, A., Rustiadi, E., Syartinilia. (2022). A system dynamics model of urban railway demand prediction for safety and security improvement: Lessons learned from Indonesian railway network. International Journal of Safety and Security Engineering, 12(2): 145-157. https://doi.org/10.18280/ijsse.120202
[33] Wijayanto, Y., Fauzi, A., Rustiadi, E., Syartinilia. (2022). Policy development of urban railway services sustainability in Indonesia: A multipol application. IOP Conference Series: Earth and Environmental Science, Institute of Physics, 1109(1): 012047 https://doi.org/10.1088/1755-1315/1109/1/012047
[34] Arifianto, S., Irawan, M.Z., Thaithatkul, P., Rizki, M., Tarigan, A.K.M., Widiastuti, N.O. (2025). Enhancing urban resilience through strategic parking pricing in Jakarta’s bus rapid transit corridors. Journal of the Civil Engineering Forum, 11(1): 1-10. https://doi.org/10.22146/jcef.13568
[35] Ciani, L., Guidi, G., Patrizi, G., Galar, D. (2021). Improving human reliability analysis for railway systems using fuzzy logic. IEEE Access, 9: 128648-128662. https://doi.org/10.1109/ACCESS.2021.3112527
[36] Alhadi, Z., Pratama, D.F., Yusran, R., et al. (2025). Effectiveness of traffic signal system policy for railway transportation safety on the Padang City-Pariaman City Line, West Sumatra, Indonesia. International Journal of Transport Development and Integration, 9(1): 69-79. https://doi.org/10.18280/ijtdi.090107
[37] Watson, I., Ali, A., Bayyati, A. (2021). Factors affecting efficiency of railways in terms of safety at railway level crossings. International Journal of Transport Development and Integration, 5(2): 190-207. https://doi.org/10.2495/TDI-V5-N2-190-207
[38] Wemakor, W.D., Jack, A., Schmid, F. (2018). Establishing the relationship between railway safety and operational performance. International Journal of Transport Development and Integration, 2(1): 98-114. https://doi.org/10.2495/TDI-V2-N1-98-114
[39] Ágh, C. (2021). Measurement distortion analysis of repetitive and isolated track geometry irregularities. Periodica Polytechnica Civil Engineering, 65(3): 852-865. https://doi.org/10.3311/PPci.17638
[40] Bondarabadi, M.A., Rahimi, H., Arefkhani, H., Kashani, A.T. (2023). A new approach to assess safety performance of rail regions with an emphasis on the resources and equipment of each region. Journal of Rail Transport Planning and Management, 25: 100371. https://doi.org/10.1016/j.jrtpm.2023.100371
[41] Macioszek, E., Kurek, A., Kowalski, B. (2020). Overview of safety at rail-road crossings in Poland in 2008-2018. Transport Problems, 15: 57-68. https://doi.org/10.21307/TP-2020-048
[42] Debbech, S., Bon, P., Collart-Dutilleul, S. (2019). A model-based system engineering approach to manage railway safety-related decisions. International Journal of Transport Development and Integration, 3(1): 30-43. https://doi.org/10.2495/TDI-V3-N1-30-43
[43] Bal, O., Tverdomed, V., Kovalchuk, O. (2024). Innovative approaches to developing national railway safety policy and training safety leaders. Transport systems and technologies, 43: 121-135. https://doi.org/10.32703/2617-9059-2024-43-10
[44] Guenab, F., Boulanger, J.L., Schön, W. (2013). Safety of railway control systems: A new preliminary risk analysis approach. International Journal of Safety and Security Engineering, 3(1): 59-68. https://doi.org/10.2495/SAFE-V3-N1-59-68
[45] Esmaeeli, N., Sattari, F., Lefsrud, L., Macciotta, R. (2024). Assessing the risks associated with the Canadian railway system using a safety risk model approach. Transportation Research Record, 2678(2): 795-808. https://doi.org/10.1177/03611981231176549
[46] Hadj-Mabrouk, H. (2020). Application of case-based reasoning to the safety assessment of critical software used in rail transport. Safety Science, 131: 104928. https://doi.org/10.1016/j.ssci.2020.104928
[47] Liu, C., Yang, S. (2023). A text mining-based approach for understanding Chinese railway incidents caused by electromagnetic interference. Engineering Applications of Artificial Intelligence, 117. https://doi.org/10.1016/j.engappai.2022.105598
[48] Ovidi, F., van der Vlies, V., Kuipers, S., Landucci, G. (2020). HazMat transportation safety assessment: Analysis of a “Viareggio-like” incident in the Netherlands. Journal of Loss Prevention in the Process Industries, 63: 103985. https://doi.org/10.1016/j.jlp.2019.103985
[49] Yang, L., Li, K. (2020). Safety risk analysis of railway accident with text-based bow-tie model. 3rd International Conference of Safe Production and Informatization, Chongqing, China, pp. 200-204. https://doi.org/10.1109/IICSPI51290.2020.9332329
[50] Zhang, Z., Liu, X. (2020). Safety risk analysis of restricted-speed train accidents in the United States. Journal of Risk Research, 23(9): 1158-1176. https://doi.org/10.1080/13669877.2019.1617336
[51] National Transportation Safety Committee of the Republic of Indonesia. (2025). Laporan dan Informasi Statistik Perkeretaapian (Railway Statistics Reports and Information). https://knkt.go.id/statistik. Accessed August 11, 2025.
[52] Robinson, G.M. (2020). Time series analysis. International Encyclopedia of Human Geography (2nd ed.). Amsterdam: Elsevier, pp. 291-300. https://doi.org/10.1016/B978-0-08-102295-5.10614-6
[53] Hanke, J.E., Wichern, D.W. (2014). Business forecasting (9th ed.). Pearson New International Edition.
[54] Bernal, J.L., Cummins, S., Gasparrini, A. (2017). Interrupted time series regression for the evaluation of public health interventions: A tutorial. International Journal of Epidemiology, 46(1): 348-355. https://doi.org/10.1093/ije/dyw098
[55] Wagner, A.K., Soumerai, S.B., Zhang, F., Ross-Degnan, D. (2002). Segmented regression analysis of interrupted time series studies in medication use research. Journal of Clinical Pharmacy and Therapeutics, 27(4): 299-309. https://doi.org/10.1046/j.1365-2710.2002.00430.x
[56] Alfian Nur, Z., Muthohar, I. (2024). Revealing the economic viability of railway investments (Case Study: Restoring Your Railway Programme, United Kingdom). Journal of the Civil Engineering Forum, 10(3): 217-228. https://doi.org/10.22146/jcef.11736
[57] Wang, X., Lei, Y., Zhang, X., Zhou, L. (2025). Safety evaluation of traffic enforcement improvement program in Shanghai. Transportation Research Record: Journal of the Transportation Research Board, 2679(12): 780-794. https://doi.org/10.1177/03611981251353704
[58] Zhang, Z., Liu, X., Hu, H. (2021). Passenger rail station safety improvement and analysis of end-of-track collisions based on systems-theoretic accident modeling and processes (STAMP). Smart and Resilient Transportation, 3(2): 94-117. https://doi.org/10.1108/srt-12-2020-0028
[59] Center of Transportation Infrastructure Research and Development. (2005). Mitigation of accident-prone locations [Penanganan Lokasi Rawan Kecelakaan Lalu Lintas]: Pd.T-09-2004-B. Departemen Permukiman dan Prasarana Wilayah, Ministry of Public Works, Republic of Indonesia, Jakarta, Indonesia.
[60] Linden, A. (2015). Conducting interrupted time-series analysis for single- and multiple-group comparisons. The Stata Journal, 1501(2): 480-500. https://doi.org/10.1177/1536867X1501500208
[61] Cohen, J., Cohen, P., West, S.G., Aiken, L.S. (2013). Applied multiple regression/correlation analysis for the behavioral sciences (3rd ed.). New Jersey: Routledge. https://doi.org/10.4324/9780203774441
[62] Wooldridge, J.M. (2020). Econometrics introductory: A modern approach (7th ed.). Boston: Cengage Learning Inc. https://www.academia.edu/49732662/Introductory_Econometrics_7E_2020_?auto=download.
[63] Office of the National Rail Safety Regulator. (2020). ONRSR guideline fatigue risk management. Adelaide, Australia. https://www.onrsr.com.au/industry-information/latest-news/onrsr-guideline-fatigue-risk-management. Accessed August 11, 2025.
[64] Lefsrud, L., Macciotta, R., Nkoro, A. (2020). Performance-based regulations for safety management systems in the canadian railway industry: An analytical discussion. Canadian Journal of Civil Engineering, 47(3): 248-256. https://doi.org/10.1139/cjce-2018-0513
[65] Maulana, A.A., Suweca, W. (2023). A review of RAMS analysis application on railway system. Jurnal Teknologi dan Manajemen, 4(2): 57-77. https://doi.org/10.31284/j.jtm.2023.v4i2.4523
[66] Australia, S. (2004). Handbook: Risk management guidelines, companion to AS/NZS 4360: 2004. Standards Australia Internal Ltd, Sydney. https://api.semanticscholar.org/CorpusID:168210573.
[67] British Standards Institution. (2018). Risk management — Guidelines (2nd ed.). Geneva: British Standard Institution. https://www.studocu.com/en-gb/document/the-brooke-house-sixth-form-college/business/bs-iso-31000-2018-risk-management/38303930.
[68] Vorst, C.R., Priyarsono, D.S., Budiman, A. (2018). Manajemen risiko berbasis SNI ISO 31000 (Risk Management Based on the SNI ISO 31000 Standard). Jakarta, Indonesia: National Standardization Agency. http://eprints.ulbi.ac.id/id/eprint/2646.
[69] Franklin, P., Broughton, D. (2022). Implementing risk management in a public transportation agency. In 2022 Annual Reliability and Maintainability Symposium, Tucson, AZ, USA, pp. 1-4. https://doi.org/10.1109/RAMS51457.2022.9893955
[70] Karanikas, N. (2016). Policy and practice in health and safety exploiting data from safety investigations and processes to assess performance of safety management aspects. Policy and Practice in Health and Safety, 14(2): 115-127. https://doi.org/10.1080/14773996.2016.1255444
[71] Cedergren, A. (2013). Implementing recommendations from accident investigations: A case study of inter-organisational challenges. Accident Analysis and Prevention, 53: 133-141. https://doi.org/10.1016/j.aap.2013.01.010
[72] Nakhal Akel, A.J., Di Gravio, G., Fedele, L., Patriarca, R. (2022). Learning from incidents in socio-technical systems: A systems‐theoretic analysis in the railway sector. Infrastructures, 7(7): 90. https://doi.org/10.3390/infrastructures7070090


