Fitryane Lihawa* | Sri Maryati | Muhammad Kasim | Ahmad Zainuri | Achmad Nur Fahry Machmud | Nasruddin Rasjid
© 2026 The authors. This article is published by IIETA and is licensed under the CC BY 4.0 license (http://creativecommons.org/licenses/by/4.0/).
OPEN ACCESS
Climate change poses escalating threats to tropical rural and coastal communities through recurrent hydrometeorological hazards that impact livelihoods, infrastructure, water security, and ecosystem health. This study evaluates climate vulnerability and qualitative climate-risk pathways across 18 Climate Village Program (PROKLIM) pilot villages and urban wards in Gorontalo Province, Indonesia, within the Result-Based Payment (RBP) Reducing Emissions from Deforestation and forest Degradation (REDD+) Green Climate Fund Output 2 framework. A descriptive-analytical mixed-methods approach was applied, integrating 18 village-level assessment forms, key-informant interviews (KII), direct observation, secondary climate and socio-economic data, and geographic information system (GIS)-based spatial analysis. Vulnerability was calculated using a reproducible Exposure-Sensitivity-Low adaptive capacity formula, V = (E + S + (1 - AC))/3, after min-max normalization of indicators. The results show that the vulnerability index ranged from 0.460 to 0.691, with 14 villages classified as medium and 4 villages as high vulnerability. The hazard-priority rubric identified 10 high, 6 moderate, and 2 low priority locations, dominated by floods and inundation, drought, extreme temperature, landslides, land degradation, strong winds, and coastal impacts. Major impacts included crop failure, disrupted planting calendars, water scarcity, declining water quality, public health risks, damaged roads, impaired drainage, vulnerable settlements, and coastal abrasion. These findings establish a transparent village-scale baseline for prioritizing adaptation, strengthening PROKLIM, and supporting regional climate-resilience policy in Gorontalo Province.
adaptive capacity, climate risk assessment, climate vulnerability, Gorontalo Province, multi-hazard assessment, PROKLIM
Climate change represents a critical challenge for sustainable development, as its impacts extend beyond long-term environmental shifts and increasingly manifest as recurrent hazards that disrupt livelihoods, infrastructure, public health, and ecosystem services. The Sixth Assessment Report of the Intergovernmental Panel on Climate Change (IPCC) highlights that both human and ecological systems are already experiencing intensified climate-related risks, with the most severe effects often borne by populations with limited adaptive capacity [1]. In tropical developing regions, these risks are compounded by the interaction of climatic stressors with rapid land-use change, uneven infrastructure, poverty, and high reliance on climate-sensitive sectors. Southeast Asia exemplifies a region where monsoon variability, rising temperatures, extreme rainfall, sea-level rise, and hydrometeorological disasters intersect with densely populated rural and coastal settlements, underscoring the necessity of local-scale vulnerability assessments for effective adaptation planning [2, 3].
In Indonesia, climate change is manifested through shifts in rainfall patterns, rising temperatures, increased seasonal uncertainty, drought, floods, landslides, extreme winds, coastal inundation, and degradation of environmental support systems. These hazards have direct implications for agriculture, water resources, settlements, infrastructure, health, and coastal livelihoods. Rural and peri-urban communities are often exposed to multiple risks because their livelihoods depend on land, water, ecosystem stability, and basic infrastructure that may be sensitive to climate variability. Studies in Southeast Asia show that flood risk, water insecurity, salinization, and heat stress are not merely physical phenomena; they become development risks when they reduce agricultural productivity, disrupt household income, damage roads and drainage systems, affect water quality, and increase the burden of climate-sensitive diseases [4-6]. Therefore, climate vulnerability must be understood as a place-based condition produced by the interaction between hazards, exposed populations and assets, sectoral sensitivity, and the capacity of communities and institutions to respond.
Despite increased policy focus on climate adaptation, many local contexts continue to lack integrated, standardized vulnerability information at the village scale. While national and provincial assessments help identify broad patterns of climate risk, they often obscure critical differences among villages in topography, livelihood structures, infrastructure, demographic composition, water access, and disaster history. This limitation is significant because adaptation measures are implemented at specific locations where risks are shaped by local biophysical and socio-economic factors. Research on flood and climate risk in Southeast Asia indicates that vulnerability assessments often prioritize hazard and exposure, with insufficient attention to social, institutional, and livelihood-related determinants of vulnerability [6]. Consequently, adaptation priorities may not effectively target the communities and sectors most in need of intervention.
A further challenge is the fragmentation of climate-risk information across sectoral datasets, administrative reports, disaster records, spatial maps, and community observations. This fragmentation impedes decision-makers' ability to compare vulnerability levels across locations and to design adaptation strategies that are both technically robust and socially relevant. For communities exposed to floods, droughts, landslides, extreme winds, and coastal hazards, fragmented data often result in generic interventions that fail to address specific risk pathways. For instance, villages with similar exposure to rainfall extremes may differ significantly in vulnerability due to variations in drainage capacity, access to clean water, demographic composition, reliance on agriculture, infrastructure quality, and the presence of local preparedness institutions. Therefore, an integrated approach that combines biophysical, socio-economic, infrastructural, and institutional indicators within a coherent framework is necessary to support evidence-based prioritization.
The vulnerability framework developed in climate change research provides a conceptual basis for addressing this problem. The IPCC tradition defines vulnerability as a function of exposure, sensitivity, and adaptive capacity, where exposure refers to the presence of people, livelihoods, ecosystems, infrastructure, or assets in places that could be adversely affected; sensitivity refers to the degree to which these systems are affected by climate stimuli; and adaptive capacity refers to the ability to adjust, cope, recover, or transform in response to risks [1] This framework has been widely applied in local and household-level studies because it allows researchers to move beyond hazard description and examine why some communities suffer greater impacts than others. Livelihood vulnerability studies also demonstrate that food, water, health, livelihood strategies, land access, and disaster frequency can be translated into composite indicators that reveal spatial and social differences in climate vulnerability [7, 8].
Previous studies further suggest that local climate adaptation becomes more actionable when vulnerability assessment is combined with participatory methods and spatial analysis. Mixed-method designs allow researchers to integrate quantitative indicators, community perceptions, key informant knowledge, and field observations, while geographic information systems (GIS) can visualize the spatial distribution of hazards and vulnerable assets. Such approaches are especially relevant in archipelagic and tropical settings, where risk is spatially uneven and shaped by micro-scale environmental conditions. In Indonesia, village-level vulnerability mapping has been institutionalized through tools such as the vulnerability index Data Information System, which uses exposure, sensitivity, and adaptive capacity indicators to support the identification of priority locations and adaptation actions. Community-based programs such as Program Kampung Iklim also indicate the importance of linking climate assessment with locally implemented adaptation practices, including water management, sanitation improvement, livelihood diversification, disaster preparedness, and ecosystem-based protection.
The literature closely related to this study provides important guidance but also reveals a gap. Studies on Southeast Asian climate vulnerability have examined flood risk, coastal resilience, mangrove-based adaptation, climate-smart agriculture, water insecurity, and livelihood diversification [9-12]. However, many assessments remain focused on a single sector, a particular hazard, or a broader administrative scale. There is still a need for integrated village-scale assessments that compare multiple locations using a consistent framework and document sectoral impacts across agriculture, water resources, public health, settlements, infrastructure, and coastal areas. This gap is especially relevant for Gorontalo Province, where pilot villages represent diverse urban, lowland, upland, agricultural, and coastal systems, yet climate vulnerability information remains insufficiently consolidated for prioritizing adaptation interventions.
This study addresses the identified gap by evaluating climate vulnerability and qualitative climate-risk pathways across 18 pilot villages and urban wards in Gorontalo Province within the Result-Based Payment (RBP) Reducing Emissions from Deforestation and forest Degradation (REDD+) Green Climate Fund Output 2 framework. The analysis focuses exclusively on climate-related hazards and does not assess greenhouse gas emission sources. The objectives are to: (i) identify the dominant climate-related hazards experienced by the pilot locations; (ii) develop a transparent and reproducible village-level vulnerability index using exposure, sensitivity, and adaptive-capacity indicators; (iii) interpret how hazards interact with livelihood, infrastructure, water, health, settlement, and coastal conditions; and (iv) provide an evidence-based baseline for prioritizing Climate Village Program (PROKLIM) adaptation actions. The novelty of the study lies in its integrated, site-based, and spatially explicit assessment across diverse urban, lowland, upland, agricultural, and coastal village typologies in Gorontalo.
2.1 Data sources and study units
The study used primary and secondary data, with the village or urban ward as the main unit of analysis. Primary data consisted of structured village-level assessment forms, key-informant interviews (KII), and direct field observations in all 18 PROKLIM pilot locations. The structured survey component comprised one completed village-level assessment form for each location (n = 18; one per village/urban ward). These data captured local hazard experience, sectoral impacts, water and sanitation conditions, settlement characteristics, livelihood dependence, existing adaptation practices, and community-level adaptive capacity.
Secondary data were obtained from official statistical, spatial, and sectoral sources, including climate and weather information, demographic and socio-economic statistics, land-use and land-cover data, administrative boundaries, village profiles, disaster-related records, and planning documents relevant to local climate adaptation. GIS-based spatial layers were used to describe topography, land-use patterns, coastal or upland characteristics, and the spatial relationship between settlements and hazard-prone areas. These secondary datasets provided the baseline for interpreting exposure, sensitivity, and adaptive capacity indicators and for validating spatial patterns observed during fieldwork.
Field-data reporting note: the available manuscript record identifies the village-level survey count (n = 18) and key-informant roles, but it does not contain the final interview log or exact fieldwork calendar. Before final journal submission, the authors should verify and insert the final total KII number, the exact fieldwork period, and the final team composition from the project field book.
2.2 Data collection procedures
Data collection followed a standardized sequence to ensure comparability across villages. First, the research team reviewed village profiles, hazard records, land-use information, and available climate-related data to prepare a preliminary village profile. Second, field surveys were conducted to verify local exposure conditions, settlement patterns, infrastructure constraints, water and sanitation conditions, and sectoral impact pathways. Third, KII were conducted with village officials, community leaders, livelihood representatives, health or sanitation actors, and local disaster or environmental actors who were familiar with previous climate-related events and existing adaptation practices.
The interviews were used to clarify survey responses, document local interpretations of flood duration, dry-season water stress, landslide-prone areas, strong-wind impacts, coastal abrasion, drainage failure, crop losses, and local coping practices. Direct observation was undertaken to verify drainage systems, water sources, sanitation facilities, agricultural areas, roads, slope conditions, coastal features, and settlement exposure. This field validation reduced the risk of misclassifying vulnerability where formal climate or disaster datasets were incomplete or spatially uneven.
2.3 Data analysis
Data analysis was carried out through descriptive, comparative, composite-index, spatial, and sensitivity-analysis approaches. Descriptive analysis summarized the physical, demographic, socio-economic, and infrastructural characteristics of each pilot location. Climate hazards were classified according to reported occurrence, perceived severity, spatial relevance, and sectoral consequences in agriculture, water resources, health, settlements, infrastructure, and coastal areas.
The vulnerability index was developed from indicators of exposure (E), sensitivity (S), and adaptive capacity (AC). Exposure indicators represented hazard type and frequency, spatial exposure, rainfall variability, slope or coastal exposure, and settlement location in hazard-prone areas. Sensitivity indicators represented climate-sensitive livelihoods, agricultural dependence, water-resource sensitivity, infrastructure quality, sanitation and health sensitivity, demographic fragility, and ecosystem or vegetation condition. Adaptive-capacity indicators represented access to clean water, drainage and road condition, sanitation services, local institutions, preparedness, livelihood diversification, ecosystem protection, and recovery capacity. Indicator values were normalized using min-max scaling. For indicators in which higher values represented higher vulnerability, x' = (x - xmin)/(xmax - xmin). For indicators in which higher values represented stronger capacity, x' = (xmax - x)/(xmax - xmin) when incorporated as vulnerability pressure. Adaptive capacity was first normalized as AC and then converted into low adaptive capacity (LAC = 1 - AC). Equal weighting was applied within each component and across the three components because no empirical basis was available to privilege one component over another. The final formula was V = (E + S + LAC)/3, where V ranges from 0 to 1. Indicator structure, normalization approach, and weighting used in the climate vulnerability index are shown in Table 1.
Table 1. Indicator structure, normalization approach, and weighting used in the climate vulnerability index
|
Component |
Indicators, Normalization, and Weighting |
|
Exposure (E) |
Indicators: hazard type and frequency; flood/inundation, drought, landslide/slope, strong-wind, coastal, and spatial settlement exposure. Normalization: min-max; higher values = greater exposure. Weight: equal indicator weights; E contributes 1/3 to V. |
|
Sensitivity (S) |
Indicators: climate-sensitive livelihoods; agricultural dependence; water-resource sensitivity; infrastructure fragility; sanitation/health sensitivity; demographic fragility; degraded vegetation/land condition. Normalization: min-max; higher values = greater sensitivity. Weight: equal indicator weights; S contributes 1/3 to V. |
|
Adaptive capacity (AC) |
Indicators: clean-water access; drainage and road condition; sanitation services; local institutions; preparedness; livelihood diversification; ecosystem protection; recovery capacity. AC is normalized from 0 to 1 and converted to LAC = 1 - AC. Weight: LAC contributes 1/3 to V. |
|
Final index |
V = (E + S + LAC)/3. Classes: very low 0.00-0.20; low 0.21-0.40; medium 0.41-0.60; high 0.61-0.80; very high 0.81-1.00. |
Vulnerability classes were mapped using the following thresholds: very low (0.00-0.20), low (0.21-0.40), medium (0.41-0.60), high (0.61-0.80), and very high (0.81-1.00). A separate numerical risk index was not computed. Therefore, the term climate risk in this paper refers to a qualitative interpretation of risk pathways arising from the interaction of hazards, exposure, sensitivity, impacts, and adaptive capacity (see Figure 1). The hazard-priority levels in Table 2 were assigned using a consistent rubric: low = isolated or infrequent hazard with insignificant or localized impacts; moderate = recurrent or multi-hazard exposure with minor to moderate impacts on households, infrastructure, or livelihoods; high = annual or severe multi-hazard exposure causing direct disruption to food security, housing, infrastructure, water supply, or agricultural production.
Table 2. Major climate-related hazards and rubric-based hazard-priority levels identified across the 18 pilot villages in Gorontalo Province
|
No |
Village/Subdistrict |
Hazard-Priority Level |
Main Assessment Basis |
|
1 |
Dulomo Selatan |
Moderate |
Flooding and strong winds with minor to moderate impacts |
|
2 |
Dulomo Utara |
Low |
Limited inundation with insignificant impacts |
|
3 |
Donggala |
Moderate |
Flooding, landslides, and extreme winds causing housing damage |
|
4 |
Limehe Timur |
High |
Annual flooding caused by Lake Limboto overflow and hillside runoff |
|
5 |
Buhu |
High |
Annual multi-hazard exposure: floods, droughts, landslides, and fires |
|
6 |
Talumelito |
Moderate |
Droughts and landslides affecting harvests and road access |
|
7 |
Meranti |
High |
Flash floods, annual landslides, and crop failure |
|
8 |
Tamboo |
Moderate |
Drought and strong winds affecting agricultural activities |
|
9 |
Botutonuo |
Moderate |
Drought, annual landslides, and strong winds |
|
10 |
Tombulilato |
Moderate |
Annual drought and strong winds |
|
11 |
Bulalo |
High |
Annual floods and droughts directly affecting food security |
|
12 |
Buata |
High |
Severe landslides combined with floods and droughts |
|
13 |
Pentadu Timur |
High |
Annual flooding and crop failure |
|
14 |
Jati Mulya |
High |
Recurrent annual flooding and drought |
|
15 |
Harapan |
High |
Annual floods and droughts damaging housing and agricultural production |
|
16 |
Taluduyunu |
Low |
Single extreme temperature event without significant impacts |
|
17 |
Hulawa |
High |
Annual floods, droughts, and landslides |
|
18 |
Sidorukun |
High |
Combined annual floods, droughts, and landslides |

Figure 1. Conceptual and computational framework for assessing climate vulnerability and qualitative climate-risk pathways
3.1 Climate hazard profile of the 18 pilot villages
The assessment of the 18 PROKLIM pilot villages and urban wards in Gorontalo Province shows that climate hazards are not isolated events but recurrent pressures affecting settlements, livelihoods, infrastructure, and ecosystem services. The most frequently identified hazards were annual floods and inundation, drought, extreme temperature, landslides, land degradation, strong winds, and coastal disturbances. This pattern is consistent with findings from tropical village-scale vulnerability studies, where floods, heavy rainfall, and riverine or coastal flooding are repeatedly identified as dominant hazards affecting local development and livelihood security [13-18]. In the Gorontalo pilot locations, flooding and inundation were particularly relevant for lowland and settlement areas with inadequate drainage, while drought and water stress were more significant in agricultural and upland contexts where seasonal rainfall variability influences water availability and crop production.
The results indicate that village-level climate exposure in Gorontalo is shaped by both rapid-onset and slow-onset hazards. Flooding, strong winds, and landslides represent rapid hazards that can produce immediate damage to roads, houses, drainage channels, agricultural land, and public facilities. Drought, rising temperature, land degradation, and coastal processes represent slower or recurring pressures that gradually reduce water security, agricultural productivity, and ecosystem stability. Similar patterns have been reported in other tropical and Southeast Asian settings, where drought and water stress intensify during inter-monsoon periods or localized dry conditions, while heat stress, salinization, landslides, and strong winds emerge as secondary but consequential hazards depending on terrain and coastal exposure [17-20]. These findings confirm that climate vulnerability in Gorontalo must be interpreted through a multi-hazard lens rather than through a single dominant hazard.
The 18 pilot locations represented urban, agricultural, upland, lowland, and coastal systems, and this diversity was reflected in the spatial variation of climate hazards. Urban wards and lowland settlements were more strongly associated with flood and inundation hazards due to higher settlement density, limited drainage capacity, and the concentration of roads and built-up areas. Agricultural villages were more sensitive to drought, rainfall uncertainty, and land degradation because crop production depends on seasonal water availability and soil conditions. Upland villages were more exposed to slope-related hazards, including landslides and erosion, particularly where vegetation cover had declined or land management was inadequate. Coastal locations faced additional hazards from coastal flooding, abrasion, and the degradation of natural protective systems.
This spatial pattern supports the argument that village-scale assessment is essential for adaptation planning because climate risk varies across relatively small administrative units. Regional or provincial analysis may identify broad climate trends, but it cannot adequately capture differences in topography, livelihood systems, infrastructure, and local adaptive capacity. The Gorontalo results, therefore, align with previous studies that emphasize the need to disaggregate climate exposure to identify who is exposed, which systems are sensitive, and where adaptive capacity is limited [5, 6]. The observed spatial variation also underscores the methodological value of combining field observations, local knowledge, and GIS-based analysis, as hazard exposure is influenced by both physical location and community-level development conditions.
3.2 Multi-hazard interactions and qualitative climate-risk pathways
The findings show that climate hazards in the study area interact in ways that amplify vulnerability. Floods and heavy rainfall not only damage houses, roads, and drainage systems but also disrupt agricultural activities, increase sanitation risks, and reduce access to public services. Drought, in contrast, reduces water availability, increases pressure on household and agricultural water supply, and contributes to crop stress. When drought is followed by intense rainfall, degraded soils and reduced vegetation cover may increase erosion, runoff, and landslide potential. Extreme temperatures further intensify water demand and may increase health risks, especially for children, elderly populations, and communities with limited access to clean water and health services. Strong winds add another layer of risk by damaging houses, crops, and infrastructure, particularly in settlements with weaker building conditions.
These interactions indicate that climate risk in Gorontalo is compound rather than linear. Similar studies have found that floods and droughts interact with soil moisture, livelihood dependence, and infrastructure exposure to amplify crop failure and asset loss, while heat stress increases water demand and health risk, and strong winds or landslides damage housing and public infrastructure [14, 15, 18, 20]. In the 18 pilot locations, compound risk was most evident in villages where natural resource dependence coincided with limited infrastructure and recurring hazards. Agricultural households, for example, were vulnerable not only because crops were exposed to drought or excessive rainfall, but also because unstable seasons, unreliable irrigation, land degradation, and limited livelihood diversification reduced their ability to recover.
The results show that livelihood sensitivity and infrastructure limitations are the main pathways through which climate hazards become social and economic risks. Villages with agricultural land and high dependence on farming were more vulnerable to rainfall variability, dry spells, crop failure, and changes in planting calendars. Where household income depends heavily on climate-sensitive activities, even moderate hazard events can generate significant livelihood disruption. This finding is consistent with studies showing that smallholder farmers and coastal communities in tropical regions are highly sensitive to rainfall variability, temperature shifts, and extreme events because their income, food security, and labor patterns depend directly on climate-sensitive resources [9, 21, 22].
Infrastructure conditions also shaped the translation of hazards into impacts. Weak drainage systems increased flood duration and settlement inundation. Limited road resilience made mobility and access to services vulnerable during heavy rainfall or landslide events. Inadequate water infrastructure increased household vulnerability during dry periods, especially where water sources were unevenly distributed or dependent on seasonal availability. These results support the IPCC view that climate risk emerges from the interaction of hazard, exposure, vulnerability, and adaptive capacity rather than from hazard alone [1]. The findings also indicate that adaptation priorities in Gorontalo should not be limited to disaster response, but should also include drainage improvement, water resource management, slope protection, resilient infrastructure, and community preparedness.
3.3 Classification of hazard frequency, intensity, and vulnerability
The classification of climate hazards in this study combined field-based information, village-level narratives, secondary data, and spatial interpretation. Hazard frequency and relevance were identified through structured surveys, key informant interviews, observation, and review of available climate and socio-economic data. This approach reflects the mixed-method orientation recommended for climate vulnerability assessment, in which quantitative data are complemented by qualitative hazard timelines, seasonal calendars, local observations, and participatory risk interpretation [14-16, 18]. The Vulnerability Sourcebook further supports this approach by recommending combining indicators, expert judgment, stakeholder input, and transparent scoring procedures for local vulnerability assessment [18].
In the Gorontalo assessment, hazard classification was not treated as a purely technical exercise but as an interpretation of recurrent local experiences. Floods, droughts, landslides, extreme temperatures, land degradation, strong winds, and coastal hazards were classified by reported occurrence, perceived severity, and sectoral consequences. This procedure enabled the identification of whether hazards were isolated, seasonal, recurrent, or structurally linked to local vulnerability conditions. The use of local knowledge was important because several hazards, particularly water scarcity, drainage failure, and crop losses, may not be fully captured by formal datasets. Participatory and field-based validation, therefore, helped reduce the risk of underestimating hazards that are locally significant but poorly recorded in official data.
The climate vulnerability index was calculated as V = (E + S + LAC)/3 using the normalized component values reported in Table 3. This formula explains why some villages with relatively low sensitivity still received a medium vulnerability classification: a low S value may be offset by higher exposure or lower adaptive capacity. For example, Meranti had low sensitivity (S = 0.242), but medium vulnerability (V = 0.529) because its exposure was high (E = 0.672) and its low-adaptive-capacity score was also high (LAC = 0.673). Similarly, Tamboo remained medium despite low sensitivity because exposure and LAC increased the combined index.
The qualitative risk interpretation supports the objective of identifying where recurrent hazards interact with climate-sensitive livelihoods and limited adaptive capacity. Villages with stronger water access, better sanitation, more stable infrastructure, and existing community-based adaptation practices tended to show greater resilience. Conversely, villages facing repeated flooding, drought, poor drainage, limited infrastructure, or degraded land conditions had higher qualitative risk pathways and required priority adaptation attention.
A sensitivity analysis was conducted to test whether the vulnerability classifications were robust to alternative component-weighting assumptions. The baseline used equal weights for E, S, and LAC. Three alternative scenarios increased the weight of one component to 0.40 while assigning 0.30 to each remaining component. The classification pattern was stable: the exposure-dominant scenario produced no class changes, while the sensitivity-dominant and LAC-dominant scenarios shifted only Hulawa from high to medium because its baseline value (V = 0.601) was located immediately above the high-class threshold. This indicates that the overall medium-to-high vulnerability pattern is not driven by a single component or arbitrary weighting choice.
Table 3. Classification of climate vulnerability levels based on exposure, sensitivity, and adaptive capacity indicators
|
Village |
E (Exposure) |
S (Sensitivity) |
AC (Adaptive Capacity) |
LAC (=1-AC) |
V |
Classification |
|
Dulomo Utara |
0.452 |
0.463 |
0.247 |
0.753 |
0.556 |
Medium |
|
Dulomo Selatan |
0.448 |
0.423 |
0.365 |
0.635 |
0.502 |
Medium |
|
Donggala |
0.583 |
0.434 |
0.510 |
0.490 |
0.502 |
Medium |
|
Limehe Timur |
0.651 |
0.603 |
0.519 |
0.481 |
0.578 |
Medium |
|
Buhu |
0.731 |
0.471 |
0.487 |
0.513 |
0.572 |
Medium |
|
Talumelito |
0.602 |
0.534 |
0.514 |
0.486 |
0.541 |
Medium |
|
Meranti |
0.672 |
0.242 |
0.328 |
0.673 |
0.529 |
Medium |
|
Tamboo |
0.563 |
0.201 |
0.385 |
0.615 |
0.460 |
Medium |
|
Botutonuo |
0.525 |
0.554 |
0.400 |
0.600 |
0.560 |
Medium |
|
Tombulilato |
0.631 |
0.561 |
0.447 |
0.553 |
0.582 |
Medium |
|
Bulalo |
0.611 |
0.521 |
0.380 |
0.620 |
0.584 |
Medium |
|
Buata |
0.573 |
0.412 |
0.468 |
0.533 |
0.506 |
Medium |
|
Pentadu Timur |
0.573 |
0.379 |
0.415 |
0.585 |
0.512 |
Medium |
|
Jati Mulya |
0.601 |
0.616 |
0.401 |
0.599 |
0.605 |
High |
|
Harapan |
0.679 |
0.501 |
0.326 |
0.674 |
0.618 |
High |
|
Taluduyunu |
0.570 |
0.628 |
0.482 |
0.518 |
0.572 |
Medium |
|
Hulawa |
0.740 |
0.587 |
0.524 |
0.476 |
0.601 |
High |
|
Sidorukun |
0.510 |
0.809 |
0.246 |
0.754 |
0.691 |
High |
Source: analysis results, 2026
3.4 Sectoral impacts of climate change
Agriculture emerged as one of the most climate-sensitive sectors in the study area. The main agricultural impacts included reduced productivity, increased crop failures, disrupted planting calendars, and uncertainty about water availability. Villages with agricultural land were more vulnerable when farming systems depended on seasonal rainfall, irrigation reliability was limited, or land degradation reduced soil resilience. Drought and extreme temperatures increased crop stress, while heavy rainfall and flooding damaged fields, delayed cultivation, and increased the likelihood of harvest loss. These results align with the climate-smart agriculture literature, which shows that rainfall variability, heat stress, and extreme events directly affect smallholder production through altered growing seasons, pest and disease pressure, water stress, and reduced yields [2, 9, 22].
The findings also indicate that agricultural vulnerability is not only biophysical but also socio-economic. Farmers with limited resources, weak access to inputs, low livelihood diversification, or limited access to climate information are less able to adjust planting schedules or invest in adaptive practices. Consequently, adaptation in the agricultural sector should include improved water management, crop diversification, climate information services, soil and land conservation, and support for climate-resilient livelihood strategies. Such measures are consistent with previous studies that emphasize climate-smart agriculture and livelihood diversification as key responses to reduce sensitivity in tropical rural communities [21, 22].
Water-resource impacts were evident in both dry and wet climate conditions. During dry periods, several villages experienced increased pressure on household and agricultural water supply, especially where communities relied on limited or unevenly distributed water sources. During high-rainfall periods, water quality and sanitation risks increased, particularly in settlements with weak drainage or incomplete sanitation infrastructure. This dual pressure reflects the broader climate-water security problem identified in Southeast Asia, where rainfall variability, urbanization, and uneven infrastructure jointly affect water availability, water quality, and household resilience [5, 11].
The findings suggest that water security is a cross-cutting determinant of adaptive capacity. Villages with more stable access to clean water were better positioned to cope with climate stress, while villages with limited or seasonally variable water access were more vulnerable to drought and health-related impacts. Adaptation priorities should therefore include water-source protection, improved distribution systems, rainwater harvesting, sanitation improvement, and community-based water governance. These interventions would not only address immediate water needs but also strengthen long-term resilience to rainfall variability and extreme climate events.
Climate-related health impacts were associated with flooding, heat exposure, water insecurity, and sanitation risks. Flooding and inundation can increase exposure to waterborne and vector-borne diseases, particularly where drainage is poor or sanitation facilities are inadequate. Extreme temperatures can increase heat stress and dehydration risk, especially for elderly populations, children, outdoor workers, and households with limited access to clean water. The assessment identified children and elderly people as socially and biologically vulnerable groups, reinforcing the need to integrate demographic sensitivity into local climate-risk analysis.
These results are consistent with the broader climate-health literature, which recognizes that climate change affects health through direct exposure to heat and disasters as well as indirect pathways involving water quality, sanitation, nutrition, and disease ecology [1]. In Gorontalo, public health adaptation should therefore be linked to water management, sanitation, early warning, health service readiness, and community education. Climate-health risks cannot be separated from settlement conditions and basic service provision, as health impacts are amplified when environmental hazards interact with inadequate infrastructure.
Settlements and infrastructure were affected primarily through flooding, inundation, landslides, strong winds, and coastal processes. The most common impacts included disrupted access roads, damaged drainage systems, vulnerable housing, and reduced access to public services during extreme events. In upland areas, slope instability and land degradation increased the potential for erosion and landslide-related damage. In coastal areas, inundation, abrasion, and degradation of coastal protection systems increased the exposure of households, roads, and livelihoods. These findings are consistent with studies showing that climate hazards in tropical regions affect settlements by damaging physical assets, disrupting mobility, and weakening protective ecosystems such as mangroves and coastal vegetation [10-12].
The results highlight the importance of spatially targeted adaptation. Lowland and urban settlements require improvements in drainage and flood management, as well as resilient road planning. Upland villages require slope stabilization, vegetation restoration, erosion control, and risk-sensitive land management. Coastal villages require ecosystem-based adaptation, shoreline protection, and integration of coastal risk into village development planning. Overall, the sectoral results demonstrate that climate impacts in the 18 pilot locations are interconnected across agriculture, water, health, settlements, infrastructure, and coastal systems. This interconnection reinforces the need for integrated adaptation planning rather than sectoral interventions designed in isolation. Sectoral pathways through which climate hazards affect agriculture, water resources, public health, settlements, infrastructure, and coastal areas are shown in Figure 2.

Figure 2. Sectoral pathways through which climate hazards affect agriculture, water resources, public health, settlements, infrastructure, and coastal areas
The findings show that climate vulnerability across the 18 PROKLIM pilot villages and urban wards in Gorontalo Province is shaped by the interaction between hazard exposure, socio-economic sensitivity, and adaptive capacity. Recurrent floods and inundation, drought, extreme temperature, landslides, land degradation, strong winds, and coastal impacts did not produce uniform consequences across the study sites. Villages with agricultural land, weak drainage, limited water infrastructure, degraded vegetation cover, and a high dependence on natural-resource-based livelihoods tended to be more vulnerable. This confirms the Exposure–Sensitivity–Adaptive Capacity framework, which explains vulnerability as a relational condition produced by the interaction among climate hazards, exposed systems, sectoral sensitivity, and communities' ability to respond [1, 6, 7]. The results are also consistent with studies showing that communities exposed to similar hazards may experience different levels of risk depending on livelihood dependence, asset ownership, market access, institutional support, and recovery capacity [23-26].
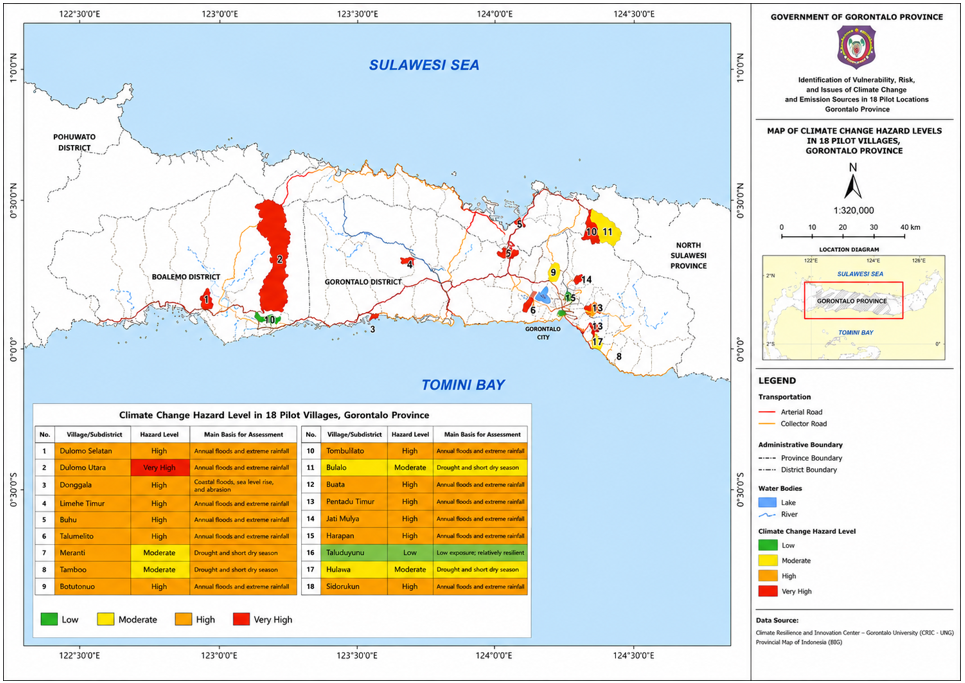
The spatial variation of vulnerability confirms the importance of village-scale assessment for climate adaptation planning. As shown in Figure 3 and Table 3, vulnerability patterns differed across urban, lowland, upland, agricultural, and coastal locations. Lowland and urban settlements were more exposed to flooding and drainage-related risks; upland villages were more sensitive to slope instability and land degradation; agricultural villages were affected by rainfall uncertainty and drought; while coastal communities faced inundation and abrasion. This heterogeneity supports the argument that provincial or district-level assessments may be insufficient for identifying local adaptation needs, because they often obscure the specific pathways through which climate stress becomes livelihood, infrastructure, health, and settlement risk [25, 27, 28].
Socio-economic conditions were central in explaining differences in vulnerability among villages. Communities dependent on farming were more sensitive to rainfall variability, crop failure, disrupted planting calendars, and reduced water availability. This finding aligns with broader evidence that households reliant on agriculture, fisheries, or informal, climate-sensitive labor are more vulnerable because income, food security, and daily activities are directly affected by weather variability and extreme events [23-25]. In Gorontalo, agricultural vulnerability was intensified by limited livelihood diversification, water management constraints, limited access to climate information, and land degradation. Therefore, adaptation in agricultural villages should not only focus on technical crop management but also on improving livelihood resilience, water governance, soil conservation, and access to adaptive resources.
Adaptive capacity emerged as the main factor mediating whether exposure and sensitivity translated into severe climate risk. Villages with better water access, stronger local institutions, functional infrastructure, and existing community-based adaptation practices were relatively more resilient, even when exposed to similar hazards. This supports previous findings that adaptive capacity reduces vulnerability by improving preparedness, coping ability, recovery speed, and long-term adjustment [27, 29-31].
Community participation is essential for translating vulnerability assessment into realistic adaptation planning. Local actors possess direct knowledge of flood duration, dry-season water stress, landslide-prone areas, drainage failure, crop losses, and coping practices. Participatory processes can improve the relevance, legitimacy, and acceptance of adaptation actions by linking technical assessment with local experience and governance systems [15, 16, 32, 33]. In the context of PROKLIM villages, this is particularly important because adaptation actions must be embedded in village planning, supported by local institutions, and maintained beyond project-based interventions.
From a sustainable-development and planning perspective, the results imply that adaptation should be prioritized according to the dominant risk pathway in each village rather than delivered as a generic package. Lowland and urban settlements require drainage rehabilitation, flood-safe road planning, and settlement-level preparedness. Agricultural villages require climate information services, soil and water conservation, crop diversification, and livelihood-risk reduction. Upland villages require slope stabilization, vegetation restoration, and risk-sensitive land management, whereas coastal villages require shoreline protection, ecosystem-based adaptation, and integration of coastal hazards into village development plans.
Figure 3. Spatial distribution of rubric-based hazard-priority levels across the 18 PROKLIM pilot villages in Gorontalo Province
This study has limitations that should be considered when interpreting the findings. The assessment provides a cross-sectional baseline and therefore cannot fully capture year-to-year changes in vulnerability, future climate trajectories, or household-level inequality within each village. The vulnerability index also depends on the quality of available local and secondary data. Future research should combine longitudinal monitoring, household-disaggregated surveys, climate projections, and post-intervention evaluation to test whether PROKLIM adaptation actions reduce vulnerability over time.
This study demonstrates that climate vulnerability across the 18 PROKLIM pilot villages and urban wards in Gorontalo Province is shaped by the interaction between recurrent hydrometeorological hazards, socio-economic sensitivity, and uneven adaptive capacity. The vulnerability index ranged from 0.460 to 0.691, with 14 villages classified as medium vulnerability and 4 villages classified as high vulnerability. The hazard-priority rubric identified 10 high, 6 moderate, and 2 low priority locations. Floods and inundation, drought, extreme temperature, landslides, land degradation, strong winds, and coastal impacts were the dominant hazards affecting the study area.
The study confirms that village-scale climate vulnerability cannot be explained by hazard exposure alone. Socio-economic conditions, infrastructure quality, institutional support, and access to adaptive resources strongly influenced whether hazards translated into serious impacts. The reproducible formula V = (E + S + LAC)/3 clarified the role of exposure, sensitivity, and LAC, while sensitivity analysis showed that the medium-to-high vulnerability pattern remained robust under alternative weighting assumptions. Adaptive capacity emerged as the most important practical entry point for reducing climate-related impacts through improved water access, drainage, sanitation, resilient infrastructure, livelihood diversification, local institutions, and preparedness.
The study contributes to village-scale climate vulnerability assessment in tropical regions by translating climate-risk concepts into operational local indicators for community-based adaptation planning. The findings provide an evidence-based baseline for strengthening PROKLIM implementation and supporting regional climate-resilience planning in Gorontalo Province. Future studies should incorporate longitudinal monitoring, household-level inequality analysis, and climate projections to better capture dynamic vulnerability patterns and evaluate the long-term effectiveness of adaptation interventions.
The authors gratefully acknowledge the Government of Gorontalo Province, particularly the Environmental and Forestry Service of Gorontalo Province, for supporting this study under the RBP REDD+ Green Climate Fund Output 2 Program. The activity was initiated by the Government of Gorontalo Province and implemented in collaboration with the Faculty of Mathematics and Natural Sciences, Universitas Negeri Gorontalo. The authors also thank the local governments and community representatives in the 18 PROKLIM pilot locations for their support during data collection.
[1] Intergovernmental Panel on Climate Change (IPCC). (2023). Climate change 2022 – Impacts, Adaptation and vulnerability: Working group II contribution to the sixth assessment report of the intergovernmental panel on climate change. Cambridge University Press. https://doi.org/10.1017/9781009325844
[2] Amnuaylojaroen, T. (2025). Intensification of heat extremes in Southeast Asia: Spatial–temporal analysis of temperature trends and heat events (1940–2023). International Journal of Climatology, 45(10): e8907. https://doi.org/10.1002/joc.8907
[3] Schleussner, C.F., Deryng, D., D'haen, S., et al. (2018). 1.5℃ hotspots: Climate hazards, vulnerabilities, and impacts. Annual Review of Environment and Resources, 43: 135-163. https://doi.org/10.1146/annurev-environ-102017-025835
[4] Le, H.N., Sofija, E., Harris, N., Nguyen, T., Phung, H. (2024). Food security in slow-onset disasters: A policy review in Southeast Asian regions. World Medical & Health Policy, 16(3): 353-375. https://doi.org/10.1002/wmh3.604
[5] Lorenzo, T.E., Kinzig, A.P. (2020). Double exposures: Future water security across urban Southeast Asia. Water, 12(1): 116. https://doi.org/10.3390/w12010116
[6] Nguyen, M.P., Pagella, T., Catacutan, D.C., Nguyen, T.Q., Sinclair, F. (2021). Adoption of agroforestry in Northwest Viet Nam: What roles do social and cultural norms play? Forests, 12(4): 493. https://doi.org/10.3390/f12040493
[7] Hahn, L.A., Schmidt, M., Rammig, A., Zang, C.S. (2025). Ecophysiologically driven irrigation scheduling for safeguarding reforestation efforts in drought-prone calamity areas in Central Europe. Ecological Indicators, 178: 113969. https://doi.org/10.1016/j.ecolind.2025.113969
[8] Tran, V.N., Kim, T., Xu, D., et al. (2025). AI improves the accuracy, reliability, and economic value of continental-scale flood predictions. AGU Advances, 6(3): e2025AV001678. https://doi.org/10.1029/2025av001678
[9] Andriesse, E. (2022). Local divergence and obstacles to spur inclusive coastal development in Iloilo Province, the Philippines. Asia & the Pacific Policy Studies, 9(2): 147-164. https://doi.org/10.1002/app5.348
[10] Ferreira, C.S.S., Duarte, A.C., Kasanin-Grubin, M., Kapovic-Solomun, M., Kalantari, Z. (2022). Hydrological challenges in urban areas. Advances in Chemical Pollution, Environmental Management and Protection, 8(1): 47-67. https://doi.org/10.1016/bs.apmp.2022.09.001
[11] Hamel, P., Tan, L. (2021). Blue–green infrastructure for flood and water quality management in Southeast Asia: Evidence and knowledge gaps. Environmental Management, 69: 699-718. https://doi.org/10.1007/s00267-021-01467-w
[12] Kurniawan, T.A., Pasaribu, B., Kusworo, T.D., et al. (2024). Building disaster resilience in Thousand Islands (Indonesia): Unlocking climate adaptation strategies to navigate sea level rise in coastal regions while safeguarding crop productivity and local biodiversity. ACS ES&T Water, 4(8): 3213-3224. https://doi.org/10.1021/acsestwater.4c00099
[13] Hiwasaki, L., Luna, E., Syamsidik, Shaw, R. (2015). Process for integrating local and indigenous knowledge related to hydro-meteorological hazards with science: Experiences from coastal and small island communities in Southeast Asia. APN Science Bulletin, 5(1): 10-12. https://doi.org/10.30852/sb.2015.10
[14] Henningsen, S., Pauli, N., Chhom, C. (2020). Seasonal livelihoods and adaptation strategies for an uncertain environmental future: Results from participatory research in Kratie Province, Cambodia. In Climate-Induced Disasters in the Asia-Pacific Region: Response, Recovery, Adaptation, pp. 135-165. https://doi.org/10.1108/s2040-726220200000022006
[15] Pauli, N., Williams, M., Henningsen, S., et al. (2021). “Listening to the sounds of the water”: Bringing together local knowledge and biophysical data to understand climate-related hazard dynamics. International Journal of Disaster Risk Science, 12: 326-340. https://doi.org/10.1007/s13753-021-00336-8
[16] Peñalba, E.H., David, A.P.J., Mabanta, M.J.D., Samaniego, C.R.C., Ellamil, S.D. (2021). Climate change adaptation: The case of coastal communities in the Philippines. Journal of the Geographical Institute "Jovan Cvijic", SASA, 71(2): 115-133. https://doi.org/10.2298/ijgi2102115p
[17] Poudel, S., Funakawa, S., Shinjo, H., Mishra, B. (2020). Understanding households' livelihood vulnerability to climate change in the Lamjung district of Nepal. Environment, Development and Sustainability, 22: 8159-8182. https://doi.org/10.1007/s10668-019-00566-3
[18] Zebisch, M., Schneiderbauer, S., Fritzsche, K., et al. (2021). The vulnerability sourcebook and climate impact chains – A standardised framework for a climate vulnerability and risk assessment. International Journal of Climate Change Strategies and Management, 13(1): 35-59. https://doi.org/10.1108/ijccsm-07-2019-0042
[19] Ashrafuzzaman, M. (2023). Local context of climate change adaptation in the south-western coastal region of Bangladesh. Sustainability, 15(8): 6664. https://doi.org/10.3390/su15086664
[20] Gentle, P., Thwaites, R., Race, D., Alexander, K. (2014). Differential impacts of climate change on communities in the middle hills region of Nepal. Natural Hazards, 74: 815-836. https://doi.org/10.1007/s11069-014-1218-0
[21] Habib, A., Borazon, E.Q., Macusi, E.D., et al. (2023). Climate change vulnerability and impacts on tropical fisheries and aquaculture in Asia: A bibliometric and meta-analysis. Research Square. https://doi.org/10.21203/rs.3.rs-3479411/v1
[22] Sebastian, L.S., Bernardo, E.B. (2019). Making the smallholder farmers in Southeast Asia climate smart - The CCAFS R4D thrust. In Climate Smart Agriculture for the Small-Scale Farmers in the Asian and Pacific Region, pp. 201-226. https://doi.org/10.56669/cwve8991
[23] Fatima, K., Jan, M., Ahmad, I., Farooq, M., Muslim, M. (2025). Micro-level vulnerability assessment among agricultural communities of District Kupwara, Kashmir Himalaya. Research Square. https://doi.org/10.21203/rs.3.rs-5749856/v1
[24] Maina, J., Kithiia, J., Cinner, J., et al. (2015). Integrating social–ecological vulnerability assessments with climate forecasts to improve local climate adaptation planning for coral reef fisheries in Papua New Guinea. Regional Environmental Change, 16: 881-891. https://doi.org/10.1007/s10113-015-0807-0
[25] Pereira, J., Rosalino, L.M., Mucova, S., et al. (2021). Livelihood vulnerability increases human–wildlife interactions. Environmental Conservation, 48(4): 301-309. https://doi.org/10.1017/s037689292100028x
[26] Tang, J.H., Xiong, K.N., Chen, Y., Wang, Q., Ying, B., Zhou, J.Y. (2022). A review of village ecosystem vulnerability and resilience: Implications for the rocky desertification control. International Journal of Environmental Research and Public Health, 19(11): 6664. https://doi.org/10.3390/ijerph19116664
[27] Dube, N., Sithole, M., Ngwenya, T., et al. (2018). Impact of climate change on sustainability in semi-arid, rural Africa: Lessons from rural Zimbabwe. Cogent Social Sciences, 4(1): 1553327. https://doi.org/10.1080/23311886.2018.1553327
[28] Tallman, P.S., Valdés-Velásquez, A., Salmón-Mulanovich, G., et al. (2019). A “Cookbook” for vulnerability research. Frontiers in Public Health, 7: 352. https://doi.org/10.3389/fpubh.2019.00352
[29] Dasgupta, S., Badola, R. (2020). Indicator-based assessment of resilience and vulnerability in the Indian Himalayan region: A case study on socio-economy under different scenarios. Sustainability, 12(17): 6938. https://doi.org/10.3390/su12176938
[30] Iliyyan, D.U., Boer, R., Hidayati, R. (2022). Assessment of livelihood vulnerability to climate change using three index methods. Agromet, 36(2): 88-100. https://doi.org/10.29244/j.agromet.36.2.88-100
[31] Maleki, R., Nooripoor, M., Azadi, H., Lebailly, P. (2018). Vulnerability assessment of rural households to Urmia Lake drying (the case of Shabestar region). Sustainability, 10(6): 1862. https://doi.org/10.3390/su10061862
[32] Kato, T., Rambali, M., Blanco-Gonzalez, V. (2021). Strengthening climate resilience in mountainous areas. OECD Development Co-operation Working Papers, No. 104, OECD Publishing, Paris. https://doi.org/10.1787/1af319f0-en
[33] Liu, J.G., Mao, G.Q., Hoekstra, A.Y., et al. (2018). Managing the energy-water-food nexus for sustainable development. Applied Energy, 210: 377-381. https://doi.org/10.1016/j.apenergy.2017.10.064