Alwan* | Andi Muhibuddin | Syafri | Rudi Latief | Murshal Manaf | Batara Surya | Darmawan Salman | Syamsul Bahri
© 2026 The authors. This article is published by IIETA and is licensed under the CC BY 4.0 license (http://creativecommons.org/licenses/by/4.0/).
OPEN ACCESS
In recent years, urbanization in tropical secondary cities has occurred rapidly. This phenomenon causes environmental problems such as the Urban Heat Island (UHI) effect. Kendari City in Indonesia has been transformed rapidly over the past decade. To date, an integrated long-term analysis of UHI, land-use change, and spatial clustering is lacking. This study seeks to analyze spatio-temporal trends of land surface temperature (LST), UHI intensity, and land use/land cover (LULC) in Kendari City for 2014, 2019, and 2024 using Landsat 8 OLI/TIRS Collection 2 Level-2 imagery and spatial statistical analysis. The LULC map was classified using supervised Maximum Likelihood Classification (MLC) from Landsat 8 imagery. The LST was generated using the emissivity corrected radiative transfer (RT) model based on Landsat 8 TIRS Band 10. The spatial autocorrelation of UHI was assessed by Global Moran's I analysis. The maximum LST shows an increase from 27.02 ℃ in 2014 to 31.64 ℃ in 2024. The increase in built-up area was 39.19%, while agricultural land showed a drastic decrease during the same period. Moreover, the relative extent of the areas classified as High and Very High UHI has also increased over the years, indicating a progressive spatial concentration of UHI, with Moran's I growing from 0.7716 to 0.8084. The study shows that urban sprawl, vegetation loss, and surface temperature are highly spatially autocorrelated. This study contributes to UHI research in secondary cities in the tropics by integrating long-term LULC data, remotely-sensed thermal data and spatial autocorrelation to promote climate-informed city growth and the adoption of thermal mitigation measures appropriate for local conditions.
urbanization, Urban Heat Island, land surface temperature, remote sensing, spatial analysis
The Urban Heat Island (UHI) is one of the most serious environmental issues facing fast-growing cities around the world, but especially in tropical countries with naturally higher baseline temperatures [1, 2]. The UHI can be defined as the phenomenon of increased surface and ambient temperatures in urban areas relative to the surrounding rural and suburban context. This is mainly due to the systematic replacement of natural vegetative cover by impervious surfaces such as low-albedo concrete, asphalt and roofs [3, 4]. Climate change is accelerated due to rapid urbanization and has been found to exacerbate the magnitude and spatial extent of the UHI that subsequently affects human health, cooling, energy consumption and the livability of the city [1, 2, 4].
Urbanization is associated with a general increase in LST worldwide, and LST is highly dynamic with changes in land use/land cover (LULC) [5, 6]. Several international studies in different climatic zones have identified LULC changes (particularly changes from vegetated to built-up areas) as one of the most important drivers of increasing LST and UHI intensification globally [7-9]. Southeast Asian countries, including Indonesia, are experiencing rapid urbanization as urban built-up areas expand in large and medium-sized cities. Local studies indicate that built-up and vegetation decrease have a direct relationship with surface temperature increase in Jakarta, Kendari, and Wakatobi in a similar manner as other regions around the world have experienced. Comprehensive spatiotemporal studies with over a decade of continuity remain limited, especially for secondary tropical cities outside the two largest urban centers, Jakarta and Surabaya [10-12].
In the past decade, Kendari's population and urban area have expanded dramatically, transforming the city from a medium-sized city into the regional growth center of South-East Sulawesi Province. Accordingly, land use in Kendari has shifted rapidly from agricultural and natural land cover to residential and commercial land cover [13-15]. This study differs from other research in Kendari, which either focused on the early to mid-2000s or examined short-term UHI studies without investigating related LULC changes [16]. This study covers a longer research period and employs advanced spatial statistical methods to analyze the spatial-temporal relationship and spatial pattern of UHI in Kendari in terms of LULC and LST based on Landsat satellite imagery.
Our limited knowledge is that secondary cities with less planned growth tend to grow faster than the well-established metropolitan cities [9, 17-19]. Many studies have adequately demonstrated the relationship between LULC and surface temperature variations in tropical cities, but they have been limited in duration or lacked spatial autocorrelation analysis to investigate the non-uniform distribution of heat in space [6, 20-22]. Land use, vegetation distribution, built-up area density, and surface temperature distribution affect LST. Studies in Jakarta and Majene indicated that a 10% reduction in vegetation increased the surface temperature by 0.9 ℃. However, previous studies in Kendari City mostly covered a shorter range of time, from 2001 to 2019 or the last five years, focusing on mapping LST and NDVI without discussing the systematic correlation between decadal LULC changes [23-25]. Spatial autocorrelation analyses such as Global Moran’s I are rarely used to evaluate the longitudinal evolution of hot/cold spot clusters [25, 26]. Spatial autocorrelation analysis is crucial for identifying temperature clustering patterns and detecting spatial dependencies in urban heat distribution. The global Moran’s I index allows for an assessment of whether high-temperature zones are spatially concentrated, dispersed, or randomly distributed over time; however, no spatially explicit longitudinal studies have been conducted for Kendari during the 2014–2024 period. Furthermore, the application of multi-year Moran’s-I analysis to map the evolution of UHI hotspots and coldspots is rarely conducted in the Indonesian urban climate literature [21, 27, 28]. Unlike previous studies in Indonesian cities, which largely rely on descriptive thermal mapping or short-term analysis, this study integrates the detection of LULC changes on a decadal scale, satellite-based LST data collection, and spatial autocorrelation within an integrated analytical framework for a secondary tropical city. This study is unique in that it examines the 2014–2024 period, integrates LULC changes, and applies spatial autocorrelation analysis to understand the dynamics of UHI thermal clustering, thereby providing a comprehensive longitudinal baseline and empirical evidence to support adaptive spatial planning for UHI in tropical secondary cities such as Kendari.
Previous UHI studies in Kendari and other Indonesian cities have primarily focused on descriptive thermal mapping, short observational periods, or simple correlations between NDVI and LST. Most existing studies analyzed only single-year or short-term conditions without integrating long-term land use dynamics and spatial statistical approaches. In contrast, this study provides three major contributions. First, it investigates decadal UHI evolution over the 2014–2024 period using multi-temporal satellite observations. Second, it integrates LULC change detection, satellite-derived LST, and spatial autocorrelation analysis within a unified analytical framework. Third, this study applies Global Moran’s I to evaluate the longitudinal evolution of thermal clustering patterns, enabling the identification of spatial concentration, expansion, and consolidation of UHI hotspots over time. This integrated spatio-temporal framework is rarely applied in tropical secondary cities in Indonesia, particularly in Kendari. The objectives of this study consist of four points: (1) to quantitatively measure changes in land use patterns in Kendari City over the past decade; (2) to analyze the spatial-temporal variations in LST and UHI intensity; (3) to evaluate UHI clustering patterns using Global Moran’s I; (4) to empirically correlate specific land use types with UHI intensity.
The results of this study are expected to contribute to the theoretical understanding of UHI dynamics in tropical secondary cities while providing strong empirical evidence to support urban planning and climate adaptation policies in Kendari and similar urban contexts. By developing a methodological approach through the integration of long-term satellite observations, spatial statistics, and LULC analysis, this study strengthens the basis for the development of effective thermal mitigation strategies and evidence-based spatial planning policies in tropical regions undergoing rapid urbanization.
2.1 Study area
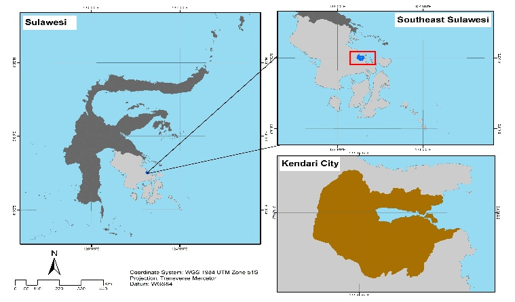
The research location is at coordinates 3°58.540' South Latitude – 122°31.036' East Longitude and 3°58.095' South Latitude – 122°31.923' East Longitude. Administratively, Kendari City is located in Southeast Sulawesi Province, covering eleven subdistricts with an area of 267.37 km² (Figure 1). All spatial analyses were performed using ArcGIS 10.8 and QGIS 3.22. This location was chosen because it is a coastal city with a tropical climate that is undergoing rapid urbanization accompanied by significant land cover change.
Figure 1. Research location
2.2 Data and methods
In this study, data collection was conducted through a combination of field measurements and satellite image analysis. Using a single satellite platform (Landsat 8 OLI/TIRS) for all observation years improves radiometric consistency and minimises methodological bias in inter-temporal LULC and LST comparison (Table 1). Landsat 8 Collection 2 Level-2 Surface Reflectance products were utilised in this study because they provide atmospherically corrected surface reflectance and improved radiometric calibration compared to the previous Collection 1 datasets. The use of Collection 2 Level-2 products enhances the reliability and inter-temporal consistency of LULC classification, NDVI calculation, emissivity estimation, and LST retrieval for multi-year UHI analysis.
Table 1. Data used in the study
|
Year |
Date |
Acquisition Date |
Path/Row |
Cloud Cover |
|
2014 |
Landsat 8 OLI/TIRS Collection 2 Level-2 |
9 October 2014. 01:57:49 |
113/063 |
1.25 |
|
2019 |
Landsat 8 OLI/TIRS Collection 2 Level-2 |
21 September 2019. 01:57:55 |
113/063 |
10.06 |
|
2024 |
Landsat 8 OLI/TIRS Collection 2 Level-2 |
29 October 2024 01:57:42 |
113/063 |
7.03 |
All Landsat scenes were selected during the dry season (September–October) to minimize seasonal variability in vegetation moisture, precipitation, and atmospheric conditions. Images with cloud cover below 15% were prioritized to reduce cloud contamination and ensure inter-annual comparability of thermal conditions.
2.3 Land use classification
The land use classification was done using the supervised Maximum Likelihood Classification (MLC) technique on multi-temporal Landsat 8 OLI (Operational Land Imager) images for the years 2014, 2019, and 2024, employing the same methodology, band combinations, and spatial resolution to ensure methodological consistency across the years of observation. The study identified six land use categories: settlement (residential, commercial, industrial); forests (natural forests and plantation forests); gardens/agricultural land (mixed agricultural land); rice fields (paddy fields); water bodies (rivers, lakes, coastal areas); and vacant land (open land, barren land and construction sites).
It had an overall accuracy of 86.67% (2014), 87.33% (2019) and 91.67% (2024) and Kappa coefficients of 0.83, 0.84 and 0.89, respectively, using 300 validation points.
To evaluate changes in land use, three indicators were computed for each land cover class for each year: absolute area change (ha), relative percentage area change, and proportional land share change. The general trends in urban growth and landscape change for the study area between 2014 and 2024 were identified.
2.4 Land surface temperature retrieval
Land surface temperature (LST) is important in environmental monitoring and studying land surface-atmosphere interactions. It is useful in climate system modeling, studies on the UHI effect, and ecological modeling studies [29, 30]. Numerous techniques and methods for LST analysis exist. The retrieval of the LST requires the use of satellite remote sensing. The use of thermal infrared information enables the availability of the LST values from different land covers using algorithms such as the split-window method, the single-channel method, and other methods, taking into account the effect of atmospheric interference and emissivity [31-33]. Steps to derive LST from Landsat imagery include converting Landsat DN (Digital Number) to radiance, converting band radiance to BT (Brightness Temperature), and retrieving the Land Surface Emissivity (LSE). The LST retrieval process was performed using Landsat 8 Thermal Infrared Sensor (TIRS) Band 10. Only Band 10 was utilized because Band 11 is affected by larger calibration uncertainty associated with stray-light contamination, as documented in USGS technical recommendations and previous thermal remote sensing studies. The use of a single thermal band approach improves the reliability and consistency of inter-temporal LST estimation. The Digital Number (DN) values from Band 10 were converted into Top of Atmosphere (TOA) spectral radiance using the following equation:
$L \lambda=M L \times Q c a l+A L-O i$ (1)
where, Lλ = TOA spectral radiance (W·m⁻²·sr⁻¹·µm⁻¹); ML = band-specific multiplicative rescaling factor (RADIANCE_MULT_BAND_10 from image metadata); Qcal = quantized calibrated pixel value (DN); and AL = band-specific additive rescaling factor (RADIANCE_ADD_BAND_10 from image metadata).
TOA spectral radiance was converted to at-sensor brightness temperature (BT) in degrees Celsius using the thermal calibration constants provided in the image metadata:
$B T=\frac{K_2}{\ln \left(\frac{K_1}{L_\lambda}+1\right)}-273.15$ (2)
where, BT = at-sensor brightness temperature (℃); K₁ = band-specific thermal conversion constant (K1_CONSTANT_BAND_10 = 774.8853 W·m⁻²·sr⁻¹·µm⁻¹); and K₂ = band-specific thermal conversion constant (K2_CONSTANT_BAND_10 = 1321.0789 K).
LSE (ε) was estimated following the three-stage NDVI Threshold Method (NDVI_THM) [34].
First, the Normalized Difference Vegetation Index (NDVI) was computed from the atmospherically corrected surface reflectance values of OLI Band 5 (NIR) and Band 4 (Red):
$N D V I=\frac{N I R-R E D}{N I R+R E D}=\frac{B 5-B 4}{B 5+B 4}$ (3)
where, NDVI values range from −1 to +1, with values approaching +1 indicating dense photosynthetically active vegetation and values near 0 or negative indicating bare soil, impervious surfaces, or open water.
Second, the fractional vegetation cover (PV) was derived from NDVI using the Carlson and Ripley (1997) formulation:
$P V=\left(\frac{N D V I-N D V I_{\min}}{N D V I_{\max}-N D V I_{\min}}\right)^2$ (4)
where, NDVImin and NDVImax represent the minimum and maximum NDVI values observed within the study area for each respective acquisition year, used to normalize PV to the interval [0, 1]. For this study, NDVImin and NDVImax were determined empirically from each Landsat scene rather than using fixed global thresholds in order to account for inter-annual variability in phenological and atmospheric conditions.
Third, LSE (ε) was estimated as a linear function of PV following the parameterization [34]:
$986.0+\Lambda d \times 500.0=3$ (5)
The empirical intercept of 0.986 and the slope coefficient of 0.004 were derived from regression analysis that relates broadband emissivity to fractional vegetation cover across various land [34], representing land surface types, representing a weighted composite of bare soil emissivity (~0.986) and the incremental emissivity contribution of vegetation cover.
LST was calculated from the emissivity-corrected brightness temperature using the following equation:
$L S T=\frac{B T}{1+\left(\frac{\lambda \times B T}{\rho}\right) \times \ln (\varepsilon)}$ (6)
where, LST = land surface temperature (℃); BT = at-sensor brightness temperature (℃); λ = effective wavelength of emitted thermal radiance for Band 10 (10.895 µm); and ρ = h·c/σB = 1.4388 × 10⁻² m·K = 14,388 µm·K, in which h = Planck's constant (6.626 × 10⁻³⁴ J·s), c = speed of light in vacuum (2.998 × 10⁸ m·s⁻¹), and σB = Boltzmann constant (1.381 × 10⁻²³ J·K⁻¹).
2.5 Urban Heat Island Intensity classification
To enable a fair comparison of the spatial distribution of the UHI intensity of the three years under evaluation without being affected by differences in LST absolute values, the five UHI intensities examined were classified according to relative thresholds calculated as a function of both the annual mean (μ) and the annual standard deviation (σ) of the LST. The method employed is in line with Chen et al. [28], although it corrects for interannual differences in absolute LST values, thus making it possible to analyze the correspondence in the spatial distribution of the UHI levels between the 3 years under consideration. The classification thresholds and their interpretation are summarized in Table 2.
Table 2. Urban Heat Island (UHI) intensity classification thresholds and physical interpretations
|
UHI Category |
Standardized Threshold |
Physical Interpretation |
|
Very Low |
LST < μ − σ |
Natural cooling zones (dense forest, open water bodies) |
|
Low |
μ − σ ≤ LST < μ − 0.5σ |
Vegetated areas with moderate cooling capacity |
|
Moderate |
μ − 0.5σ ≤ LST < μ + 0.5σ |
Mixed land use; transitional thermal conditions |
|
High |
μ + 0.5σ ≤ LST < μ + σ |
Sub-urban built-up areas; reduced vegetation cover |
|
Very High |
LST ≥ μ + σ |
Urban thermal hotspots; dense impervious surfaces |
It is important to note that because this classification employs year-specific relative thresholds, the boundaries between categories shift with each observation year in accordance with the annual LST distribution. Consequently, changes in the spatial extent of each UHI category between years reflect genuine redistribution of relative thermal intensity rather than changes in fixed absolute temperature ranges. The Natural Breaks (Jenks) algorithm was additionally applied as a complementary method for cartographic visualization purposes only, to produce maps that capture the natural clustering structure of the LST data distribution for each year.
2.6 Spatial autocorrelation analysis
The Moran index serves to detect the presence or absence of spatial autocorrelation in data globally. The value of this index ranges from −1 < I < 1 with a standardized spatial weight matrix. A negative value (−1 < I < 0) indicates negative spatial autocorrelation or a dispersive pattern, while a positive value (0 < I < 1) indicates positive spatial autocorrelation or a clustered pattern. If the value is close to zero, it means that no spatial pattern has been formed. To calculate spatial autocorrelation, one commonly used method is the Moran Index, which can be formulated through a mathematical equation as stated in previous studies [27, 28, 35]. The spatial unit consisted of 30 m × 30 m raster grid cells derived from Landsat-based LST pixels. A queen-contiguity spatial weights matrix was applied to define neighborhood relationships among adjacent grid cells in the Global Moran’s I analysis. Global Moran's I (I) was computed to quantify the overall degree of spatial autocorrelation in the LST distribution across the study area for each observation year:
$I=\frac{n}{\sum_i \sum_j w_{i j}} \times \frac{\sum_i \sum_j w_{i j}\left(x_i-\bar{x}\right)\left(x_j-\bar{x}\right)}{\sum_i\left(x_i-\bar{x}\right)^2}$ (7)
where, I = Global Moran's Index; n = total number of grid cells; wᵢⱼ = element of the queen-contiguity spatial weights matrix for cells i and j; xᵢ and xⱼ = mean LST values at cells i and j, respectively; and x̄ = global mean LST across all cells.
Moran's I values range from −1 to +1:
I > 0 → positive spatial autocorrelation (clustered pattern)
I < 0 → negative spatial autocorrelation (dispersed pattern)
I ≈ 0 → random spatial distribution
2.7 Spatial association analysis between Land Use/Land Cover and Urban Heat Island
To analyze the spatial relationship between the LULC types and UHI intensity classes, a post-classification cross-tabulation analysis was performed using the Tabulate Area tool in ArcGIS10.8. A cross-tabulation matrix was produced for each year of observation to assess the distribution of LULC classes across different UHI intensity classes. Temporal trend analysis (2014-2019-2024) was undertaken to identify systematic changes in the LULC-UHI spatial association over the decade-long study period.
3.1 Land use change dynamics (2014-2024)
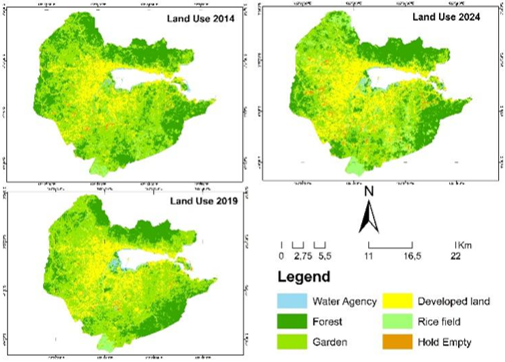
Table 3 and Figure 2 show the respective changes in LULC across Kendari City between 2014 and 2024. The corresponding LULC classified images were subjected to standardization by class-area normalization across the constant administrative boundary of Kendari City, which accounts for the slight change between images in usable pixels due to cloud masking and the variability in the water-body boundary across dry-season image acquisitions.
Table 3. Land use changes in 2014, 2019, 2024
|
LULC Class |
2014 (ha) |
2019 (ha) |
2024 (ha) |
Net Change 2014–2024 (ha) |
Relative Change (%) |
Share Change (pp) |
|
Water Bodies |
231.20 |
284.30 |
251.20 |
+20.00 |
+8.65 |
+0.07 |
|
Forest |
7870.04 |
6421.42 |
7130.34 |
−739.70 |
−9.40 |
−2.79 |
|
Garden/Plantation |
12611.80 |
12907.91 |
9815.94 |
−2795.86 |
−22.17 |
−10.52 |
|
Built-up Land |
4330.30 |
5163.61 |
6027.26 |
+1696.96 |
+39.19 |
+6.39 |
|
Rice Fields |
2765.40 |
1490.87 |
1226.51 |
−1538.89 |
−55.65 |
−5.79 |
|
Vacant Land |
321.98 |
323.72 |
601.69 |
+279.71 |
+86.87 |
+1.05 |
|
Total |
26591.83 |
26591.83 |
26591.83 |
|
|
|
Figure 2. Land use changes in 2014, 2019, 2024
The biggest increase was in the land covered by built-up areas, which grew from 4,330.30 ha (16.28%) in 2014 to 6,027.26 ha (22.67%) in 2024, for a total increase of 1,696.96 ha (+39.19%) over 10 years. That said, the rise was of a similar scale in the two sub-periods (2014/2019: +833.31 ha; 2019/2024: +863.65 ha) meaning that urbanization pressure occurred at a steady rate throughout this period (Figure 2).
This also applies to rice fields, which decreased from 2,765.40 ha (10.40%) in 2014 to 1,226.51 ha (4.61%) in 2024, a decrease of 1,538.89 ha (−55.65%). On the other hand, the area occupied by gardens and plantations in the city decreased from 12,611.80 ha (47.43%) to 9,815.94 ha (36.91%), or a decrease of 2,795.86 ha (−22.2%). This decline indicates the conversion of plantation and mixed-use agricultural lands into urban and transitional land-use categories during that decade.
The forest cover in this region has fluctuated over the years. The forest cover here was 7,870.04 ha in 2014 and reduced to 6,421.42 ha in 2019, resulting in a loss of 1,448.62 ha (−18.4%). Forest cover in the region has partially recovered to 7,130.34 ha in 2024 (+11.0% or +708.92 ha), although in the entire period of observation the net change in forest cover was still -739.70 ha (−9.4%). This may be due to temporary land clearing with partial regrowth of vegetation in peri-urban areas.
From 2014 to 2024, vacant land increased from 321.98 ha (1.21%) to 601.69 ha (2.26%), with a net increase of 279.71 ha (+86.9%). The majority of this increase occurred in 2019 to 2024. This is typical of transitional land development and fragmented urbanization in rapidly growing secondary cities.
The area of water remained relatively stable during the study period, increasing from 231.20 ha (0.87%) in 2014 to 251.20 ha (0.94%) in 2024, for a net increase of 20.00 ha (+8.7%). Areas with retention ponds, aquaculture areas and seasonal hydrological variability in coastal and lowland areas are the most likely causes for the slight increase in water.
3.2 Spatial-temporal variations in land surface temperature
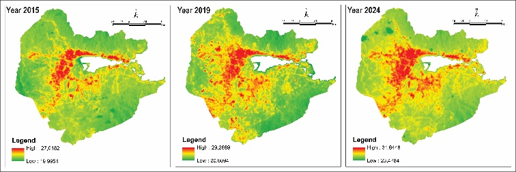
LST analysis reveals a sustained and substantial thermal increase across Kendari City throughout the 2014–2024 decade. The statistical summary of LST distribution for each observation year is presented in Table 4, and the corresponding spatial distributions are spatial analysis (Figure 3).
Table 4. Statistical summary of land surface temperature (LST) in Kendari City (2014–2024)
|
Year |
LST min (℃) |
LST max (℃) |
LST mean (℃) |
LST σ (℃) |
Range (℃) |
|
2014 |
19.99 |
27.02 |
23.51 |
1.42 |
7.03 |
|
2019 |
20.61 |
29.27 |
24.93 |
1.68 |
8.66 |
|
2024 |
23.48 |
31.64 |
27.56 |
1.86 |
8.16 |
|
Δ2014–2024 |
+3.49 |
+4.62 |
+4.05 |
+0.44 |
+1.13 |
Figure 3. Land surface temperature (LST) 2014, 2019, 2024
The maximum LST increased progressively from 27.02 ℃ (2014) to 29.27 ℃ (2019) and further to 31.64 ℃ (2024), corresponding to a cumulative decadal increase of +4.62 ℃. The rate of maximum LST increase was slightly higher during the second sub-period (+2.37 ℃ during 2019–2024) compared with the first (+2.25 ℃ during 2014–2019), suggesting an accelerating warming trend consistent with the intensification of built-up land expansion observed in the same period. Mean LST increased by +4.05 ℃ over the decade, from 23.51 ℃ to 27.56 ℃, while minimum LST rose by +3.49 ℃ indicating that even the coolest surfaces within the study area experienced substantial warming.
The LST range generally expanded over the study period, although a slight decline occurred between 2019 and 2024. Meanwhile, the rising standard deviation (from 7.03 ℃ in 2014 to 8.16 ℃ in 2024) and the rising standard deviation (from 1.42 to 1.86) indicates increasing thermal heterogeneity over time. This pattern reflects a dual process: simultaneous intensification of thermal hotspots in built-up areas and moderate warming of previously cooler vegetated zones a condition consistent with the concept of thermal landscape polarization described.
Spatial analysis (Figure 4) demonstrates that the highest LST values are consistently concentrated in commercial and high-density residential areas, particularly in the sub-districts of Kadia, Wua-Wua, and West Kendari, where built-up density is greatest. Conversely, lower LST values persist in the Nipa-Nipa protected forest area and along riparian and coastal corridors; however, the spatial extent of these cooler zones, contracted substantially over the observation period, as illustrated by the progressive expansion of warm-colored areas in the temporal LST maps.
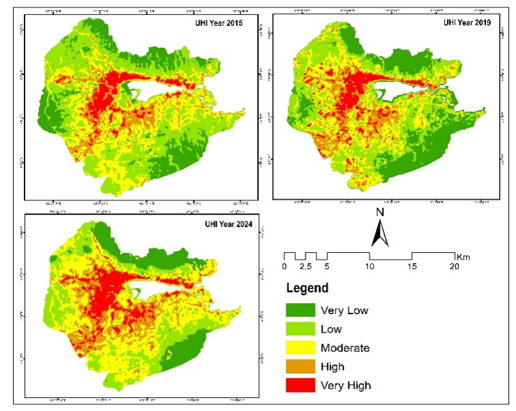
Figure 4. Urban Heat Island (UHI) distribution in 2014, 2019, 2024
3.3 Urban Heat Island distribution patterns and intensification
The spatial distribution and temporal evolution of UHI intensity across Kendari City are summarized in Table 5 and illustrated in Figure 4. Three principal findings emerge from this analysis.
Table 5. Urban Heat Island (UHI) category distribution (2014-2024)
|
UHI Class |
2014 (ha) |
2019 (ha) |
2024 (ha) |
Net Change (ha) |
Relative Change (%) |
Share Change (pp) |
|
Very Low |
4519.88 |
5898.94 |
3695.81 |
−824.07 |
−18.23 |
−3.10 |
|
Low |
10285.92 |
7827.06 |
5629.43 |
−4656.49 |
−45.27 |
−17.51 |
|
Moderate |
6732.94 |
6367.09 |
9227.85 |
+2494.91 |
+37.06 |
+9.38 |
|
High |
3374.99 |
4440.84 |
5081.29 |
+1706.30 |
+50.56 |
+6.42 |
|
Very High |
1678.10 |
2057.90 |
2957.45 |
+1279.35 |
+76.24 |
+4.81 |
|
Total |
26591.83 |
26591.83 |
26591.83 |
|
|
|
Source: 2025 analysis results.
The distribution of UHI intensity in Kendari City from 2014 to 2024 in Table 5 shows that the distribution area of very high UHI intensity class in Kendari City is experiencing an important increase in the last 10 years. The area of the very high intensity class increased from 1,678.10 ha (6.31%) in 2014 to 2,957.45 ha (11.12%) in 2024, an increase of 1,279.35 ha (+76.2%). Meanwhile, the area occupied by the high UHI class also increased, from 3,374.99 ha (12.69%) to 5,081.29 ha (19.11%), a net gain of 1,706.30 ha (+50.6%).
The lower temperature classes all shrunk in area, with the very low UHI class showing a decrease from 4,519.88 ha (17.00%) in 2014 to 3,695.81 ha (13.90%) in 2024 (824.07 ha (−18.2%)). The low UHI class also shrunk in area, from 10,285.92 ha (38.68%) to 5,629.43 ha (21.17%) (4,656.49 ha (−45.3%)).
The same was seen in the moderate class UHI, which increased from 6732.94 ha (25.32%) in 2014 to 9227.85 ha (34.70%) in 2024, an increase of 2494.91 ha (37.1%). The class increase of UHI from low class to moderate class is caused by high thermal pressure from rapid urbanization and land use change in Kendari City during the last 10 years.
The results showed that the thermal range of Kendari City had changed from a low classification to a moderate to high thermal classification. In the current conditions of Kendari City, the distribution of high and very high UHI classes is increasingly common and tends to be concentrated in urban areas. Meanwhile, the drastic deterioration of the very low UHI class indicates the gradual disappearance of natural cooling areas such as vegetated surfaces and open land due to the spread of urbanization in Kendari City. Accordingly, it can be concluded that the urban thermal environment of Kendari has become much warmer and mostly concentrated in the higher-intensity UHI category between 2014 and 2024.
3.4 Spatial autocorrelation analysis
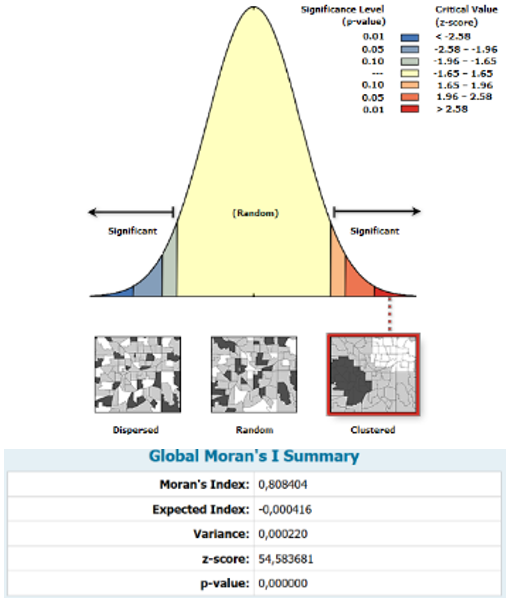
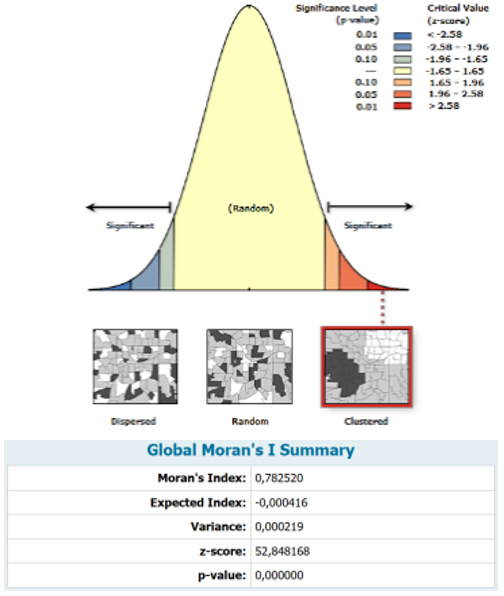
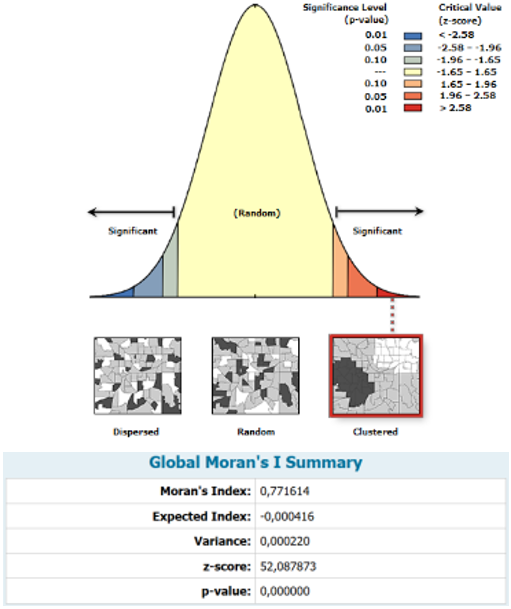
The Moran's I Global Analysis Indicator shows that the phenomenon of UHI is clustered spatially and statistically meaningful in all three years, as shown in Table 6. In addition, the size of the Moran's I index gradually increases, from 0.7716 in 2014 to 0.7825 in 2019 and 0.8084 in 2024. This trend confirms an increasing degree of cluster formation. All the measurement indices under consideration have a p-value < 0.01 and z-scores > 52, indicating a spatial non-random pattern in the representation of each category. The spatial randomness null hypothesis was rejected for all observation years, with statistically meaningful positive spatial autocorrelation and clustered distribution of UHI in Kendari City.
Table 6. Distribution of spatial autocorrelation of global Urban Heat Island (UHI) Moran’s I
|
Year |
Spatial Autocorrelation |
Description |
|
2024 |
Moran's I index value: 0.808404 Within the range 0 > I > 1, indicating positive autocorrelation
Hypothesis Test (ZI = Z1-a) Z(I) = 54.583681 > Z0.9 H0 rejected
Significance level < 0.01 Indicates a clustered pattern |
|
|
2019 |
Moran's I index value: 0.782520 Within the range 0 > I > 1, indicating positive autocorrelation
Hypothesis Test (ZI = Z1-a) Z(I) = 52.848168 > Z0.9 H0 rejected
Significance level < 0.01 Indicates a clustered pattern |
|
|
2014 |
Moran's I index value: 0.771614 Within the range 0 > I > 1, indicating positive autocorrelation
Hypothesis Test (ZI = Z1-a) Z(I) = 52.087873 > Z0.9 H0 rejected
Significance level < 0.01 Indicates a clustered pattern |
Source: 2025 analysis results.
The increasing Moran's I value indicates that the UHI phenomenon is not only becoming more intense but also more spatially concentrated. High temperature clusters are expanding and merging, while low temperature areas are becoming more isolated and fragmented. This pattern reflects the consolidation of urban development and the reduction of the remaining green space buffer capacity. The relatively similar z-scores across observation years are attributable to the consistently large raster sample size and the stable spatial dependence structure of the urban thermal field. Because Moran’s I statistics were calculated using raster-based spatial units with identical spatial resolution and weighting schemes across all years, the resulting z-scores remained consistently high despite temporal variations in thermal intensity and clustering magnitude.
3.5 Correlation between land use and Urban Heat Island effect intensity
Cross-tabulation analysis between LULC classifications and UHI intensity maps reveals strong and systematic spatial associations between specific land-use types and thermal conditions across the three observation years (Table 7). Results are discussed separately for each major LULC category.
Table 7. Correlation between land use and Urban Heat Island effect intensity
|
LULC Class |
Year |
Very Low |
Low |
Moderate |
High |
Very High |
Total (ha) |
|
Water Bodies |
2014 |
23.79 |
88.55 |
92.41 |
25.09 |
1.36 |
231.20 |
|
|
2024 |
1.19 |
38.02 |
158.92 |
46.84 |
6.23 |
251.20 |
|
Forest |
2014 |
2,641.62 |
4,416.21 |
768.13 |
43.75 |
0.32 |
7,870.04 |
|
|
2024 |
2,586.26 |
2,722.32 |
1,745.91 |
74.60 |
1.25 |
7,130.34 |
|
Garden/Plantation |
2014 |
1,635.98 |
5,141.84 |
4,402.65 |
1,258.12 |
173.20 |
1,2611.80 |
|
|
2024 |
634.83 |
2,048.95 |
5,073.19 |
1,796.15 |
262.83 |
9,815.94 |
|
Built-up Land |
2014 |
51.51 |
196.93 |
890.47 |
1,751.07 |
1,440.33 |
4,330.30 |
|
|
2024 |
36.47 |
121.19 |
928.62 |
2,392.31 |
2,548.66 |
6,027.26 |
|
Rice Fields |
2014 |
425.26 |
653.32 |
1,018.98 |
562.08 |
105.76 |
2,765.40 |
|
|
2024 |
160.21 |
405.03 |
410.89 |
200.37 |
50.01 |
1,226.51 |
|
Vacant Land |
2014 |
6.76 |
37.36 |
168.39 |
96.59 |
12.88 |
321.98 |
|
|
2024 |
11.80 |
45.63 |
302.22 |
209.31 |
32.72 |
601.69 |
Source: 2025 analysis results.
Built-up land had the highest level of spatial association with very high UHI intensity among all LULC classes. In 2014, 33.3% (1,440.33 ha) of built-up land fell under very high UHI, while in 2024, the proportion of very high UHI intensity built-up land increased to 42.3% (2,548.66 ha). On the other hand, the share of built-up land area in the very low UHI class decreased from 1.2% (51.51 ha) in 2014 to 0.6% (36.47 ha) in 2024. The share of high and very high UHI class increased from 73.7% in 2014 to 81.9% in 2024. This means that most of the built-up areas experienced progressive thermal intensification during the study period.
Despite the increasing thermal effects, forests can still provide a cooling service and in 2014 the very low UHI class covered 33.6% (2,641.62 ha) of all forest cover, indicating their importance in reducing the heat island effect. Low UHI conditions continue to dominate in 2024, accounting for nearly 38.2% (2,722.32 ha) of vegetated landscapes within the forest. The area of moderate UHI conditions within the forest has more than doubled to 1,745.91 ha. The high and very high UHI categories have also increased from 2014's 44.07 ha to 2024's 75.85 ha, revealing a gradual thermal encroachment of peri-urban forests.
The garden and plantation areas largely fell in the low and moderate UHI classes in 2014, with the low UHI class occupying 40.8% (5,141.84 ha) and the moderate UHI 34.9% (4,402.65 ha). In 2024, the moderate UHI class predominated, covering 51.7% (5,073.19 ha) of plantation area. Concurrently, the share of high and very high UHI classes also increased from 11.4% in 2014 to 20.9% in 2024, showing that thermal exposure of plantation and mixed agricultural areas increased with urbanization and LULC change over the decade.
Vacant land was also subject to thermal intensification. In 2014, 4.0% (12.88 ha) of vacant land was classified as having very high UHI, while 30.0% (96.59 ha) was classified as having high UHI. The very high UHI category increased to 5.4% (32.72 ha), high UHI category increased to 34.8% (209.31 ha) and moderate UHI conditions increased from 168.39 ha to 302.22 ha. This suggests that the vacant land became a transitional thermal hotspot which persisted through land clearing and pre-development procedures.
The cooling effectiveness of water bodies gradually weakened over the decade, with 10.3% (23.79 ha) of water bodies in 2014 classified as very low UHI. Low UHI conditions decreased from 38.3% (88.55 ha) in 2014 to 15.1% (38.02 ha) in 2024 of the water bodies to Very low UHI conditions decreased from 10.3% (23.79 ha) in 2014 to 0.5% (1.19 ha) in 2024. The percentage of the water bodies under the category 'moderate UHI' increased from 40.0% (92.41 ha) to 63.3% (158.92 ha), showing that thermal exposure is increasing in these environments. The high and very high categories also increased, indicating the cooling effects of water bodies are being increasingly suppressed by surrounding urban thermal amplification and elevated surface ambient air temperatures.
The results suggest a thermal homogenization effect, where a rapid increase in urbanization is associated with an increase in the thermally intensive built-up area, and changes to the thermal regime of co-existing land use types such as forests, water bodies, and agricultural land. This presents an important challenge for urban climate resilience and thermal comfort in Kendari City.
Land cover and land use due to rapid urbanization (2014 to 2024) have had an important impact on UHI intensification. The rapid urban land use growth caused an increase in surface LST and the spatial distribution of thermal hotspots in densely populated subdistricts in Kendari City. These observations are highly consistent with the assumptions of UHI theory that urban warming occurs due to removal of vegetated surfaces and replacing them with impervious surfaces, resulting in decreased evapotranspiration, increased thermal mass and increased anthropogenic heat build-up [1, 2, 4]. The findings also indicate that urbanization-induced land-use changes are an important driver of developing UHI in Kendari, given the high LST values in densifying areas.
The increased magnitude of UHI in Kendari City can be explained using the classical theory of UHI proposed by Oke [1] and further elaborated by Voogt and Oke [2]. This theory involves the alteration of the energy balance of the urban micro-climate caused by changing land surface cover. In addition, when vegetation is replaced by built structures, it reduces evapotranspiration and the release of latent heat, which provides natural cooling in urban areas. For example, asphalt and concrete have a low albedo and high heat storage capacity, and thus they can absorb and retain solar energy during the day. Additionally, anthropogenic heat flux from urban activities such as the traffic intensity and energy consumption in buildings also increases urban temperature. The higher LST of the densely populated districts in Kendari is caused by the loss of the cooling function of vegetation and the strengthened heat storage and anthropogenic heat emissions within the canopy layer of the urban area.
Furthermore, the increase in Moran’s I indicates stronger spatial concentration of thermal hotspots over time, suggesting that high-temperature zones are becoming increasingly clustered within continuously urbanized areas. This finding is consistent with the urban thermal concentration hypothesis, whereby rapid urbanization promotes the spatial consolidation of heat accumulation as impervious surfaces become dominant within the urban landscape. This finding is consistent with the urban thermal concentration hypothesis, whereby active urbanization leads to a continuous chain of thermal hotspots as imperviousness becomes the dominant land cover in the local urban setting [1, 2]. Similar patterns of spatial thermal coalescence have been reported for rapidly urbanizing cities, such as Guangzhou, China [7], and Delhi, India [6], where built-up land expansion was associated with spatial coalescence of thermal hotspot areas and increased fragmentation of urban cooling areas. In Kendari, the loss of areas of vegetated and open-land patches appears to have weakened the spatial continuity of natural cooling systems and, in turn, contributed to an accumulation of heat in urban centers and development corridors.
Relative to other cities in Asia experiencing rapid urbanization, the increase in overall UHI in Kendari between 2014 and 2024 is relatively high, and relative to studies from Guangzhou [7], Delhi [6], and Harbin [22], the results suggest that secondary tropical cities may be particularly sensitive to a rapid thermal response under unstructured urbanization conditions. It has been suggested that the city's bay-enclosed landscape may limit ventilation by the atmosphere, thus trapping warm air masses within the urban canopy layer, as compared to open-plan urban centers [1, 2]. Second, the fragmented, market-driven urbanization of Kendari city, combined with limited application of climate-adaptive spatial planning and urban thermal mitigation strategies, may have contributed to the development of irregular urban morphology, low sky view factor, and meaningful longwave radiation trapping in highly built-up areas [19, 20]. Third, the limited extent and spatial fragmentation of green infrastructure restrict the effectiveness of evapotranspirative cooling and ecological buffering at the city scale. In line with previous studies, secondary cities with rapid urbanization, low topographical relief, weak spatial planning controls, and limited capacity for green infrastructure are particularly vulnerable to accelerated UHI intensification.
The findings of this study highlight the important ecological role of agricultural land, urban vegetation, and water bodies as natural thermal regulators within Kendari City’s urban landscape. The substantial reduction in rice fields and plantation areas during the 2014–2024 period indicates not only land-cover transformation but also the progressive loss of urban thermal buffering capacity. Rice fields, in particular, are good at cooling because standing water and thick vegetation support continuous evapotranspiration processes that keep surface temperatures lower than those of impervious urban materials [36]. However, the results suggest that the cooling effectiveness of these landscapes has become increasingly weakened as agricultural and vegetated areas are progressively enclosed and fragmented by expanding built-up development. This condition reflects the gradual degradation of the “urban cooling island” function, where formerly connected green and blue spaces become isolated within a warmer urban thermal matrix. The decline in the thermal performance of remaining forest and water-body areas further indicates that the effectiveness of urban ecological cooling systems depends not only on total area coverage, but also on spatial connectivity, landscape continuity, and protection from surrounding thermal pressure. These findings demonstrate that fragmented green spaces embedded within dense urban environments may no longer provide sufficient cooling benefits to offset the accelerating thermal accumulation associated with rapid urbanization.
In addition to biophysical features, UHI in Kendari City has an impact on public health, urban energy demand, hydrology, and urban sustainability. Rising surface air temperature in urban areas will increase the risk of exposure to heat stress and cause an increase in energy demand for cooling, surface runoff, and the risk of flooding due to the continuous formation of impervious areas. The study findings indicate that climate responsive spatial planning, urban green infrastructure and blue green corridor development should be integrated into future urbanization strategies. Furthermore, from a scientific perspective, the study contributes to the literature on UHI in tropical secondary cities through successfully integrating multi-temporal analysis of LULC change, satellite-based LST retrieval, and spatial autocorrelation within a single modeling framework. The findings therefore provide an empirical basis for supporting Sustainable Development Goal (SDG) 11 on sustainable cities and SDG 13 on climate action, while also offering spatially explicit evidence that can inform the revision of Kendari’s urban spatial planning and climate adaptation policies.
Several methodological limitations should be acknowledged when interpreting the findings of this study. First, the analysis is based on observational remote sensing data and spatial statistical associations; therefore, the identified relationships between land-use change and UHI intensification should be interpreted as associational rather than strictly causal. Establishing causal thermal mechanisms would require process-based atmospheric simulations, such as WRF-Urban modelling, capable of incorporating atmospheric circulation, wind dynamics, and surface energy exchange processes. Second, all satellite observations were acquired during the dry season to minimize cloud contamination, which may limit the representation of seasonal thermal variability under wet-season conditions. Third, the 30 m spatial resolution of Landsat imagery may not fully capture fine-scale thermal heterogeneity associated with individual buildings, narrow street canyons, or small urban green spaces. In addition, although ground-truth points were used for LULC classification validation, no in-situ surface temperature measurements were available to directly validate satellite-derived LST estimates. Future studies are therefore encouraged to integrate higher temporal resolution datasets, field-based thermal observations, and advanced urban climate modelling approaches to improve the understanding of long-term UHI dynamics in rapidly growing tropical cities.
The findings of this study indicate that the rapid and dispersed urbanization process in Kendari City has led to the intensification and consolidation of UHI patterns between 2014 and 2024. The study highlights the importance of maintaining connectivity in vegetation, preserving agricultural land, and implementing an integrated blue-green infrastructure strategy to improve urban thermal resilience in rapidly developing tropical secondary cities. These findings provide strong empirical support for climate sensitive spatial planning and urban adaptation policies, and highlight the need for more predictive and process-based modeling approaches that account for the long-term behavior of the urban thermodynamic system under continued urbanization and climate change.
[1] Oke, T.R. (1982). The energetic basis of the urban heat island. Quarterly Journal of the Royal Meteorological Society, 108(455): 1-24. https://doi.org/10.1002/qj.49710845502
[2] Voogt, J.A., Oke, T.R. (2003). Thermal remote sensing of urban areas. Remote Sensing of Environment, 86(3): 370-384. https://doi.org/10.1016/S0034-4257(03)00079-8
[3] Amani, M.J., Tanzadeh, R., Moghadas Nejad, F., Kabiri Nasrabad, M.M., Chalabii, J., Movahedi Rad, M. (2025). Urban sustainability through pavement technologies: Reducing urban heat islands with cool pavements. Buildings, 15(3): 504. https://doi.org/10.3390/buildings15030504
[4] Cheela, V.S., John, M., Biswas, W., Sarker, P. (2021). Combating urban heat island effect—A review of reflective pavements and tree shading strategies. Buildings, 11(3): 93. https://doi.org/10.3390/buildings11030093
[5] Luan, Y., Huang, G., Zheng, G. (2023). Spatiotemporal evolution and prediction of habitat quality in Hohhot city of China based on the InVEST and CA-Markov models. Journal of Arid Land, 15(1): 20-33. https://doi.org/10.1007/s40333-023-0090-8
[6] Shahfahad, Talukdar, S., Rihan, M., Hang, H.T., Bhaskaran, S., Rahman, A. (2021). Modelling urban heat island (UHI) and thermal field variation and their relationship with land use indices over Delhi and Mumbai metro cities. Environment, Development and Sustainability, 24: 3762-3790. https://doi.org/10.1007/s10668-021-01587-7
[7] Xiang, X., Zhai, Z., Fan, C., Ding, Y., Ye, L., Li, J. (2024). Modelling future land use land cover changes and their impacts on urban heat island intensity in Guangzhou, China. Journal of Environmental Management, 366: 121787. https://doi.org/10.1016/j.jenvman.2024.121787
[8] Xiong, L., Shan, X., Fang, X., Li, S. (2024). Simulation and prediction of urban heat island effect driven by land use change: A case of Changsha-Zhuzhou-Xiangtan region. Research Square [Preprint]. https://doi.org/10.21203/rs.3.rs-5279178/v1
[9] Zhang, M., Tan, S., Zhang, C., Chen, E. (2024). Machine learning in modelling the urban thermal field variance index and assessing the impacts of urban land expansion on seasonal thermal environment. Sustainable Cities and Society, 106: 105345. https://doi.org/10.1016/j.scs.2024.105345
[10] Laode, A., Yusuf, M., Rahman, S. (2022). Urban heat island effect in Kendari City: Analysis of land use and microclimate variation. IOP Conference Series: Earth and Environmental Science, 1098(1): 012054. https://doi.org/10.1088/1755-1315/1098/1/012054
[11] Raya, A., Hasibuan, H. (2020). Spatial patterns of land surface temperature in Jakarta and its surrounding areas. IOP Conference Series: Earth and Environmental Science, 448: 012086. https://doi.org/10.1088/1755-1315/448/1/012086
[12] Hanani, N., Riniwati, H., Leksono, A.S., Baja, S. (2024). The impact of land use change on land surface temperature 1990-2020 for environmental monitoring in Kapota Island, Wakatobi Regency, Indonesia. International Review for Spatial Planning and Sustainable Development, 12(2): 43. https://doi.org/10.14246/irspsd.12.2_43
[13] Andrés López, G.J.L. (2023). Recent transformations in the morphology of Spanish medium-sized cities: From the compact city to the urban area. Land, 12(7): 1276. https://doi.org/10.3390/land12071276
[14] Guan, C., Wang, Y., Keith, M., Li, Y., Cao, G. (2022). Does local planning of fast-growing medium-sized towns lead to higher urban intensity or to sprawl? Cases from Zhejiang Province. Cities, 130: 103869. https://doi.org/10.1016/j.cities.2022.103869
[15] Long, H., Zhang, Y., Ma, L., Tu, S. (2021). Land use transitions: Progress, challenges and prospects. Land, 10(9): 903. https://doi.org/10.3390/land10090903
[16] Hadini, L.O., Alfat, S., Uslinawaty, Z., Mokui, H.T., Aris, A. (2025). Spatio-temporal characteristics of UHI in coastal urban area and its impact on land unit: A case study in the Southeast Sulawesi Province, Indonesia. International Journal of Geoinformatics, 21(2): 123-140. https://doi.org/10.52939/ijg.v21i2.3945
[17] Jiang, H., Guo, H., Sun, Z., et al. (2022). Projections of urban built-up area expansion and urbanization sustainability in China's cities through 2030. Journal of Cleaner Production, 367: 133086. https://doi.org/10.1016/j.jclepro.2022.133086
[18] Morar, C., Lukić, T., Valjarević, A., et al. (2022). Spatiotemporal analysis of urban green areas using change detection: A case study of Kharkiv, Ukraine. Frontiers in Environmental Science, 10: 823129. https://doi.org/10.3389/fenvs.2022.823129
[19] Tian, P., Li, J., Cao, L., Pu, R. (2021). Assessing spatiotemporal characteristics of urban heat islands from the perspective of an urban expansion and green infrastructure. Sustainable Cities and Society, 74: 103208. https://doi.org/10.1016/j.scs.2021.103208
[20] Assaf, G., Assaad, R. (2024). Modeling the impact of land use/land cover (LULC) factors on diurnal and nocturnal urban heat island (UHI) intensities using spatial regression models. Urban Climate, 55: 101971. https://doi.org/10.1016/j.uclim.2024.101971
[21] Chen, Y. (2023). Spatial autocorrelation equation based on Moran’s index. Scientific Reports, 13(1): 19296. https://doi.org/10.1038/s41598-023-45947-x
[22] Li, S., Yang, X., Cui, P., Sun, Y., Song, B. (2024). Machine-learning-algorithm-based prediction of land use/land cover and land surface temperature changes to characterize the surface urban heat island phenomena over Harbin, China. Land, 13(8): 1164. https://doi.org/10.3390/land13081164
[23] Muhibuddin, A., Latief, R. (2025). Analisis spasial temporal hubungan LST dan NDVI terhadap pembentukan urban heat island di Kota Kendari. Geodika: Jurnal Kajian Ilmu dan Pendidikan Geografi, 9(3): 299-308. https://doi.org/10.29408/geodika.v9i3.31052
[24] Aris, A., Syaf, H., Yusuf, D.N., Nurgiantoro. (2019). Analysis of urban heat island intensity using multi temporal Landsat data; case study of Kendari City, Indonesia. IOP Conference Series: Earth and Environmental Science, 389(1): 012002. https://doi.org/10.1088/1755-1315/389/1/012002
[25] Nurgiantoro, Usman, I., Bahdad, et al. (2023). Landscape composition and its effect on the urban thermal environment in Kendari City. IOP Conference Series: Earth and Environmental Science, 1276(1): 012027. https://doi.org/10.1088/1755-1315/1276/1/012027
[26] Husen, O.O., Ishak, A., Tiro, A.H., et al. (2026). Mitigating urban heat island effects via spatial planning integration and optimization of urban green spaces and built-up density in Southeast Sulawesi. International Journal of Geoinformatics, 22(2): 139-152. https://doi.org/10.52939/ijg.v22i2.4797
[27] Chen, Y. (2021). An analytical process of spatial autocorrelation functions based on Moran’s index. PLoS ONE, 16(4): e0249589. https://doi.org/10.1371/journal.pone.0249589
[28] Chen, Z., Lin, X., Li, M., et al. (2023). Spatio-temporal dynamic characteristics and landscape connectivity of heat islands in Xiamen in the face of rapid urbanization. Sustainability, 15(19): 14603. https://doi.org/10.3390/su151914603
[29] Jiang, Y., Lin, W. (2021). A comparative analysis of retrieval algorithms of land surface temperature from Landsat-8 data: A case study of Shanghai, China. International Journal of Environmental Research and Public Health, 18(11): 5659. https://doi.org/10.3390/ijerph18115659
[30] Qi, Y., Zhong, L., Ma, Y., Fu, Y., Wang, X., Li, P. (2023). Estimation of land surface temperature over the Tibetan Plateau based on Sentinel-3 SLSTR data. IEEE Journal of Selected Topics in Applied Earth Observations and Remote Sensing, 16: 4180-4194. https://doi.org/10.1109/JSTARS.2023.3268326
[31] Albakri, N.A., Al-Ruzouq, R., Shanableh, A., et al. (2022). Estimating land surface temperature to study land use land cover influence on the temperature in a city with a dry arid climate. IOP Conference Series: Earth and Environmental Science, 1064(1): 012023. https://doi.org/10.1088/1755-1315/1064/1/012023
[32] Hu, J., Fu, Y., Zhang, P., et al. (2021). Satellite retrieval of microwave land surface emissivity under clear and cloudy skies in China using observations from AMSR-E and MODIS. Remote Sensing, 13(19): 3980. https://doi.org/10.3390/rs13193980
[33] Nie, J., Ren, H., Zheng, Y., Ghent, D., Tansey, K. (2021). Land surface temperature and emissivity retrieval from nighttime middle-infrared and thermal-infrared Sentinel-3 images. IEEE Geoscience and Remote Sensing Letters, 18(5): 915-919. https://doi.org/10.1109/LGRS.2020.2986326
[34] Sobrino, J.A., Jiménez-Muñoz, J.C., Paolini, L. (2004). Land surface temperature retrieval from Landsat TM 5. Remote Sensing of Environment, 90(4): 434-440. https://doi.org/10.1016/j.rse.2004.02.003
[35] Westerholt, R.J.G.A. (2023). A simulation study to explore inference about global Moran’s I with random spatial indexes. Geographical Analysis, 55(4): 621-650. https://doi.org/10.1111/gean.12349
[36] Liu, F., Zhang, X., Murayama, Y., Morimoto, T. (2020). Impacts of land cover/use on the urban thermal environment: A comparative study of 10 megacities in China. Remote Sensing, 12(2): 307. https://doi.org/10.3390/rs12020307