Fredi Andria* | Mega Triani | Eneng Tita Tosida | Jumadil Saputra | Enok Rusmanah | Nisa Rahmaniyah Utami
© 2026 The authors. This article is published by IIETA and is licensed under the CC BY 4.0 license (http://creativecommons.org/licenses/by/4.0/).
OPEN ACCESS
Technological advancements in the tourism sector stemming from the Industrial Revolution 4.0 have become a benchmark for regional destination development, aligning closely with the principles of an inclusive green economy. However, various regional tourism destinations have not fully implemented inclusive digital technologies, facing challenges such as suboptimal infrastructure, unequal information distribution, and hindered tourist mobility. This study focuses on mapping potential tourist objects across 10 regional Tourist Objects and Attractions (TOAs) and formulating tailored Tourism 4.0 development strategies. The study employs a quantitative data-mining approach, using the K-means clustering algorithm in RStudio to analyze primary survey data collected from 100 tourists. The algorithm yielded three distinct clusters based on visitor perceptions. The conceptual novelty of this research lies in utilizing these cluster characteristics to prescribe specific digital interventions, such as Virtual Reality (VR), Augmented Reality (AR), and targeted digital tour packages that map directly onto the economic, social, and environmental dimensions of an inclusive green economy. The findings highlight high-potential attractions, including Prawatasari Park, Cibodas Botanical Gardens, Nusantara Flower Garden, Sarongge Tourism Village, and Cianjur Square, providing a practical destination management framework for inclusive, technology-driven, and sustainable regional development.
Tourism 4.0, data mining, inclusive green economy, potential tourist attractions digitalization
Tourism is one of the leading sectors in the global economy, playing a crucial role in driving economic growth, creating jobs, and enhancing national competitiveness [1-5]. According to World Travel & Tourism Council [6], tourism industry is expected to contribute approximately 10% to the global Gross Domestic Product (GDP) and create 357 million jobs worldwide. Tourism also ranks third in terms of its significant contribution to GDP, with an annual growth rate of around 12.1%, and is one of the fastest-growing sectors [7]. Tourism in Indonesia is a leading sector, contributing significantly to GDP, reaching 10.9% by 2024, and employing more than 12.6 million people [8].
This development is also driven by digital technology, which is transforming how tourists plan, experience, and share their travel. This trend is characterized by search and share behavior conducted through digital devices, reaching 70%, from travel planning to post-visit [9-11]. This digitalization in the tourism sector is known as the concept of Tourism 4.0 [12-14]. Indonesia has implemented the concept of Tourism 4.0 to develop its tourism industry and continue to be known internationally [15-17]. Similarly, regional tourism destinations are a pillar of domestic tourism development [18-20].
Tourism in Indonesia’s regions has high potential for continued growth. It is reflected in the large number of tourist visits and the diverse number of attractions available. Data from 2021 show that there are 145 tourist objects and attractions (TOAs), including natural, artificial, cultural, and historical sites [21]. Regarding the implementation of the Tourism 4.0 concept, regional destinations are moving towards incorporating digital technology into various tourism promotional activities. It includes using social media, websites, and applications as large information portals that offer details on various tourist attractions.
However, regional tourism destinations empirically face various obstacles and challenges, primarily related to limited technology-based innovation and the unequal distribution of information. It is because many tourism destination managers have not yet optimized the use of technology in their tourism promotions and operations [18, 22, 23]. Consequently, among the 145 existing tourist attractions, the focus is often on a select few. Other obstacles include suboptimal infrastructure and accessibility issues resulting from inadequate road infrastructure, which also hinder tourist mobility to tourist destinations [24-26].
Another challenge is the stagnant development of destinations due to a lack of innovative attractions and minimal involvement of other local stakeholders [27-29]. These challenges are further compounded when tourism destination managers have not fully adopted digital technologies for tourism management, thereby limiting their potential. Therefore, digital transformation through Tourism 4.0 is a strategic solution. This concept integrates technologies such as VR and AR to enhance management efficiency, expand promotional reach, and provide a more interactive tourism experience [30, 31].
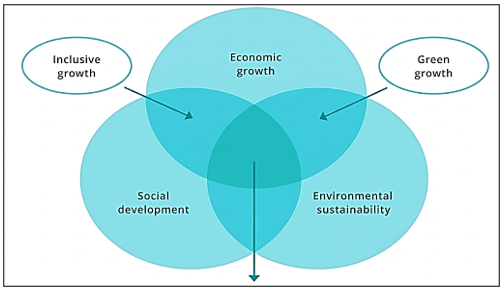
The application of digital technology aims to increase competitiveness and aligns with the principles of an inclusive green economy, which has three main dimensions: economic, social, and environmental [32, 33]. The integration of Tourism 4.0 with the principles of an inclusive green economy in regional tourism destinations not only creates management and promotion efficiency but also empowers the local economy, equitable tourism access, and interconnects the integration of various stakeholders in tourism destination management, resulting in a positive impact in the form of a reduced carbon footprint [34, 35].
Given that the development of regional tourism destinations can have negative impacts on ecosystems and natural resources, the concept of a green economy is crucial, and a framework is needed that integrates environmental, social, and governance strategies into local economic business models to evaluate impacts and create value for sustainable tourism. Thus, this study aims to support the development of inclusive, technology-based regional tourism destinations. It also aims to map potential and develop tourist attractions based on key criteria determining their feasibility and development opportunities, including attractiveness, accessibility, accommodation, facilities and infrastructure, socioeconomic conditions, management and services, and clean water availability. Of these, the study formulates the various alternative strategies to create tourism development that aligns with Tourism 4.0 and supports the implementation of an inclusive green economy.
While previous research has frequently used clustering techniques for destination analysis, the conceptual novelty of this study lies in integrating Tourism 4.0 strategies with an Inclusive Green Economy framework. Rather than solely clustering tourist destinations based on visitor perceptions, this study utilizes these cluster characteristics to prescribe specific, tailored digital interventions, such as Virtual Reality (VR), Augmented Reality (AR), and digital tour packages that directly map to the economic, social, and environmental sustainability goals of regional development.
2.1 Tourism 4.0
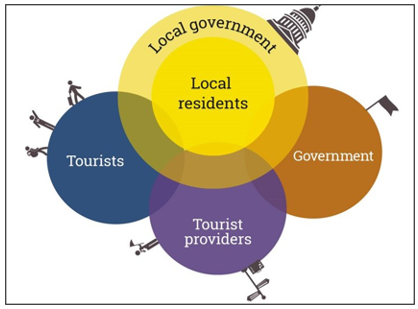
Tourism 4.0 integrates all stakeholders, from local communities, tourists, tourism service providers, and the government [36]. Tourism 4.0 represents a new phase of tourism development following E-tourism and M-tourism, also known as Smart Tourism [37, 38]. As a relatively new concept, the implementation of Tourism 4.0 varies across countries. However, in general, Tourism 4.0 can be defined as adapting the tourism sector to the principles of Industry 4.0 to create a smarter system (smart tourism), providing convenience, and enhancing the tourist experience (see Figure 1) [37, 39, 40].
Figure 1. Concept of Tourism 4.0 [36]
2.2 Inclusive green economy in the tourism sector
The concept of an inclusive green economy plays a crucial role in encouraging innovation, particularly in renewable energy and sustainable technologies, thereby balancing economic development and environmental sustainability [9, 41]. This approach helps preserve natural ecosystems and provides economic benefits to local communities [34, 42]. An inclusive green economy in Indonesia is implemented to support environmental sustainability and encourage sustainable tourism practices [43].
Figure 2. Inclusive green economy scheme [44]
This approach is crucial, especially in regional tourism destinations consumption, because it can involve local communities and promote environmentally friendly activities, enabling equitable, simultaneous economic and social benefits. An inclusive green economy is also seen as capable of addressing systemic issues within the economic system, thereby simultaneously achieving sustainable development goals in social, economic, and environmental spheres. Figure 2 presents the strategy for realizing an Inclusive Green Economy, encompassing three principal dimensions. First, the economic aspect encompasses efficient resource allocation, job creation and maintenance, stimulating innovation and the adoption of green technologies that benefit vulnerable groups, and diversification to strengthen local and national economic resilience.
Second, the social aspect encompasses improving health and well-being, maintaining justice, and building social capital to enhance community resilience. Third, the environmental aspect emphasizes optimizing productivity and natural resource utilization, reducing pollution and disaster risk, and investing in conservation and ecosystem restoration to ensure sustainability. Inclusiveness in this economy refers to increasing per capita income by providing equal access to the benefits of economic growth for all levels of society.
While previous literature has extensively explored Smart Tourism and Tourism 4.0 primarily as mechanisms for enhancing visitor experiences and optimizing destination operations [12-14, 37-40], most studies approach digital transformation from an isolated technological perspective. Furthermore, although the importance of sustainable development and the Inclusive Green Economy is well recognized for balancing economic growth with environmental sustainability and community empowerment [9, 32-34, 41-44], a significant gap persists in current research. Few past studies have developed a comprehensive matrix that explicitly bridges Tourism 4.0 digital interventions with the specific tri-dimensional pillars of an Inclusive Green Economy: economic, social, and environmental. This study addresses this gap by presenting a novel framework that directly maps tailored digital strategies, such as AR and digital tour packages, to these three core sustainability dimensions [45-49].
This study employs a quantitative approach utilizing data mining analysis, which can provide valuable insights for improving decision-making processes and operational efficiency, thus having strategic potential [50]. This study utilizes data mining tools with the K-means clustering algorithm. Data mining involves discovering meaningful new correlations, patterns, and trends by sorting through large amounts of data stored in repositories, utilizing technological pattern recognition and statistical and mathematical techniques [51].
Meanwhile, K-means clustering is a popular method used to obtain a description of a data set by revealing the tendency of each data point to group with other data points [52-57]. This grouping tendency is based on the similarity of existing data characteristics. The basic idea of this technique is to find the center of each existing data group, then assign each data point to the group whose center is closest.
The data were collected through a questionnaire addressed to visitors at 10 predetermined tourist attractions: Prawatasari Park, Prawatasari Field, Cibodas Botanical Gardens, Nusantara Flower Garden, Flower City, Little Venice, Fantasy Arena, Cianjur Square, Saung Sarongge, and Sarongge Tourism Village. The sample in this study was 100 tourists visiting these tourist attractions. The data and information used are primary data collected through questionnaires from 100 tourists at ten tourist attractions, which represent a mix of natural, man-made, and cultural attractions. In addition, the data and information collected from the questionnaires will be processed using the R Studio application and the K-means clustering algorithm. The results will be organized according to the data groupings in the cluster plots, which will then be analyzed in more detail.
4.1 Respondent characteristics
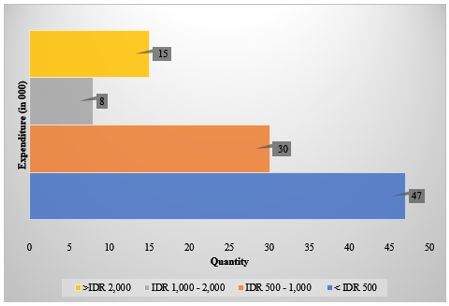
The results of this study indicate that the number of tourists by gender is 43 men and 57 women. Respondents’ tourism expenditure is illustrated in Figure 3.
Figure 3. Tourist data based on travel expenditure (monthly)
Figure 3 shows that tourists have a special travel budget, spending less than IDR 500,000 per month. There are 47 respondents, followed by those with an income of IDR 500,000 - IDR 1,000,000 (30) and those with an income of IDR 1,000,000 - IDR 2,000,000 (8). In comparison, as many as 15 respondents who travel have monthly expenses exceeding IDR 2,000,000. This data shows that the average respondent does not prepare a large budget and prioritize travel needs.
4.2 Accessibility
Accessibility is an important component of the tourism experience because it influences travel convenience, visitor satisfaction, and destination attractiveness. The distribution of respondents' perceptions is presented in Table 1.
Table 1. Road conditions and accessibility
|
Category |
Frequency |
Percentage |
|
Good |
42 |
42.0 |
|
Fairly Good |
41 |
41.0 |
|
Very Good |
14 |
14.0 |
|
Poor |
3 |
3.0 |
Table 1 presents respondents' perceptions of road conditions and accessibility to the tourist destination. The findings indicate that most respondents evaluated the accessibility positively. Specifically, 42 respondents (42%) rated the road conditions and accessibility as good, while 41 respondents (41%) considered them fairly good. In addition, 14 respondents (14%) perceived the accessibility as very good. Collectively, these three categories account for 97% of all responses, demonstrating that most visitors experienced generally satisfactory access to the tourist destination. Only 3 respondents (3%) rated the road conditions and accessibility as poor, indicating that accessibility issues affected a relatively small proportion of visitors.
The distance between the main road and the tourist destination is an important factor in accessibility, as it affects visitors' travel convenience and overall experience. Table 2 presents respondents' perceptions of the distance from the main road to the tourist destination.
Table 2. Distance from the main road to the tourist destination
|
Category |
Frequency |
Percentage |
|
Near |
33 |
33.0 |
|
Far |
56 |
56.0 |
|
Very Far |
12 |
12.0 |
Table 2 shows that 56 (56%) respondents perceived the tourist destination as far from the main road. Meanwhile, 33 respondents (33%) considered the distance to be near, while 12 respondents (12%) considered it very far. These results suggest that many visitors need to travel a considerable distance beyond the main road before reaching their destination. The relatively high proportion of respondents reporting that the destination is far or very far indicates that distance remains a potential challenge for tourists. Longer travel distances may increase transportation costs, travel time, and visitor fatigue, particularly for tourists who rely on public transportation or travel with families and elderly companions.
4.3 Amenities
The availability of amenities is a key factor influencing tourists' overall satisfaction and destination competitiveness. Among these amenities, the prices of food, beverages, souvenirs, and other tourism-related goods and services play an important role in shaping visitors' perceptions of value. Table 3 presents respondents' perceptions of prices at the tourist destination.
Table 3. Prices of goods and services at the tourist destination
|
Category |
Frequency |
Percentage |
|
Expensive |
70 |
70.0 |
|
Affordable |
23 |
23.0 |
|
Very Expensive |
2 |
2.0 |
|
Very Affordable |
1 |
1.0 |
|
Do Not Know |
4 |
4.0 |
Table 3 shows that most respondents (70%) perceived the prices of goods and services at the tourist destination as expensive. In contrast, 23 respondents (23%) considered the prices affordable, while only 2 respondents (2%) rated them as very expensive. Additionally, only 1 respondent (1%) perceived the prices as very affordable, whereas 4 respondents (4%) indicated that they did not know, possibly because they did not purchase any products or services during their visit. The dominance of responses indicating that prices are high suggests that the cost of tourism-related products and services may be a concern for many visitors. Higher prices can reduce tourists' purchasing intentions, shorten their stay, and negatively affect overall satisfaction, particularly among domestic tourists and budget-conscious travelers.
Cleanliness and maintenance are essential components of tourism amenities because they directly influence visitor comfort, satisfaction, and the overall image of a destination. Well-maintained tourist attractions contribute to a positive visitor experience and encourage repeat visits. Table 4 presents respondents' perceptions of the cleanliness and maintenance of the tourist destination.
Table 4. Cleanliness and maintenance
|
Category |
Frequency |
Percentage |
|
Good |
47 |
47.0 |
|
Fairly Good |
40 |
40.0 |
|
Very Good |
12 |
12.0 |
|
Poor |
1 |
1.0 |
Table 4 displays that respondents generally evaluated the cleanliness and maintenance of the tourist destination positively. Nearly half of the respondents, 47 or (47%), rated cleanliness and maintenance as good, while 40 respondents (40%) rated them as fairly good. Furthermore, 12 respondents (12%) perceived the conditions as very good. Collectively, these responses account for 99% of all respondents, indicating a high level of satisfaction with the destination's cleanliness and maintenance. Only 1 respondent (1%) rated cleanliness and maintenance as poor, suggesting minimal dissatisfaction with environmental conditions. Although this proportion is very small, it highlights the importance of continuous maintenance and environmental management to ensure consistently high service standards.
4.4 Facilities
Facilities are a fundamental component of tourism development because they support visitors' comfort, convenience, and overall travel experience. The availability of adequate facilities, such as rest areas, parking spaces, public toilets, places of worship, information centers, and food outlets, can significantly influence tourist satisfaction and destination competitiveness. Table 5 presents respondents' perceptions of the adequacy of facilities at the tourist destination.
Table 5. Perceived adequacy of facilities
|
Category |
Frequency |
Percentage |
|
Adequate |
77 |
77.0 |
|
Inadequate |
17 |
17.0 |
|
Very Adequate |
6 |
6.0 |
Table 5 shows that most respondents viewed the available facilities positively. A total of 77 respondents (77%) stated that the facilities were adequate, while 6 respondents (6%) considered them very adequate. Together, these responses account for 83% of all respondents, suggesting that the existing facilities generally meet visitors' expectations and support their tourism activities. In contrast, 17 respondents (17%) perceived the facilities as inadequate, indicating that a notable proportion of visitors still experienced deficiencies during their visit. These concerns may relate to the availability, condition, accessibility, or capacity of tourism facilities, particularly during peak visitor periods.
Service quality is an important aspect of tourism management because it influences visitor satisfaction, destination image, and tourists' intentions to revisit and recommend a destination. Effective management services include responsive staff, efficient administration, visitor assistance, and the overall organization of tourism activities. Table 6 presents respondents' perceptions of the quality of management services at the tourist destination.
Table 6. Perceived quality of management services
|
Category |
Frequency |
Percentage |
|
Good |
58 |
58.0 |
|
Fairly Good |
33 |
33.0 |
|
Very Good |
7 |
7.0 |
|
Poor |
2 |
2.0 |
Table 6 shows that respondents generally evaluated the management services positively. Most respondents (58%) rated service quality as good, while 33 respondents (33%) rated it as fairly good. In addition, 7 respondents (7%) perceived the services as very good. Together, these responses represent 98% of all respondents, indicating a high level of satisfaction with the management of the tourist destination. Only 2 respondents (2%) rated the management services as poor, suggesting that negative experiences with service delivery were relatively uncommon. Nevertheless, these responses indicate that opportunities remain for improving consistency in service quality and visitor engagement.
4.5 Digital technology
Digital technology has become an integral component of the tourism industry, supporting information access, travel planning, destination promotion, online reservations, navigation, and communication. The growing adoption of digital platforms has transformed the way tourists search for information and experience destinations. Table 7 presents respondents' perceptions of the importance of digital technology in tourism.
Table 7. Importance of digital technology in tourism
|
Category |
Frequency |
Percentage |
|
Important |
53 |
53.0 |
|
Very Important |
47 |
47.0 |
Table 7 shows that all respondents recognized the importance of digital technology in tourism. A total of 53 respondents (53%) considered digital technology important, while the remaining 47 respondents (47%) perceived it as very important. Notably, no respondents indicated that digital technology was unimportant, reflecting a unanimous acknowledgment of its significant role in contemporary tourism activities.
4.6 Data mining with the K-means clustering method
Data mining analysis aims to identify potential tourist attractions in regional destinations, enabling stakeholders to develop effective strategies. This mapping helps increase the efficiency of marketing strategies, making them more targeted and enabling tourist destinations to utilize their various resources more effectively [58, 59]. Although the survey utilized ordinal response categories, these variables were transformed into 1-to-5 numerical scales and treated as interval data. This transformation, standard in social science research, allows for the calculation of cluster centroids and the application of Euclidean Distance as the similarity measure.
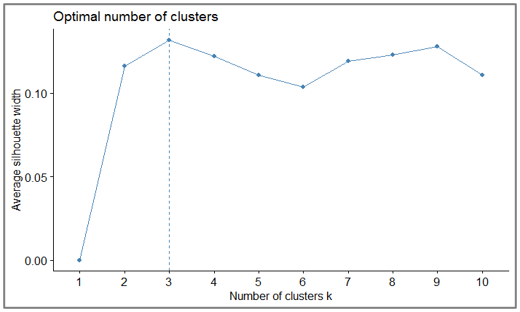
The clustering analysis was conducted using the K-Means algorithm in RStudio to identify groups of respondents with similar perceptions regarding tourism destination development. The optimal number of clusters was determined using the Silhouette Method. As shown in Figure 4, the highest average silhouette width was obtained at k = 3, indicating that three clusters provided the most appropriate grouping structure for the dataset.
Figure 4. Determination of the optimal number of clusters using the silhouette method
Table 8. Measurement and coding scheme used in data mining and clustering analysis
|
Dimension |
Indicator |
Coding Scheme |
|
Accessibility |
Road condition and accessibility |
1 = Very Poor 2 = Poor 3 = Fairly Good 4 = Good 5 = Very Good |
|
Distance from the main road |
1 = Nearest 2 = Near 3 = Moderate 4 = Far 5 = Very far |
|
|
Amenities |
Amenity price |
1 = Not Identified 2 = Very Affordable 3 = Affordable 4 = Expensive 5 = Very Expensive |
|
Cleanliness and comfort |
1 = Very Poor 2 = Poor 3 = Moderate 4 = Good 5 = Excellent |
|
|
Facilities |
Facility adequacy |
1 = Not Identified 2 = Very Inadequate 3 = Inadequate 4 = Adequate 5 = Highly Adequate |
|
Service quality |
1 = Very Poor 2 = Poor 3 = Moderate 4 = Good 5 = Very Good |
|
|
Digital Technology |
Importance of digital technology |
1 = Very Unimportant 2 = Unimportant 3 = Important 4 = Very Important |
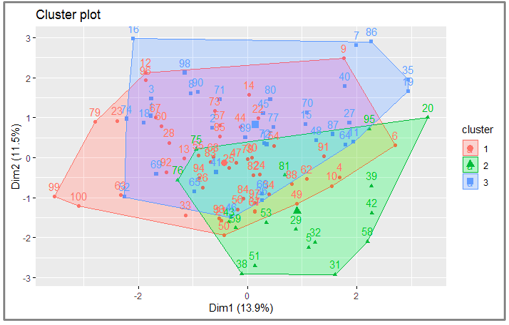
On the basis of the silhouette analysis, the optimal number of clusters was determined to be three (k = 3). The clustering analysis was conducted using responses from 100 tourists collected across ten tourism destinations. Although individual tourists served as the primary unit of analysis, their collective responses were aggregated to evaluate and formulate development strategies for destination-level infrastructure and digital technologies. The variable used in the clustering analysis was transformed into numerical scores based on the coding scheme presented in Table 8. Most variables were measured using ordinal response categories representing respondents’ perceptions of accessibility, amenities, facilities, and digital technology.
Since the variables were transformed into comparable numerical scales and primarily represented ordered respondent perceptions, Euclidean Distance was employed as the similarity measure in the K-means clustering process. This approach is commonly applied in exploration tourism and social science research to identify groups with similar response patterns. The K-means analysis grouped the 100 respondents into three clusters: 48, 17, and 35, respectively. The distribution of respondents across the resulting clusters is illustrated in Figure 5.
Figure 5 illustrates the distribution of respondents across three clusters based on similarities in their assessments of the analyzed variables. The average values of the analyzed variables within each cluster were used to identify cluster characteristics and primary development issues. Based on these findings, development implications were formulated using the Inclusive Green Economy framework, encompassing economic and environmental dimensions. Rather than merely categorizing destination characteristics, the core conceptual output of this study is presented in Tables 9, 10, and 11, which collectively establish a novel framework for destination management by directly translating these cluster insights into actionable economic, social, and environmental strategies.
Figure 5. Cluster of tourist plot
Ultimately, Tables 9, 10, and 11 represent the core conceptual output of this study: a destination management framework that moves beyond traditional clustering by prescribing tailored Tourism 4.0 solutions for specific economic, social, and environmental challenges. The clustering results indicate that each respondent group exhibits distinct perceptions regarding tourism facilities, technology use, and destination management. These differences suggest that tourism development priorities vary across clusters and therefore require tailored development strategies rather than a uniform policy approach.
Table 9. Result of clustering and development implications based on an inclusive green economy
|
Cluster |
Key Issues |
Development Implications |
|
|
Cluster 1 |
Tourist facilities, amenities, cleanliness, and services are generally satisfactory, although the use of technology and stakeholder involvement remain moderate. |
Optimized accessibility, stakeholder collaboration, and technology utilization |
Economic Aspects: TOAs management can collaborate with local governments to improve destination connectivity through efficient and environmentally friendly transportation services Social Aspects: Enhance visitor safety and convenience through better security measures and clear directional information around the tourist area. Environmental Aspects: Improving road access with environmentally friendly materials. |
|
Cluster 2 |
Tourism information, transportation services, and technology utilization are positively perceived, with the lowest level of visitor difficulties. |
Strengthening destination attractiveness and visitor engagement. |
Economic Aspects: expand digital promotion based on green branding to attract tourists, development of a creative economy based on local wisdom (eco-friendly products, recycled souvenirs) to increase the income of local communities. Social Aspects: Improve directional signage that is accessible to elderly and disabled visitors and provide digital tourism training for local communities to strengthen their participation in Tourism 4.0 development. Environmental Aspects: Creation of photo spots utilizing existing or recycled materials, and addition of waste management facilities based on the 3Rs (Reduce, Reuse, Recycle). |
|
Cluster 3 |
Amenities, cleanliness, promotion, and stakeholder involvement are strong, but visitor difficulties remain relatively high. |
Improving inclusiveness and reducing constraints on visitors. |
Economic Aspects: Develop inclusive and environmentally friendly tourism facilities, such as educational and recreational areas, to enhance destination attractiveness and support local economic development communities. Social Aspects: Adding special facilities for the elderly and disabled to create equal access. Environmental Aspects: Environmental sustainability can be strengthened through the expansion of green open spaces, increased vegetation coverage, and the adoption of energy-efficient infrastructure. |
Table 10. Potential Tourist Objects and Attractions (TOAs) digital tour package strategy
|
Tourist Attraction Objects |
Digital Tour Packages |
Digital Strategy |
|
Kebun Raya Cibodas |
Eco-tours and botanical tours |
Augmented reality for plant identification and online booking |
|
Taman Bunga Nusantara |
Floral tours |
Live virtual tours |
|
Saung Sarongge |
Nature tour packages |
Online booking |
|
Kota Bunga |
Family and park tour packages |
Digital navigation app with directions to houses based on theme/type |
|
Taman Prawatasari |
Family recreation and sports packages |
Virtual reality previews for outdoor attractions |
|
Alun-alun Cianjur |
Cultural heritage tours |
Digital audio guide |
Table 11. Tourist Objects and Attractions (TOA)’s developing digital tour package strategy
|
Tourist Attraction Objects |
Digital Tour Packages |
Digital Strategy |
|
Lapangan Prawatasari |
Family tour packages |
AR photo spots, online booking |
|
Arena Fantasi |
Themed tour packages |
Virtual reality tours, digital booking packages, and livestreaming on social media platforms |
|
Little Venice |
Venice-themed tour packages |
Virtual reality tours, digital booking packages, and livestreaming on social media platforms |
|
Desa Wisata Sarongge |
Agro & cultural experiences |
Online booking, agricultural workshops, or educational tours |
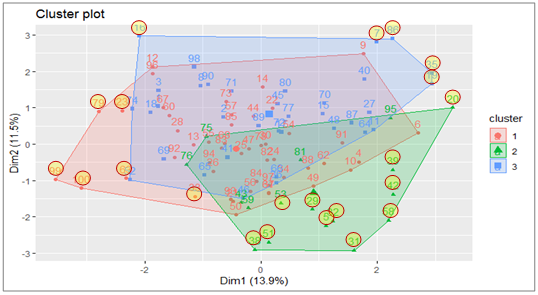
Rather than relying solely on visual separation, an exploratory outlier analysis was conducted based on distance metrics. A total of 22 observations were identified as outliers, formally defined as data points whose Euclidean distance from their assigned cluster centroid exceeded the 90th percentile of the overall distance distribution. These points were further analyzed to explore distinctive destination characteristics.
Figure 6. Cluster of tourist plot (re-analyzed)
Figure 6 shows an explanatory analysis of observations visually separated from the main cluster concentration in the cluster plot. A total of 22 observations were identified and further analyzed to explore distinctive characteristics that may not be fully represented within the three primary clusters. This additional analysis highlighted several differentiating indicators, including tourism destinations, distance, amenity price, and perceived destination shortcomings.
While the primary cluster analysis identified general development patterns, an additional exploratory analysis was conducted on observations visually located outside the main cluster in the cluster plot. These observations provide additional insights into destinations that exhibit unique characteristics and may require more specific development strategies. The summary of these characteristics, key issues, and development implications is presented in Table 12.
Table 12. Distinctive destination characteristics and development implications
|
Characteristics |
Key Issues |
Development Implications |
|
|
Outliers Output |
The observations are characterized by positive perceptions of destination accessibility, affordable amenity prices, and satisfactory cleanliness and maintenance conditions. Information regarding these destinations is primarily obtained through social and electronic media. However, respondents perceive limited diversification of tourism attractions despite the destination's natural appeal. These characteristics were predominantly associated with Kota Bunga, Prawatasari Park, and Cianjur Square. |
Limited attraction diversification despite good accessibility, affordability, and destination management. |
Economic Aspects: Diversification of attractions based on local potential, such as educational parks, empowering local Micro, Small, and Medium Enterprises (MSMEs) to provide/sell environmentally friendly products. Social Aspects: develop family-friendly recreational areas and improve facilities for elderly and children visitors to broaden the destination’s appeal across different visitor groups. Environmental Aspects: enhance destination attractiveness through eco-friendly photo spots, improved cleanliness, and waste management practices based on 3R (Reduce, Reuse, Recycle) principle. |
4.7 Mapping of potential tourist attractions
On the basis of the clustering analysis, the TOAs identified as potential tourist attractions in this study are those in cluster 3 and a new cluster formed from outliers. This is because these clusters already have attractions widely known to tourists, good accessibility, and supporting facilities. Meanwhile, cluster 1 faces significant accessibility constraints, underscoring the need for infrastructure development to further enhance the potential of these tourist destinations. Meanwhile, cluster 2 can develop with improved facilities and more effective promotional strategies. Based on these results (in Table 13), it can be concluded that of the 10 tourist attractions in this regional tourism destination, the mapping of objects based on their potential and development is as follows:
Table 13. Potential Tourist Objects and Attractions (TOA) and developing TOA
|
Tourist Attraction Objects |
Developing Tourist Attraction Objects |
|
Kebun Raya Cibodas |
Lapangan Prawatasari |
|
Taman Bunga Nusantara |
Arena Fantasi |
|
Saung Sarongge |
Little Venice |
|
Kota Bunga |
Desa Wisata Sarongge |
|
Taman Prawatasari |
|
|
Alun-alun Cianjur |
4.8 Digital technology development strategy in Tourism 4.0
The proposed digital strategies are derived directly from the empirical cluster characteristics. For instance, destinations in cluster 1, which face significant physical accessibility constraints, can leverage VR to provide alternative remote access and stimulate initial interest. Conversely, destinations in cluster 2 and the outlier group, which boast good physical accessibility but require enhanced diversification of attractions, are better suited for AR to overlay digital experiences onto existing physical attractions. Finally, digital tour packages and integrated apps address the widespread need for transparent pricing and integrated stakeholder communication identified across cluster 3.
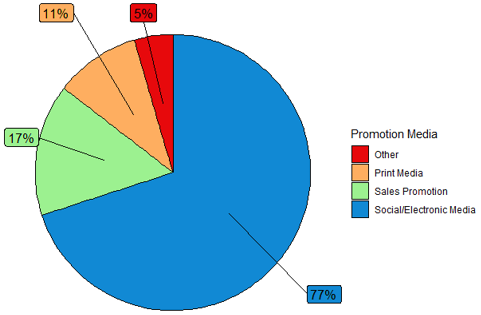
In line with the results of interviews with stakeholders in regional tourism destinations, it is planned to create an application in the next few years that will provide more inclusive, integrated information, ranging from village tourist attractions to other data that many people can access. The application of technological innovation is expected to help become one of the solutions. This is also in line with the results of the tourist questionnaire, which stated that the promotional media considered effective for tourism marketing is the use of digital, namely through social/electronic media (77%), followed by sales promotions 17%, through print media 11%, and 5% with other means such as through word of mouth (see Figure 7).
Figure 7. Tourist plot cluster
In relation to this, several development strategies that can be implemented by using digital technology in this regional TOA are:
4.8.1 Virtual tour
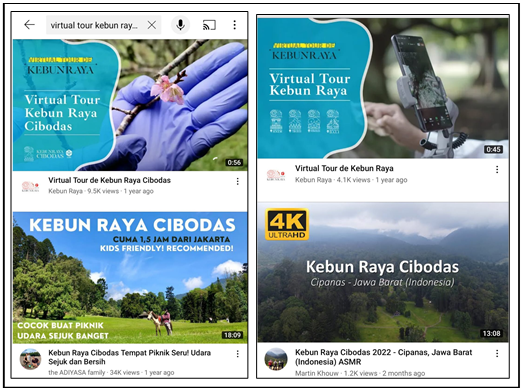
This virtual tour system can be web-based and accessed via mobile devices. This virtual tour is hoped to improve effective solutions for promotion, accessibility, education, and tourism management [45-47]. Virtual tours are one of the most promising and effective ways to achieve these goals [48]. Virtual tours can help prevent various tourism businesses from being completely shut down during the crisis by creating new business models and offering various opportunities to various organisations in the tourism sector [49, 60]. This is especially true for TOAs that are still developing or have limited access. Based on this, several tourist attractions have implemented virtual tours as a form of tourism marketing, including Cibodas Botanical Gardens and Kota Bunga (in Figure 8). Other TOAs can also adapt this program to accelerate the development of tourist attractions and increase the number of direct and digital visits.
Figure 8. Virtual tour of Cibodas botanical gardens
4.8.2 Tour packages
A digital-based tourism package strategy, combined with an inclusive green economy concept, can help TOA maximize tourism potential and accelerate the development of more inclusive emerging tourist attractions.
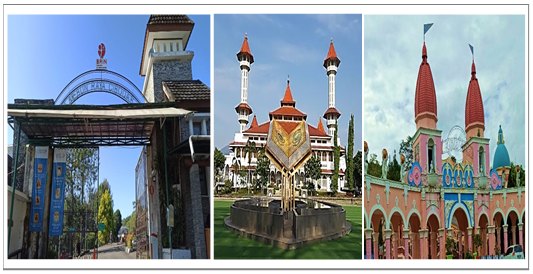
Figure 9. Regional Tourist Objects and Attractions (TOA)
TOAs in this category (Figure 9) have a strong appeal and already have a relatively robust infrastructure. Therefore, they can focus on enhancing tourism experience with digital technology.
The TOA in this category (see Table 10) has limited facilities and attractions. Therefore, they can focus on digital promotion and on enhancing their tourist appeal through interactive, sustainable technology.
4.8.3 Digital support
Tourist attractions can develop digital payment strategies through mobile payment for entrance tickets. This cashless mobile payment strategy can be implemented using smartphones and e-wallets. From an inclusive green economy perspective (environmental aspects), this strategy will reduce paper waste (going paperless). Furthermore, digital maps can be accessed by scanning QR codes, reducing the paper waste associated with conventional maps or brochures (see Table 6). Previous studies demonstrated that the use of mobile-based applications in various fields [61-63], including education and monitoring, has significantly simplified transactions and increased user satisfaction [64]. Therefore, ticket payments at tourist attractions can be made using NFC, QR codes, artificial intelligence, and IoT. This aims to help tourists book and pay for tickets. Furthermore, the use of QR codes in ticket validation has been proven to speed up the tourist entry process and enhance transaction data security.
The primary contribution of this research lies in the development implications outlined in Tables 9, 10, and 11, which serve as a novel destination management framework demonstrating how targeted digital interventions can be mapped directly onto the inclusive green economy pillars. This study makes theoretical and practical contributions to the development of more sustainable and inclusive regional tourism destinations, applying the concept of Tourism 4.0 and technologies such as VR and AR. It becomes a strategic solution that expands promotions, creates more interactive tourism experiences, and improves management efficiency.
Furthermore, this transformation is also aligned with the inclusive green economy (inclusive green economy), which emphasizes economic and environmental sustainability and the involvement of other parties (local government, private sector, and local communities) in managing regional tourism destinations. The integration of these two concepts not only reduces the carbon footprint (using VR and AR) but also empowers the local economy and provides inclusive access to the community. This study can also serve as a model for other regional tourism destinations facing challenges of sustainability and inclusivity.
The authors would like to express our sincere gratitude to the Ministry of Education, Culture, Research, and Technology of the Republic of Indonesia, particularly the Directorate General of Higher Education, Research, and Technology (DRTPM), for supporting this research through the Higher Education Excellence Basic Research Grant (Regular Fundamental Research Scheme 2025), under Grant No. 125/C3/DT.05.00/PL/2025 and Agreement No. 7928/LL4/PG/2025. The authors also thank the reviewers for their constructive comments and suggestions.
The dataset supporting the findings of this study is available from the corresponding author upon reasonable request.
[1] Sun, Z., Liu, L., Pan, R., Wang, Y., Zhang, B. (2025). Tourism and economic growth: The role of institutional quality. International Review of Economics & Finance, 98: 103913. https://doi.org/10.1016/j.iref.2025.103913
[2] World Bank. (2025). Tourism and competitiveness. https://libguides.worldbank.org/tourism.
[3] Fernandes, E., Pacheco, R.P., Fernandes, V.A. (2019). Tourism openness, trade openness, and currency-purchasing power in Brazil: A causality analysis. International Journal of Tourism Research, 21(2): 197-205. https://doi.org/10.1002/jtr.2254
[4] Yue, G., Zubair, A., Usman, M., Abro, M.A. (2023). Institutional environment and tourism: Moderating role of host countries' health system. Journal of the Knowledge Economy, 15(2): 7358-7374. https://doi.org/10.1007/s13132-023-01163-6
[5] Maneejuk, P., Yamaka, W., Srichaikul, W. (2022). Tourism development and economic growth in Southeast Asian countries under the presence of structural break: Panel kink with GME estimation. Mathematics, 10(5): 723. https://doi.org/10.3390/math10050723
[6] World Travel & Tourism Council. (2024). Economic impact report 2024. World Travel & Tourism Council.
[7] Oladipo, D. (2024). Travel industry to contribute record $11 T to global GDP in 2024. Reuters. https://www.reuters.com/business/travel-industry-contribute-record-11-trillion-global-gdp-2024-2024-09-03/.
[8] Kemenparekraf. (2024). Laporan Kementerian Pariwisata dan Ekonomi Kreatif. Wonderful Indonesia. https://api.kemenpar.go.id/storage/app/media/LAKIN%20D6%202024.pdf.
[9] Andria, F., Tosida, E.T., Jayawinangun, R., Saputra, J. (2025). Drivers of the smart green economy in rural settings: An empirical study on local wisdom, ICT, and the mediating role of entrepreneurship. Theoretical and Practical Research in Economic Fields, 16(3): 656-667. https://doi.org/10.14505/tpref.v16.3(35).10
[10] Dwivedi, Y.K., Ismagilova, E., Hughes, D.L., et al. (2021). Setting the future of digital and social media marketing research: Perspectives and research propositions. International Journal of Information Management, 59: 102168. https://doi.org/10.1016/j.ijinfomgt.2020.102168
[11] Jani, A., Ratnoday, N.R., Bajpai, S. (2024). Social media influence on travel choices. International Research Journal of Humanities and Interdisciplinary Studies, 5(7): 1-14. https://irjhis.com/paper/IRJHIS2407001.pdf.
[12] Rodrigues, V., Breda, Z., Rodrigues, C. (2024). The implications of Industry 4.0 for the tourism sector: A systematic literature review. Heliyon, 10(11): e31590. https://doi.org/10.1016/j.heliyon.2024.e31590
[13] Bratic, M. (2025). New era of tourism: Innovative transformation through Industry 4.0 and sustainability. Sustainability, 17(9): 3841. https://doi.org/10.3390/su17093841
[14] Timoshenko, D.S. (2021). Tourism 4.0: Education, pedagogy and digital learning solutions for Russian Arctic. IOP Conference Series: Earth and Environmental Science, 816: 012020. https://doi.org/10.1088/1755-1315/816/1/012020
[15] Wawo, M., Tetelepta, J.M.S., Willem Ayal, F., A.B Mamesah, J., Rahman, Bernard Hehakaya, T. (2025). The participation level of the local community towards community-based tourism development in Sopapei Tourism Destination, Ambon, Indonesia. Media Konservasi, 30(1): 96-105. https://doi.org/10.29244/MEDKON.30.1.96
[16] Li, X., Wong, J.N., Kim, D., Qin, J., Yuan, Y. (2025). Sustainable planning and development of the MICE industry with tourism evaluation index: The case of Indonesia. International Journal of Tourism Research, 27(3): e70075. https://doi.org/10.1002/jtr.70075
[17] Rizal, M., Maulini, Y. (2020). Development of Indonesian tourism law in the tourism industry 4.0. Social Values & Society (SVS), 2(1): 9-15. https://doi.org/10.26480/SVS.01.2020.09.15
[18] Sari, N., Fajri, C., Winiarti, S., Ahdiani, U., Zulhuda, S. (2024). The regulations of protection tourists in high-risk tourism destination. Journal of Human Rights, Culture and Legal System, 4(3): 803-821. https://doi.org/10.53955/JHCLS.V4I3.366
[19] Antariksa, B., Maulana, A., Priyatmoko, R., Hamidah, S. (2024). Towards advanced tourism development in Indonesia: A critical review of free-visa policy. Aspirasi: Jurnal Masalah-Masalah Sosial, 15(1): 81-100. https://doi.org/10.46807/ASPIRASI.V15I1.3822
[20] Nurjaya, I.N. (2022). Legal policy of sustainable tourism development: Toward community-based tourism in Indonesia. Journal of Tourism Economics and Policy, 2(3): 123-132. https://doi.org/10.38142/JTEP.V2I3.404
[21] Nag, A., Mishra, S. (2024). Revitalizing mining heritage tourism: A machine learning approach to tourism management. Journal of Mining and Environment, 15(4): 1193-1225. https://doi.org/10.22044/jme.2024.13770.2554
[22] Wulandari, D.P. (2025). Tourism promotion strategy analysis: Increasing destination attractiveness in the digital era. MSJ: Majority Science Journal, 3(1): 163-173. https://doi.org/10.61942/MSJ.V3I1.330
[23] Simamora, V., Hendarti, F., Octaviana, R. (2025). The effectiveness of digital marketing in increasing tourist visits to Gunung Dago Nature Tourism Parung Panjang, Bogor, West Jawa. Ilomata International Journal of Social Science, 6(3): 881-896. https://doi.org/10.61194/ijss.v6i3.1707
[24] Giampiccoli, A., Saayman, M. (2017). Community-based tourism, responsible tourism, and infrastructure development and poverty. African Journal of Hospitality, Tourism and Leisure, 6(2): 1-28.
[25] Stefanidis, R.M., Bartzokas-Tsiompras, A. (2024). Pedestrian accessibility analysis of sidewalk-specific networks: Insights from three Latin American central squares. Sustainability, 16(21): 9294. https://doi.org/10.3390/su16219294
[26] Baye, F. (2025). Exploring urban infrastructure challenges in informal peri-urban Woldia: Barriers, implications, and informal strategies. Frontiers in Sustainable Resource Management, 4: 1555564. https://doi.org/10.3389/fsrma.2025.1555564
[27] Azmi, E., Che Rose, R.A., Awang, A., Abas, A. (2023). Innovative and competitive: A systematic literature review on new tourism destinations and products for tourism supply. Sustainability, 15(2): 1187. https://doi.org/10.3390/su15021187
[28] Rodrigo, M., Ajala, I., Irhanida, A.K. (2023). Qualitative analysis of a tourism area life cycle model for interacting tourism destinations. Annals of Tourism Research Empirical Insights, 4(1): 100093. https://doi.org/10.1016/j.annale.2023.100093
[29] Wisang, P.N., Pareira, R.A.E. (2025). Building the future of tourism: Stakeholder synergy in the sustainability transition in Sikka Regency, East Nusa Tenggara Province. International Journal of Economics, Business and Innovation Research, 4(2): 819-841.
[30] Tandafatu, N.K., Ermilinda, L., Darkel, Y.B.M. (2024). Digital transformation in tourism: Exploring the impact of technology on travel experiences. International Journal of Multidisciplinary Approach in Science and Technology (MULTI), 1(1): 55-64. https://doi.org/10.62207/w3vsg352
[31] Wu, W., Xu, C., Zhao, M., Li, X., Law, R. (2024). Digital tourism and smart development: State-of-the-art review. Sustainability, 16(23): 10382. https://doi.org/10.3390/su162310382
[32] Islam, H. (2025). Nexus of economic, social, and environmental factors on sustainable development goals: The moderating role of technological advancement and green innovation. Innovation and Green Development, 4(1): 100183. https://doi.org/10.1016/j.igd.2024.100183
[33] Adamowicz, M. (2022). Green deal, green growth and green economy as a means of support for attaining the sustainable development goals. Sustainability, 14(10): 5901. https://doi.org/10.3390/su14105901
[34] Asyrof, R.A., Rizaldi, M. (2025). Regional inclusive green growth in Indonesia: Unraveling determinants and disparities. Indonesian Journal of Energy, 8(1): 75-86. https://doi.org/10.33116/ije.v8i1.220
[35] Aslam, A., Ghouse, G. (2023). Targeting the new sustainable inclusive green growth: A review. Cleaner and Responsible Consumption, 11: 100140. https://doi.org/10.1016/j.clrc.2023.100140
[36] Starc Peceny, U., Urbančič, J., Mokorel, S., Kuralt, V., Ilijaš, T. (2019). Tourism 4.0: Challenges in marketing a paradigm shift. In Consumer Behavior and Marketing, pp. 1-19. https://doi.org/10.5772/intechopen.84762
[37] Tosida, E.T., Mulyati, M., Jayawinangun, R., Pratiwi, A.P., Sambas, A., Saputra, J. (2024). Investigating the spatial basis clustering of smart tourism potential using fuzzy c-means. Decision Science Letters, 13(4): 1027-1042. https://doi.org/10.5267/j.dsl.2024.6.001
[38] Errichiello, L., Micera, R. (2021). A process-based perspective of smart tourism destination governance. European Journal of Tourism Research, 29: 2909. https://doi.org/10.54055/ejtr.v29i.2436
[39] Zupan Korže, S. (2019). From Industry 4.0 to Tourism 4.0. Innovative Issues and Approaches in Social Sciences, 12(3): 29-52. https://doi.org/10.12959/issn.1855-0541.IIASS-2019-no3-art3
[40] Abdurakhmanova, G.K., Astanakulov, O.T., Goyipnazarov, S.B., Irmatova, A.B. (2022). Tourism 4.0: Opportunities for applying industry 4.0 technologies in tourism. In Proceedings of the 6th International Conference on Future Networks, New York, NY, United States, pp. 33-38. https://doi.org/10.1145/3584202.3584208
[41] Utami, N.R., Andria, F., Rusmanah, E. (2025). Konsep Green Economy Fondasi Ekonomi Sirkular Desa Wisata. Bogor: Unpak Press.
[42] Lestari, P., Mistriani, N. (2025). Strategy of sustainability and green tourism innovation in Tengah Sawah Gubug Tourism. The Eastasouth Journal of Social Science and Humanities, 2(2): 215-225. https://doi.org/10.58812/esssh.v2i02.440
[43] Purnomo, E.P., Khairunnisa, T. (2024). Green economy: Increasing economic growth to support sustainable tourism in super priority destinations. International Journal of Sustainable Development and Planning, 19(10): 4021-4031. https://doi.org/10.18280/ijsdp.191031
[44] Poverty Environment Partnership. (2012). Building an inclusive green economy for all: Opportunities and challenges for overcoming poverty and inequality. https://pdf.wri.org/Building_Inclusive_Green_Economy_for_All.pdf.
[45] Tosida, E.T., Walujo, A.D., Suriyansyah, M.I. (2017). Sustainability and imaging of local wisdom strengthening: Collaboration of eco-Edu tourism. Qardhul Hasan: Media Pengabdian Kepada Masyarakat, 3(2): 122-139. https://doi.org/10.30997/qh.v3i2.947
[46] Tosida, E.T., Permana, A., Karlitasari, L., Ardiansyah, D., Andria, F., Bon, A.T. (2020). Digital tourism education collaboration for strengthening micro business and post COVID-19 sustainable education models. In Proceedings of the International Conference on Industrial Engineering and Operations Management, Detroit, Michigan, USA, pp. 2399-2408.
[47] Tosida, E.T., Raafi’udin, R., Ashar, A.R., Kurnia, E. (2023). Application of augmented reality and the Floyd-Warshall algorithm in the Kujang Pamor Labyrinth educational game. In 2023 International Conference on Informatics, Multimedia, Cyber and Information Systems (ICIMCIS), Jakarta Selatan, Indonesia, pp. 566-572. https://doi.org/10.1109/ICIMCIS60089.2023.10349049
[48] Guha, A. (2020). Virtual tourism in the times of COVID-19: Here's how you can stay home, yet see the world. Travel and News.
[49] El-Said, O., Aziz, H. (2021). Virtual tours a means to an end: An analysis of virtual tours' role in tourism recovery post COVID-19. Journal of Travel Research, 61(3): 528-548. https://doi.org/10.1177/0047287521997567
[50] Tosida, E.T., Herdiyeni, Y., Marimin, Suprehatin, S. (2022). Smart village based on agriculture big data analytic: Review and future research agenda. International Journal of Agricultural and Statistical Sciences, 18(3): 515-538.
[51] Kurniawati, A.D., Wicaksono, A.D., Dinanti, D. (2022). Penilaian Tingkat Potensi Daya Tarik Wisata di Kabupaten Mojokerto (Studi Kasus: Wisata Sendi Adventure, Wisata Akar Seribu, dan Wisata Ranu Manduro). Planning for Urban Region and Environment Journal (PURE), 11(1): 195-204.
[52] Salmah, Andria, F., Wahyudin, I. (2019). Implementation of big data concept for variability mapping control of financing assessment of informal sector workers in Bogor City. World Scientific News, 135: 261-282.
[53] Dhanachandra, N., Manglem, K., Chanu, Y.J. (2015). Image segmentation using K-means clustering algorithm and subtractive clustering algorithm. Procedia Computer Science, 54: 764-771. https://doi.org/10.1016/j.procs.2015.06.090
[54] Umargono, E., Suseno, J.E., Gunawan, S.V. (2020). K-means clustering optimisation using the elbow method and early centroid determination based on mean and median formula. In The 2nd International Seminar on Science and Technology (ISSTEC), Yogyakarta, Indonesia, pp. 121-129. https://doi.org/10.2991/assehr.k.201010.019
[55] Zhao, Y., Zhou, X. (2021). K-means clustering algorithm and its improvement research. Journal of Physics: Conference Series, 1873: 012074. https://doi.org/10.1088/1742-6596/1873/1/012074
[56] Singh, R.P., Rajpoot, D.S. (2019). Efficient identification of initial clusters centers for partitioning clustering methods. In 2019 Fifth International Conference on Image Information Processing (ICIIP), Shimla, India, pp. 131-136. https://doi.org/10.1109/ICIIP47207.2019.8985743
[57] Lund, B., Ma, J. (2021). A review of cluster analysis techniques and their uses in library and information science research: K-means and K-medoids clustering. Performance Measurement and Metrics, 22(3): 161-173. https://doi.org/10.1108/PMM-05-2021-0026
[58] Hariansyah, N. (2021). Segmentasi pasar dalam komunikasi pemasaran Islam. Al-Hikmah, 19(2): 127-138. https://doi.org/10.35719/alhikmah.v19i2.73
[59] Carvajal, D.A.L., Morita, M.M., Bilmes, G.M. (2020). Virtual museums: Captured reality and 3D modeling. Journal of Cultural Heritage, 45: 234-239. https://doi.org/10.1016/j.culher.2020.04.013
[60] Waseha, D.A., Syafrianto, S. (2025). Penerapan algoritma K-Means untuk mengelompokkan kunjungan wisatawan pada dua puluh tempat wisata di Jakarta. Teknologia: Jurnal Ilmiah, 16(1): 32-39. https://doi.org/10.31602/tji.v16i1.16959
[61] Zhang, Y., Sotiriadis, M., Shen, S. (2022). Investigating the impact of smart tourism technologies on tourists' experiences. Sustainability, 14(5): 3048. https://doi.org/10.3390/su14053048
[62] Leung, R. (2022). Development of information and communication technology: From e-tourism to smart tourism. In Handbook of E-Tourism, pp. 23-55. https://doi.org/10.1007/978-3-030-48652-5_2
[63] Setiawan, Z., Sembiring, I.U., Pratama, A.Y. (2024). The influence of Internet of Things (IoT), digital payment systems, and 24/7 customer support services on improving tourist experience at tourism destinations in Bali, Indonesia. West Science Social and Humanities Studies, 2(9): 1470-1481. https://doi.org/10.58812/wsshs.v2i09.1293
[64] Andria, F., Triani, M., Gunawan, A.D., Hananto, B. (2023). Encouraging consumption enhancement: Green marketing mix study with customer satisfaction in Indonesians sustainable fashion. In 2023 International Conference on Informatics, Multimedia, Cyber and Informations System (ICIMCIS), Jakarta Selatan, Indonesia, pp. 606-610. https://doi.org/10.1109/ICIMCIS60089.2023.10349068