Hamid Ali Kamal* | Jalal Tavalaei | Hadi Nabi Afrouzi | Mehran Ektesabi | Moshiur Rahman Sohan
© 2026 The authors. This article is published by IIETA and is licensed under the CC BY 4.0 license (http://creativecommons.org/licenses/by/4.0/).
OPEN ACCESS
Integrating solar photovoltaic (PV) into distribution systems makes it hard to keep the voltage within permissible limits, which can lead voltage regulating devices such as on-load tap changing transformers (OLTC) to operate excessively to maintain voltage profiles. In this paper, a multi-objective cuckoo search algorithm (CSA) technique called optimal voltage regulation (OVR) scheme is demonstrated for systems with real-time high PV penetration. The method works best with designed coordinated schemes, such as PV, D-STATCOMs, and OLTC. The paper has two parts: one for hour-to-hour decisions and one for 15-min time slots. The first part looks at how to divide power between PV and other tools to keep voltages close to the desired level and to cut losses. The second part checks the system for changing load and solar irradiance conditions, keeps the total score low, and helps the system work better. Testing on a model of a standard 33-bus test system presents this coordination technique can save power and make the system operate smoothly with real-time varying solar and load profiles by keeping voltage within boundaries across all nodes and optimally operate OLTC 130 times a day and 365 times for 15-min intervals. The paper also investigates the integration of batteries to analyze its impact on the distribution system. The outcomes of the designed technique enhance system efficiency by improving the voltage profile and reducing losses and OLTCs cycles.
photovoltaic, voltage regulation devices, on-load tap change transformers, cuckoo search algorithm, voltage control, battery
Environmental concerns are a main reason for this, so power systems today are adding renewable energy resources (RERs) that are spread out, like photovoltaic (PV) panels and wind energy. The high resistance impedance ratio R/X of these distribution feeders, along with changes in renewable output or sudden load shifts, such as electric vehicle (EV) charging, can cause voltage to swing quickly. This rapid change causes on-load tap changing transformers (OLTC) and capacitors to switch often, which shortens their life span. Various voltage regulation approaches have been suggested to manage this, depending on the type of control used, which can be grouped into decentralized, centralized, and distributed control [1].
Decentralized control, which is the simplest and most common method, determines voltages based only on local voltage data [2, 3]. But it is not the best, especially as distributed energy resources (DERs) near their control limits [4, 5]. Centralized control uses all data from the system to optimize reactive power flow [6, 7]. Still, limited communication infrastructure and limited scalability in active distribution systems hinder this method [8].
Distributed voltage control is a way to balance decentralized and central control can get info from nodes nearby [9, 10]. Still, many today use offline methods they need a while to finish and then change the control signals for this reason, online algorithms are needed they can change the control signals on the fly based on measured data [11]. Some online distributed algorithms are out there [12, 13], but they only look at DERs they don’t work with the older regulators like OLTC [14]. Without a proper plan, the control errors may significantly affect system stability, it is why coordinated controls are so important [15].
Volt/VAR control (VVC) is generally split into local and centralized options [16]. Local VVC works by reading voltage levels nearby, making it quick and easy but not able to get full system control. On the other hand, centralized control uses global data like network info and load/RES predictions to have many devices work together for better voltage control [17]. Because they are mechanical and react slowly, traditional VVC devices like capacitor banks (CBs) and OLTCs run the risk of wearing out with continuous operation [12-15]. Because power electronics-based solutions, such as D-STATCOMs and static voltage compensators (SVCs) provide significantly faster response times and greater reactive power injection flexibility, they are better suited to dynamic grid conditions.
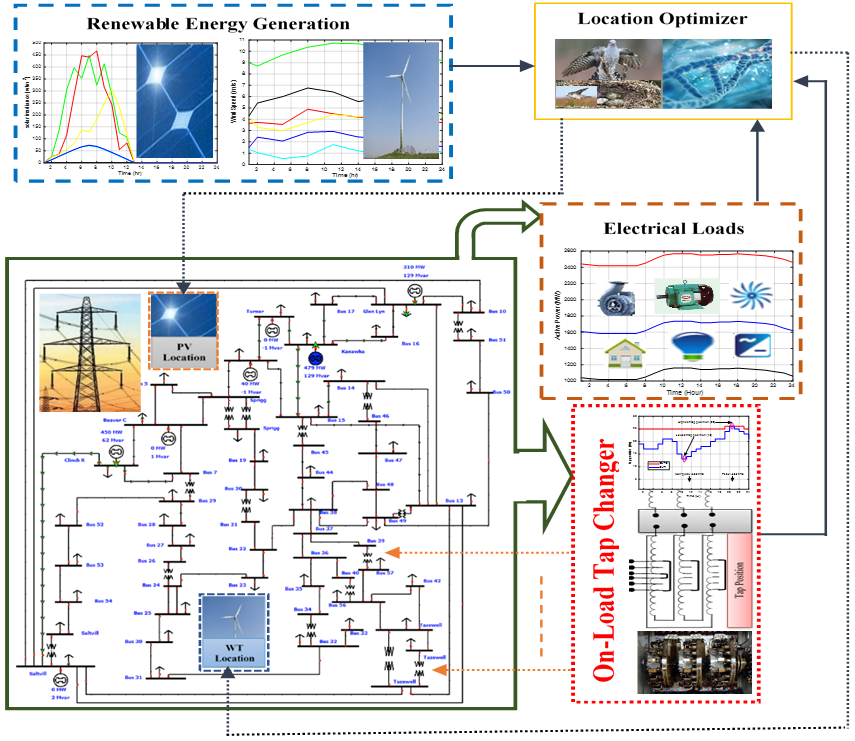
This work presents a way to control the best tap positions in a transformer by using a modified multi-objective cuckoo search algorithm (CSA) method. Main points include the best real-time solar power and load distribution for the hours of the day and the 15-minute periods in a day, the control of voltage in a utility system and the coordination of voltage, modeling for the setup DGs grids, and how to reduce losses. The proposed algorithm optimally locates, sizes, and coordinates DGs and D-STATCOMs with tap settings, validated through performance evaluation on the IEEE 33-bus assessment system. The overall framework of the voltage regulation planning process is presented in detail in Figure 1 below.
Figure 1. Refinement perception in voltage regulation arrangement
The ideal dimensions and placement of DGs to maintain voltage steadiness and minimize power waste throughout fluctuating loads were proposed by the study [12] with a voltage stability margin index. In the study [18], grey wolf optimization (GWO) was utilized to regulate the best position of RERs to mitigate voltage variations and reactive power losses. The whale optimization technique described in the study [13] was applied to maximize RERs capacity while lowering power losses and improving voltage profiles. A two-step strategy in the study [14] discovered optimal PV and D-STATCOM sitting and sizing, considering seasonal solar irradiance and demand, utilizing a voltage sensitivity index and a hybrid optimization algorithm. In a multi-objective harmony search method reduced energy loss, voltage variation, and cost in an active distribution network [15-17].
To minimize tap movements and losses during low load conditions, a configuration with two parallel transformers was proposed by Zhang et al. [19], and Yuvaraj et al. [18] introduced various reactive power management strategies, including the use of a four-quadrant energy storage system with sensitivity-based voltage control, validated on an industrial feeder, and the control of parallel OLTC and PV systems. Additionally, the Cuckoo optimization technique can be applied for optimal placement of D-STATCOMs alongside DGs [18]. A coordinated voltage control strategy incorporating OLTC and generator contributions was also suggested in the study [19]. Abdel-Rehman et al. [20] improved voltage regulation by coordinating slower OLTC with faster SVCs, adjusting the reference voltage after disturbances to stabilize the system and reduce SVCs reactive power. However, this process relies exclusively on local voltage measurements and lacks optimal coordination between OLTC and SVCs. In the study [20], a multi-level model for distribution network expansion with high RERs and storage penetration was developed using Pareto-based swarm optimization to reduce costs, increase RERs integration, and enhance reliability. Furthermore, Liu et al. [21] proposed a bi-level model to allocate wind, solar, and storage in a 33-node system to minimize power purchases and losses. In the study [22], NSGA-II was used for optimal wind-BESS scheduling, and D-STATCOMs mitigated PV-induced fluctuations affecting OLTC operation [23, 24]. Voltage management through the collaboration of DGs and OLTC was examined by the study [16] by employing a distributed gradient method. In the study [25], a zoned control scheme divides the distribution network into areas, each containing OLTC and DGs. In the study [26], the focus was on optimal coordination between DGs and voltage control devices, whereas the study [17] explored the coordination of capacitors and under-load tap changer (ULTC) through a genetic algorithm to minimize switching actions. Coordination with D-STATCOMs was overlooked, and the research was confined to small balanced systems. Driven by the studies [9, 15, 23, 24], this research avoids reliance on complex optimization tools. Unlike prior research with fixed power factor DGs and hourly time frames, we analyze real-time-variant solar irradiance and load measured every 15 minutes. We use the CSA and measure OLTC switching cycles separately. This paper presents an OVR scheme for radial distribution systems by high PV saturation. OVR uses PV, D STATCOMs, batteries, and OLTC to bring voltage and loss level to the best point for the system while keeping OLTC operations low and limiting voltage deviation. It makes sure the devices work well together, stops the voltage from going out of bounds, and cuts back and forth over the limit often, which could help increase the life of the voltage regulation apparatus.
Consistent function and dependable provision remain the foremost goals of any power system. The literature highlights the standing of adequate directives in grid-connected RERs structures to enhance the voltage contour and ensure system steadiness through minimal voltage controller devices [26]. Figure 2 illustrates the drift of info required towards addressing the optimization delinquent. The subsequent subcategories detail the multifunctional optimization method suggested in this study. The OLTC, illustrated in Figure 1, stands a mechanism utilized towards control voltage by altering a twisting to meet operational requirements whereas the transformer is energized and underloaded. The oil reservoir of the transformer’s tap modifier apparatus has linking facts for adjustable shot proportions that could be certain in separate increments. The transformer’s downriver bus voltage stays improved by picking the optimal beat location, which involves 2 to 10 seconds to adjust the beat setting. The default tap settings of the OLTC are generally uniform crosswise different constructers devices, such that raising the tap position leads to an increase in the quantity of primary turns, subsequently boosting the secondary voltage of the transformer and; consequently, the voltage downstream. Contrastingly, the downstream voltage is lowered by reducing the tap area. If bus voltages endure inside admissible operating confines, the generators, transformers and reactive sources of power in the arrangement can placate the kvar load prerequisite. Yet, as soon as the bus is profoundly laden, the bus voltage might surpass the acceptable voltage pose boundary, compelling the tap to recurrently alteration its location to maintain relentless bus voltage echelons. The voltage on the operative turn proportion of the OLTC could stay articulated as in Eq. (1), by the distinct transformer taps operational perimeter. Wherever $V_{L B}^{t a p}$ and $V_{U B}^{ {tap}}$ stay the inferior and superior voltage limitations, $\mathrm{V}_{\mathrm{i}}^{{set}}$ stay the anticipated voltage level.
$\mathrm{V}_{\text {Tap}, \mathrm{i}}(\mathrm{t})= \begin{cases}\mathrm{V}_{\text {Tap,i}}(\mathrm{t }) \text { if } \mathrm{V}_{\mathrm{LB}} \leq \mathrm{V}_{\mathrm{i}}^{\text {set }}(\mathrm{t}) \leq \mathrm{V}_{\mathrm{LB}} \\ 1+\operatorname{Tap}_{\text {pos}, \mathrm{i}}(\mathrm{t}) \Delta \mathrm{V}_{\text {step}} \text { if } \mathrm{V}_{\mathrm{i}}^{\text {set }}(\mathrm{t})<\mathrm{V}_{\mathrm{LB}} \\ 1-\operatorname{Tap}_{\text {pos}, \mathrm{i}}(\mathrm{t}) \Delta \mathrm{V}_{\text {step}} \text { if } \mathrm{V}_{\mathrm{i}}^{\text {set}}(\mathrm{t})>\mathrm{V}_{\mathrm{LB}}\end{cases}$ (1)
Let it be assumed that “N” is the entire quantity of buses in a power grid, then “T” embodies the overall period, although ∆t is the time step. The power equilibrium calculation at time “t” in each bus could be inscribed for instance,
$\sum_{\mathrm{i}=1}^{\mathrm{N}} \mathrm{P}_{\mathrm{DG}_{\mathrm{i}}}(\mathrm{t})+\sum_{\mathrm{i}=1}^{\mathrm{N}} \mathrm{P}_{\mathrm{G}_{\mathrm{i}}}(\mathrm{t})=\sum_{\mathrm{i}=1}^{\mathrm{N}} \mathrm{P}_{\mathrm{Di}}(\mathrm{t})+\sum_{\mathrm{i}=1}^{\mathrm{N}} \sum_{\mathrm{j}=1}^{\mathrm{N}} \mathrm{P}_{\mathrm{ij}}(\mathrm{t})$ (2)
The distribution load flow (DLF) technique in Eq. (8) is adapted to yield DGs group into interpretation as adverse loads; henceforth, it could be inscribed for example in Eq. (11). Here, the dynamic loads are rationalized in apiece reiteration of the power stream
$\left(\mathrm{P}-\mathrm{P}_{\mathrm{DG}_{\mathrm{i}}}\right)-\mathrm{f}_{\mathrm{P}}(\mathrm{V}, \delta)=0$ (3)
The time-varying load archetypal discussed in this research combines residential, industrial and commercial loads. Hourly and 15-minute interval load variations for these models are considered in the load stream study. Real and reactive power heaps are modelled according to the equations.
$P=P_\circ\left[\propto\left(\frac{V}{V_\circ}\right)^{n_{p r}}+\beta\left(\frac{V}{V_\circ}\right)^{n_p}+\gamma\left(\frac{V}{V_\circ}\right)^{n_{p_i}}\right]$ (4)
$\mathrm{Q}=\mathrm{Q}_{\circ}\left[\propto\left(\frac{\mathrm{V}}{\mathrm{V}_\circ}\right)^{\mathrm{n}_{\mathrm{qr}}}+\beta\left(\frac{\mathrm{V}}{\mathrm{V}_\circ}\right)^{\mathrm{n}_{\mathrm{qc}}}+\gamma\left(\frac{\mathrm{V}}{\mathrm{V}_\circ}\right)^{\mathrm{n}_{\mathrm{q}_{\mathrm{i}}}}\right]$ (5)
The projected optimization method's multi-objective function in Eq. (6) seeks to maximize DGs and reduce the swapping sequences of the OLTC. Simultaneously, keeping the voltage levels inside ordinary operational restrictions to ensure power steadiness. Taking this into account, processes inspired by nature are utilized to address the optimization issue. It is important to mention that in this study, the cuckoo search algorithms have been enhanced to incorporate conditional values, referred to as the proportion of swelling voltage eccentricity to the extreme functioning boundary of OLTC.
$\begin{array}{r}\text { Minimize } \mathrm{MF}=\sum_{\mathrm{t}}^{\mathrm{T}}\left(\mathrm{P}_{\mathrm{TL}}(\mathrm{t})+\sum_{\mathrm{i}}^{\mathrm{G}} \operatorname{Tap}_{\text {tpos }, \mathrm{i}}(\mathrm{t})\right. \left.+\sum_{\mathrm{i}}^{\mathrm{N}}\left(\mathrm{V}_{\mathrm{i}}(\mathrm{t})-\mathrm{V}_{\mathrm{Ref}}\right)\right)\end{array}$ (6)
where, $\operatorname{P_{T L}}$, $\operatorname{Tap}_{\text {tpos}, i}$, $\left(\text{V}_\text{i(t)}-\text{V}_\text{Ref}\right)$ are overall power fatalities, entire tap changed location “recognized as the overall number of substituting sequences” and voltage aberrations crossways buses.
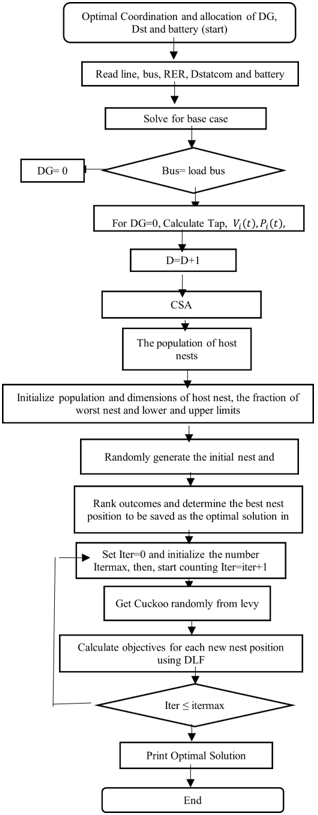
Figure 2. Overall methodology flowchart of cuckoo search algorithm (CSA)
3.1 Radial load flow
Orthodox Newton-Raphson methods and fast-decoupled load stream stand generally employed for resolving transmission systems. These approaches rely on resolving the Jacobian matrix or using the Z-matrix method. Toward resolve load stream approaches grounded on the Jacobian matrix, the contrary of the Jacobian matrix necessity be. Yet, in nearly belongings, the Jacobian matrix turns into singular due to the high resistance to reactance (R/X) percentage of distribution lines. Further, Z-matrix grounded load stream procedures require a set of calculations comparative to the sum of buses, thus demanding supplementary properties and time. This requirement led to the change of radial load flow (RLF) procedures.
The Teng technique is known as a direct approach for resolving centrifugal and faintly mesh systems. This approach is focused on building two derivative matrices: branch injection to branch current (BIBC), and branch current to bus voltage (BCBV). For circulation grids, the correspondent current inoculation constructed model structures as more practical. For bus i, the composite load $s_i$ is articulated by
$s_i=\left(P_i+j Q_i\right) i=1,2 \ldots \ldots . N$ (7)
And the conforming comparable current inoculation at the $n-t h$ reiteration of explanation is
$I_i^n=I_i^r\left(V_i^n\right)+j I_i^i\left(V_i^n\right)=\left(\frac{P_i+j Q_i}{V_i^n}\right)$ (8)
where, $V_i^n$ and $I_i^n$ are the bus voltage and equitant bus current inoculation at $n-t h$ reiteration, and $I_i^r I_i^i$ are the real and imaginary portions of the conforming current inoculation of bus at the $n$ - th reiteration, correspondingly.
The affiliation among the bus current inoculations and subdivision currents can be expressed as
$[B]=[B I B C][I]$ (9)
where, BIBC is the bus-injection to branch-current (BIBC) matrix. The relentless BIBC matrix is a superior deltoid matrix and comprises principles of 0 and 1 solitary.
Additionally, the affiliation among branch currents and bus voltages can be written as
$[\Delta V]=[B C B V][B]$ (10)
where, BCBV is the branch-current to bus-voltage (BCBV) matrix.
From Eq. (9), Eq. (10) can be inscribed as
$[\Delta V]=[B C B V][B I B C][I]$ (11)
During backward sweep, the modification in voltage w.r.t the root node V1 is calculated consuming the calculation below.
$[\Delta V]=[D L F][I]$ (12)
And the resolution for distribution load stream could advance by explaining Eq. (8) iteratively
$I_i^n=I_i^r\left(V_i^n\right)+j I_i^i\left(V_i^n\right)=\left(\frac{P_i+j Q_i}{V_i^n}\right)$ (13a)
$\left[\Delta V^{n+1}\right]=[D L F]\left[I^n\right]$ (13b)
$\left[\Delta V^{n+1}\right]=\left[V^o\right]+\left[\Delta V^{n+1}\right]$ (13c)
The conjunction principles of the Teng method remain specified as
$\begin{array}{r}\operatorname{Max}\left[\left|V_i^n\right|-\left|V_i^{n-1}\right|\right]<\text { tolerance where } n =1,2,3, \cdots N\end{array}$ (14)
3.2 Constraints
${Tap}_{ {pos}, i}^{ {min}} \leq {Tap}_{{pos}, i}(t) \leq {Tap}_{{pos, i}}^{{max}}$ (15)
$V_i^{\min } \leq V_i(t) \leq V_i^{\max }$ (16)
$Bus_2 \leq{Location}_{D G, { Dst }, B t} \leq {Bus}_N$ (17)
$P_{DG.Bt,k}^{min} \leq P_{D G, k}(t) \leq P_{D G, B t, k}^{\max }, k=1,2, \ldots, m$ (18)
$\sum_{d=1}^{N D G} P D G \leq \sum_{i=1}^{n d} P_{d i}(i)$ (19)
$Q_{{D s t, k}}^{\min } \leq P_{D s t, k}(t) \leq P_{D s t, k}^{\max}, k=1,2, \ldots, m$ (20)
$\sum_{d=1}^{N D S t} Q D s t \leq \sum_{i=1}^{n d} Q_{d i}(i)$ (21)
$C V D_{min} \leq C V D(t) \leq C V D_{max}$ (22)
$\operatorname{CVD}(t)=\sum_t^T\left(\frac{\sum_i^N\left(V_i(t)-V_{R e f}\right)_{R G}}{\sum_i^N\left(V_i(t)-V_{R e f}\right)}\right)$ (23)
3.3 Implementation of cuckoo search algorithm
This segment details how CSA is prolonged from solitary optimization towards determining multi-objective refinement for ideal provision and coordination problems of RERs addition in the power grid environment, considering practical operational requirements. Generally, the initial decree for retaining the sole refinement algorithm by one impartial function $f(x)$ is that ace egg cell is placed by respectively cuckoo and forsaken in an arbitrarily certain net (egg = nest + explanation). Aimed at multifunctional refinement, through further unity detached function $f_i(x), i \in[1,2,3, \ldots, k]$, in its place of ace egg, it is presumed that apiece cuckoo places further ace “$e g g_i, i \in[1,2,3, \ldots, k]$”, corresponding to the explanation for $f_i(x)$. In another rule, the uppermost eminence of eggs (explanation) institute in the finest nest is passed to the following peers, and so, the finest explanation for the impartial function is $\min f(x)$, whereas $\min f_i(x)$ is applied aimed at numerous impartial functions. In the past regulation of the sole impartial function, the quantity of available swarm nests is secure, whereby a swarm could determine an alien egg by a chance of “0” or “1”. If the swarm bird recognizes the cuckoo egg, whether the swarm pitches the egg or vacates the nest and sizes substitute one in a dissimilar place. Once dealing by multi-objective optimization, respective nest could be uninhibited by a level of prospect, then a novel nest by “$e g g_i, i \in[1,2,3, \ldots, k]$” is made, dependent on the variety of the eggs. The CSA tactic serves a cuckoo exploration to grip the optimization delinquent by applying dual procedures: the initial straight and works built on a levy detection, while the another is arbitrary and functions founded on the possibility for a swarm bird to notice an alien egg hip its nest. After the inhabitant’s extent constraint is secured, the superiority and stability of randomization, as well as the limited pursuit, are precisely determined by the prospect restriction. In this method, the key aim of this procedure is to substitute the deprived explanation in the nests by a novel amended resolution. This replacement process helps maintain the diversity of the population and prevents the algorithm from being trapped in local solutions during the optimization process.
$\begin{aligned} & X_i =\left[\begin{array}{c}\text {Lo}(\text {DG}, \text {Dst}, \text {Bt})_2^i, \ldots ., \text {Lo}(\text {DG}, \text {Dst}, \text {Bt})_{\text {N }}^i, \text {Pos.} T A P_1^i, \ldots, \text {Pos.} T A P_m^i \\ \text {Size} .(\text {DG}, \text {Dst})_1^i, \ldots ., \text {Size.}(\text {DG}, \text {dst})_m^i\end{array}\right], i =1,2 \ldots . N\end{aligned}$ (24)
$Lo.(D G, D s t, B t)_i=$$r o u n d\left[\operatorname{Lo}_{\text {bus} 2, d 1}^i+r\right. and \left.\times\left(\operatorname{Lo}_{\text {max}, d 1}^i-\operatorname{Lo}_{\text {bus} 2, d 1}^i\right)\right]$ (25)
$\operatorname{Pos} . T A P_i=\begin{aligned}\operatorname{round}\left[\operatorname{Pos}_{\min , d 2}^i\right. & +\operatorname{rand} \times\left(\operatorname{Pos}_{\max , d 2}^i\right. \left.\left.-\operatorname{Pos}_{\min , d 2}^i\right)\right]\end{aligned}$ (26)
$\begin{gathered} {Size.}(D G, \text {Dst}, B t)_i= {round}\left[ {Size}{ }_{\text {min,} d 3}^i+ {rand} \times \left({Size}_{ {max}, d 3}^i\right.\right. \left.\left.- {Size}_{ {min}, d 3}^i\right)\right]\end{gathered}$ (27)
The inhabitants of answers are imperiled to recurring sequences by the exploration course, and after creating novel resolutions "$x_i^{t+1}$" for a cuckoo "$i$", the Levy trip is executed. Note that afterwards respective sequence, the procedure is route to square the nests, after which respective impartial function is intended to recognize the nest by the finest aptness function to be protected as the best nest "$G^{\text {best}}$". The peers of a novel explanation (novel cuckoo eggs) via levy trip are completed consuming Eq. (24) by the extra substituted nests, founded on the excellence of novel eggs. The phase extent "$\propto$" in Eq. (28) is the remoteness among dual explanations, where this hang on the topology of space. The randomly produced number "$\eta$" is in the range of $[0,1] ; \Gamma$ is a gamma circulation function; $\Delta X_i^{\text {new}}$ is an improved worth and could regulate with Eq. (29), wherever $\eta_x$ and $\eta_y$ remain generally spread stochastic variables per usual deviation $\sigma_x(\lambda)$, as articulated in Eq. (28) and $\sigma_y(\lambda)=1$, respectively. The Levy trips occur detailed to pursuit close the answer, trailed in a large step in the extended track, signified thru dispersal aspect "$\lambda$".
$X_d^{\text {new}}=X_d^{\text {best}}+\propto\times \eta \times \Delta X_i^{\text {new}}, \quad\left\{\begin{array}{c}-1<\eta \leq 1 \\ \propto>0\end{array}\right.$ (28)
$\begin{aligned} \Delta X_i^{\text {new}}= & \left(\frac{\eta_x}{\left|\eta_y\right|^{1 / \lambda}}\right) \times\left(\frac{\sigma_x(\lambda)}{\sigma_y(\lambda)}\right) \times\left(X_i^{\text {best}}-G_i^{\text {best}}\right),\{1<\lambda \leq 3\}\end{aligned}$ (29)
Active and reactive power losses reduced significantly by integrating batteries into the system the planned arrangement achieves a maximum voltage regulation in a real-time distribution system by DGs and D-STATCOMs. Further, it can be observed that by incorporating batteries is lowest at the 7th hour than highest by the 18th hour on the day-to-day load curve. To accommodate unexpected load variations, batteries are integrated into the system to mitigate stress on voltage-regulating devices and enhance the voltage profile across all buses.
$\sigma_x(\lambda)=\left|\frac{\Gamma(1+\lambda) \sin \left(\frac{\pi \lambda}{2}\right)}{\Gamma\left(\left(\frac{1+\lambda}{2}\right) \lambda \times 2^{\left(\frac{\lambda-1}{2}\right)}\right)}\right|^{\frac{1}{\lambda}}$ (30)
$X_d^{\text {new}}=\left[\begin{array}{c}\operatorname{rand}\left[X_{d 1}^{\text {new}}\right], \operatorname{rand}\left[X_{d 2}^{\text {new}}\right], \\ \operatorname{rand}\left[X_{d 3}^{\text {new}}]\right.\end{array}\right], \operatorname{rand}\left[X_{d 4}^{\text {new }}\right]$ (31)
${Lo. DG, Dst, Bt}_{d 1}^{\text {lim}}$$= \begin{cases}2 \ {if}\ L o . R G_{d 1}<2 \\ L o_{max , d 1} \ { if }\ L o_{d 1}>L o_{\max , d 1} \\ { Lo.DG }_{d 1} {otherwise}\end{cases}$ (32)
${Pos.TAP}_{d 2}^{\text {lim}}=\left\{\begin{array}{c}\text {Pos.TAP}{ }_{\text {min}, d 2} \text { if Pos.} T A P_{d 2}<\text {Pos.} T A P_{\min , d 2} \\ \text {Pos.} T A P_{\text {max }, d 2} \text { if Pos. } T A P_{d 2}>\text { Pos. } T A P_{\text {max }, d 2} \\ \text {Pos.} \text {TAP}_{d 2} \text { otherwise }\end{array}\right.$ (33)
${Size. DG, Dst, bt }_{d 3}^{\text {lim}}=\left\{\begin{array}{c}\text {Size}_{m i n, d 3} \text { if Size}_{d 3}<\text {Size}_{m i n, d 3} \\\text { Size}_{m a x, d 3} \text { if Size}_{d 3}>\text {Size}_{m a x, d 3} \\\text { Size.} D G_{d 3} \text {otherwise}\end{array}\right.$ (34)
$\begin{aligned} & \text {Co}_{\text {rbest.} D G, \text {Dst}, \text {bt}}{ }_{d 4}^{\lim }= \left\{\begin{array}{l}\text {Co}_{\text {rbestmin,d4 }} \text { if } \text {Co}_{\text {rbest} d 4}<\text {Co}_{\text {rbest}_{\text {max}, d 4}} \\ \text {Co}_{\text {rbest} \text {max}, d 4} \text { if } \text {Co}_{\text {rbest} d 4}>\text {Co}_{\text {rbest}_{\text {max}, d 4}} \\ \text {Co}_{\text {rbest}} . \text {DG}, \text {Dst}, \text {Bt}{ }_{d 4} \text { otherwise}\end{array}\right.\end{aligned}$ (35)
In the concluding phase, where the host bird will notice the alien eggs, standing eggs will stay replaced by high-quality newly generated eggs from their current positions, as stated in Eq. (35). The novel improved rate " $\Delta X_i^{\text {new}}$" can be resolute by means of Eq. (36). The rationalized coefficient "K" is resolute grounded on the possibility of the host bird noticing the unacquainted eggs on its nest. $\eta_{p 1}$ and $\eta_{p 2}$ are the arbitrary agitation for nests sites of the $X_i^{\text {best }}$.
$\begin{aligned} & X_i^{ {new}}=X_i^{ {best}}+K \times \Delta X_i^{ {new}}, \\ & K=\left\{\begin{array}{l}1 \ { if\ rand }<P_a \\ 0, \ { otherwise }\end{array}\right.\end{aligned}$ (36)
$\Delta X_i^{\text {new}}=\eta \times\left[\eta_{p 1}\left(X_i^{\text {best}}\right)-\eta_{p 2}\left(X_i^{\text {best}}\right)\right]$ (37)
The inferior and better parameters of apiece novel explanation would content the redefined limitations in Eqs. (31)-(34). Therefore, the CSA is routed to check the nests, afterwards which respective impartial function of Eq. (6) is intended to gain the finest worth of apiece nest $X^{\text {best}}$, and the nest alike the finest aptness rate is usual near the finest nest $G^{\text {best}}$. The phases of producing novel cuckoos by Levy trip and the detection on alien eggs remain repeatedly executed till triumph the extreme iteration. Figure 2 presents the step-by-step flow chart of methodology adopted in this study based on CSA.
4.1 Performance assessment of standard IEEE 33-bus system
The anticipated process is verified on a 33-bus distribution system featuring a single OLTC located at bus 1, with a capacity of 3 MW and a voltage of 12.66 kV. The arrangement has a load size of 3.715 MW and 2.3 MVar. Additionally, the distribution network includes three DGs, three D-STATCOMs and three batteries, which are all strategically sized and positioned for optimal performance. In accordance with regulatory requirements, the permissible voltage range is between 0.90 and 1.05 p.u., and the OLTC tuning range is from -5% to +10% in 2.5% increments. Consequently, voltage adjustments using the OLTC occur in seven steps (six positions), ensuring synchronized regulation between these devices: to facilitate seamless distribution system operation; to maintain voltage levels within allowed ranges; and to diminish power losses and OLTC cycles. The size of the DGs, batteries and D-STATCOMs is limited to from 5 to 1000 kW and kVar. The simulation results are compared to checking the effectiveness of the proposed method.
Base case power flow check done using RLF. When this type of check is made the volt shape and energy loss show up, and these limits move to the electrical control system (ECS) display item for potential pre-warning actions through the remote terminal device. The lowest voltage in the scenario is 0.9091 p. u. If the control units are not set to go on, the worst voltage is under 1 p.u., which is not what the law calls for.
4.2 OLTC, DGs and D-STATCOMs
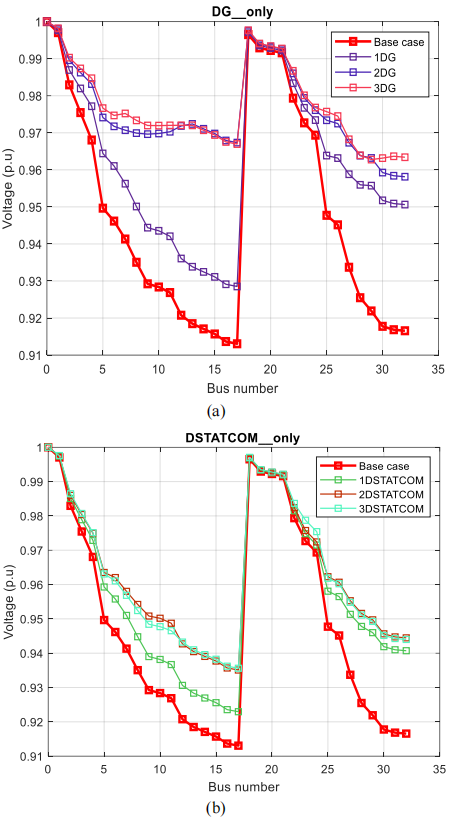
This section provides a brief overview of the integration results of DGs and D-STATCOMs with OLTC. In this case, the OLTC procedure is turned off. The minima voltage noted was 0.93 p.u with DGs and 0.92 p.u with D-STATCOM. Simulation results show that for enhancement of the voltage profile, the installation of more than one DG or D-STATCOM is essential. Comparative study reveals that our strategy is quite efficient, as can be seen from Figure 3(a) and (b).
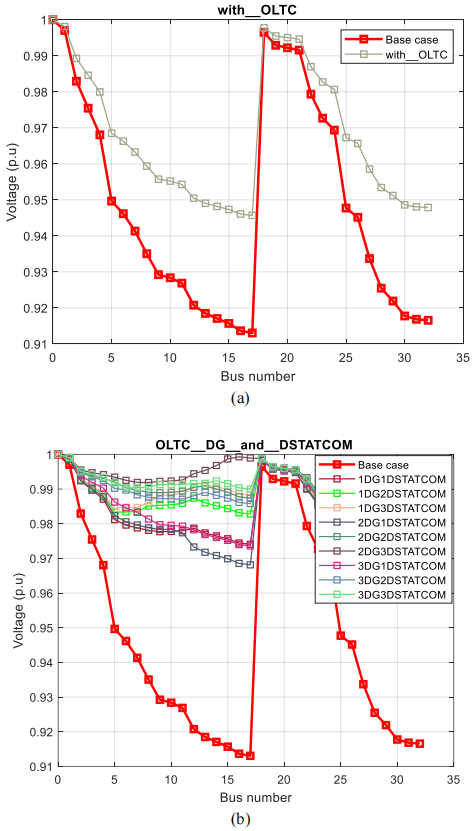
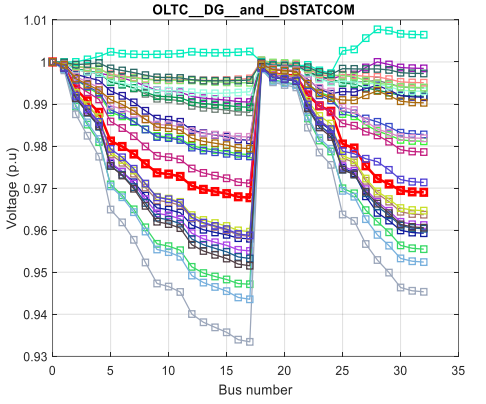
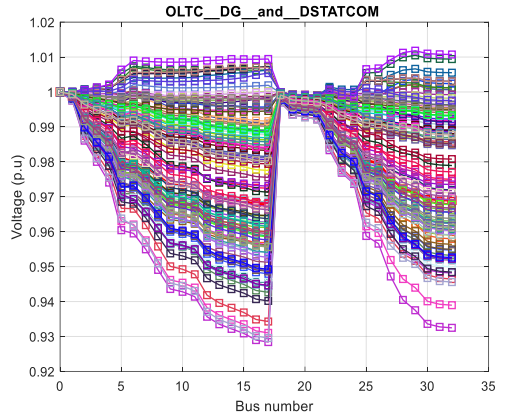
To test the system in real time, OLTC is turned on, and DGs and D STATCOMs are off. This lets us see what OLTC can do to control voltage. OLTC can change the voltage from 5 less to 10 more than the lowest voltage, with four steps for raising the voltage and two for lowering it. The ideal tap location, determined as "5" for the base case, is chosen to maintain voltage within permissible limits. Simulation results indicate that OLTC action alone is insufficient to maintain the voltage within acceptable limits. Although activating OLTC slightly enhances the voltage profile as shown in Figure 4(a), this remains close to threshold limits, risking non-compliance with increased load demand. Operators can then activate reactive power recompensing devices to assist OLTC in voltage control, showing significant improvement in voltage profile in Figure 4 (b).
Figure 3. Voltage profile with (a) DGs only (b) D-STATCOMs only
Figure 4. Voltage profile with (a) OLTC only (b) OLTC, DGs and D-STATCOMs
4.3 Optimum coordination of OLTC, DGs, and D-STATCOM in distribution systems with real-time load and solar irradiance
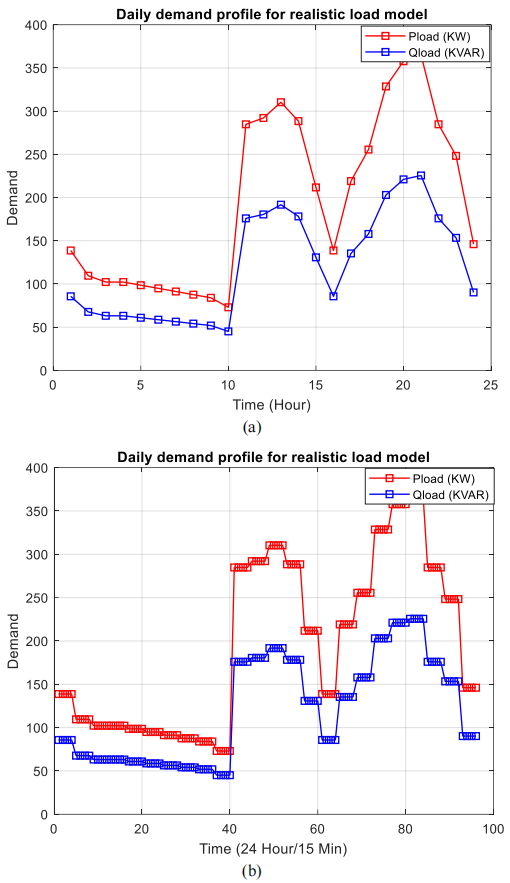
This segment presents voltage profile and forfeiture minimization for the IEEE 33-bus representative time-varying distribution arrangement with the incorporation of DGs, D-STATCOMs with OLTC. The real time-varying day-to-day load curve of the examination system, by time intervals of 1 hour and 15 minutes, is revealed in Figure 5. It can be detected from the regular load curve that the minutest load of 2165 + j1422 kVA occurs at the 7th hour, with the peak load of 4641 + j2741 kVA occurring at the 18th hour. Numerous faithful circumstances are replicated in this study on a 33-bus time-varying distribution system.
Figure 5. Daily realistic time-varying demand profile (a) hourly; (b) 15-minute interval
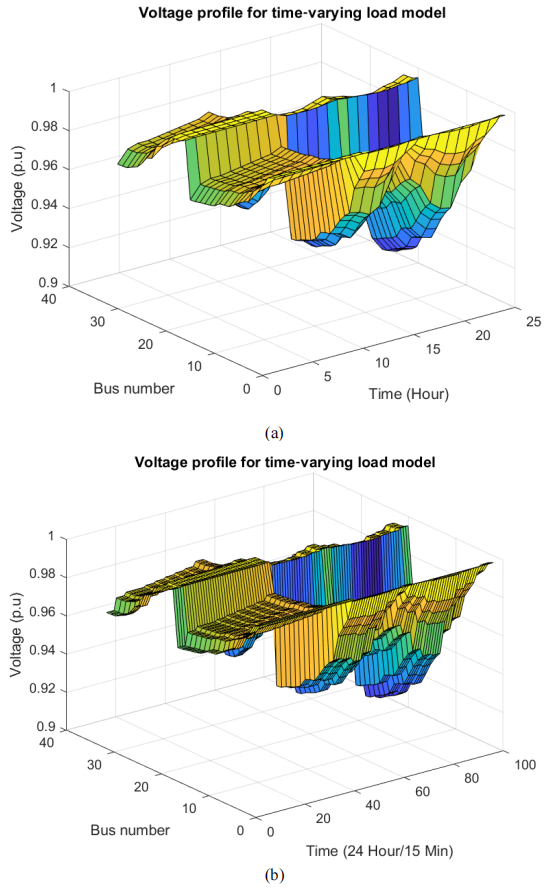
Figure 6(a) and (b) demonstrate the base case voltage contour deprived of all voltage control devices, representing that it falls outside the acceptable range. However, afterwards activating the voltage regulation devices by designed modified CSA, the voltage contour is upheld inside the acceptable range all over the distribution network, as shown in Figure 7 hourly and Figure 8 for 15-minute intervals.
Figure 6. Voltage profile for time-varying load (a) hourly; (b) 15-minute interval
Figure 7. Hourly voltage profile after optimal coordination
Figure 8. 15-minute intervals voltage profile after optimal coordination
The situation can be detected that the voltage profile is better during the daytime, and a little underneath adequate limits throughout night-time due to solar generation disconnection. With OLTC action alone, numerous switching operations are obligatory to sustain voltage within the safe operational limits set by the network operative. However, appropriate synchronization between OLTC and D-STATCOM minimizes the number of OLTC switching cycles revealed in Table 1.
Table 1. On-load tap changing transformers (OLTC) operation cycles
|
Time |
OLTC Cycle without Batteries |
OLTC Cycle with Batteries |
|
24 hours |
130 |
143 |
|
15 minutes intervals |
365 |
372 |
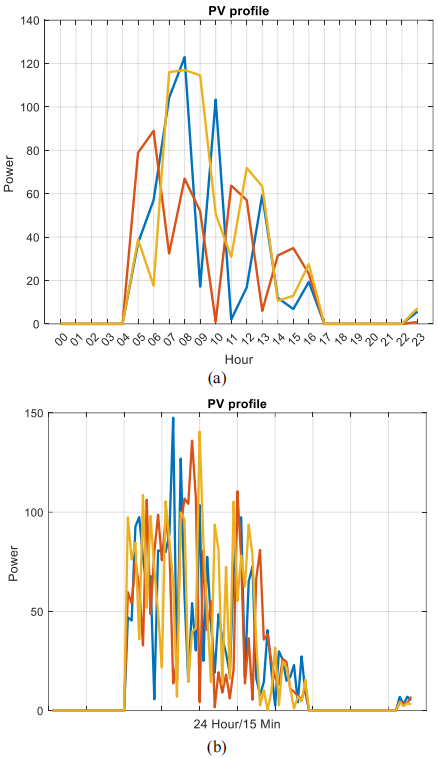
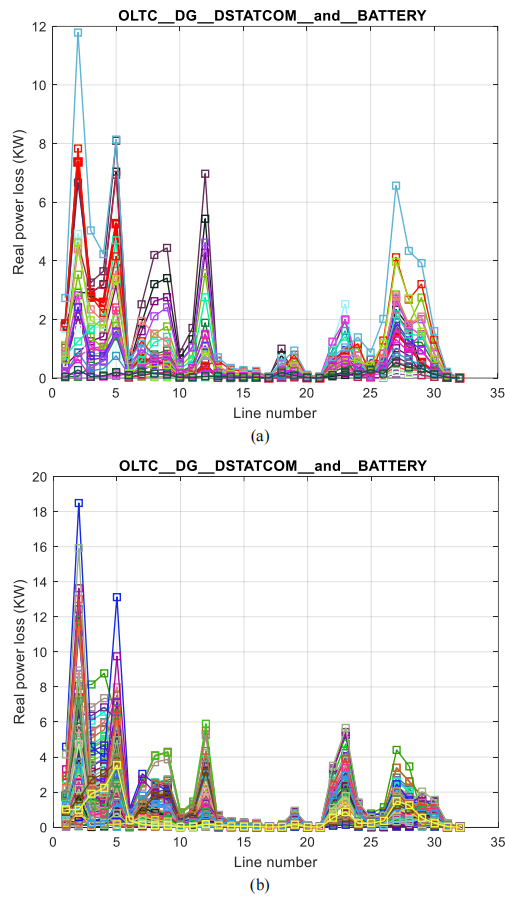
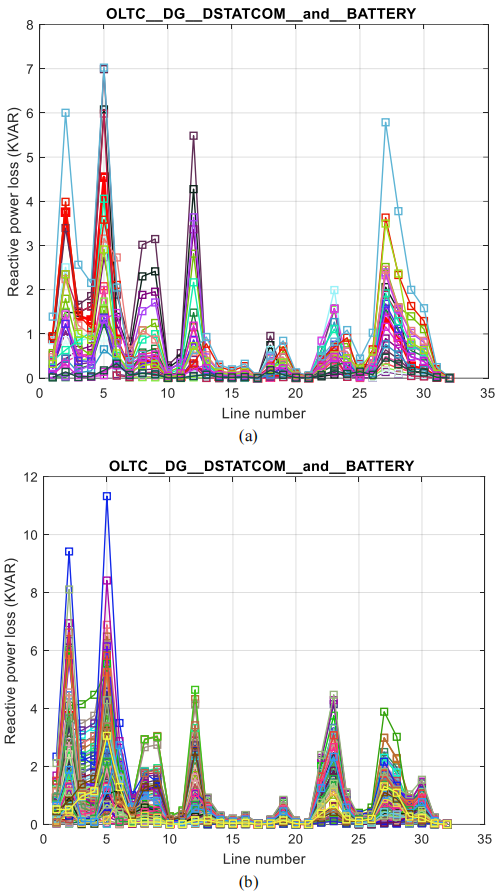
The ideal position and evaluation of each control device are resolute at hourly and 15-minute intervals for regular load cycles using the anticipated method: to adjust voltage within required limits, to abate power loss, and to condense switching operations. Accordingly, the incorporation of DGs and D-STATCOMs results in minimal energy loss, voltage deviation and OLTC switching operations. The real-time solar generation power output is shown Figure 9. While the total real and reactive power losses, curves for 24 hours and 15-minute intervals, are shown in Figures 10 and 11.
Figure 9. PV power (a) hourly; (b) 15-minute interval
Figure 10. Active power losses with OLTC, DGs, D-STATCOMs and batteries (a) hourly; (b) 15-minute interval
Figure 11. Reactive power losses with OLTC, DGs, D-STATCOMs and batteries (a) hourly; (b) 15-minute interval
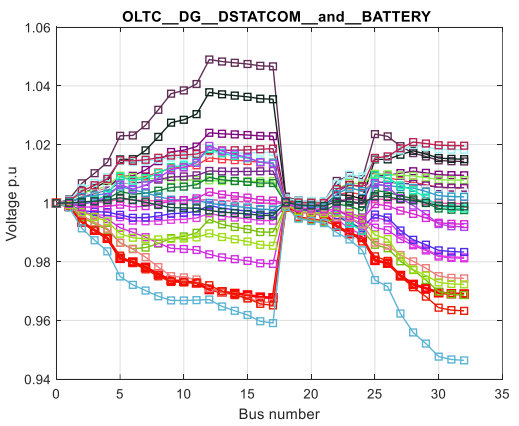
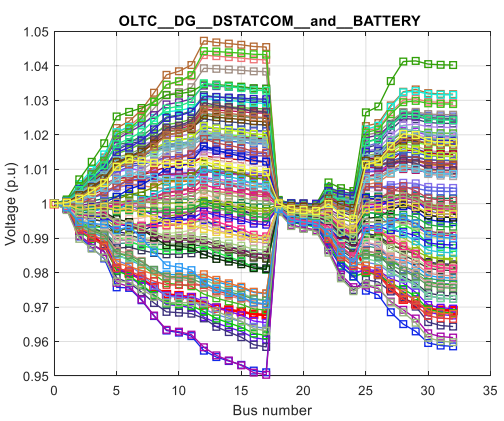
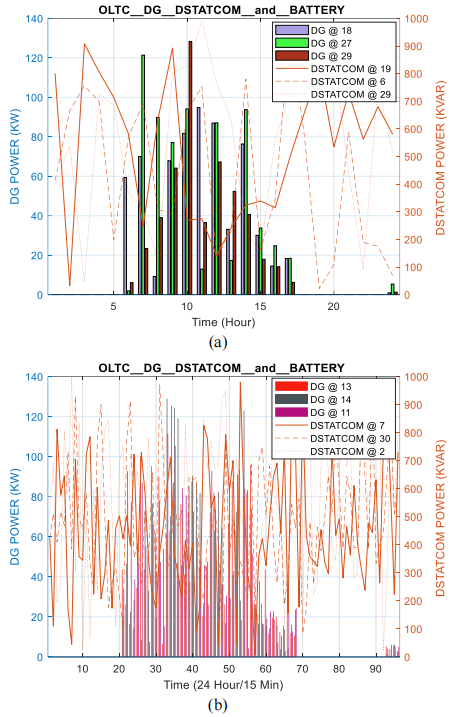
Active and reactive power losses reduced significantly by integrating batteries into the system the planned arrangement achieves a maximum voltage regulation in a real-time distribution system by DGs and D-STATCOMs. Further, it can be observed that by incorporating batteries is lowest at the 7th hour than highest by the 18th hour on the day-to-day load curve. To accommodate unexpected load variations, batteries are integrated into the system to mitigate stress on voltage-regulating devices and enhance the voltage profile across all buses. As shown in Figure 12 for 24 hours and Figure13 for 15-min intervals, the voltage profile improves significantly with integration of batteries and remains more uniform across the network. The optimal locations and sizing results of DGs and D-STATCOMs under hourly and 15-minute operating intervals are presented in Figure 14.
Figure 12. Hourly voltage profile after optimal coordination with batteries
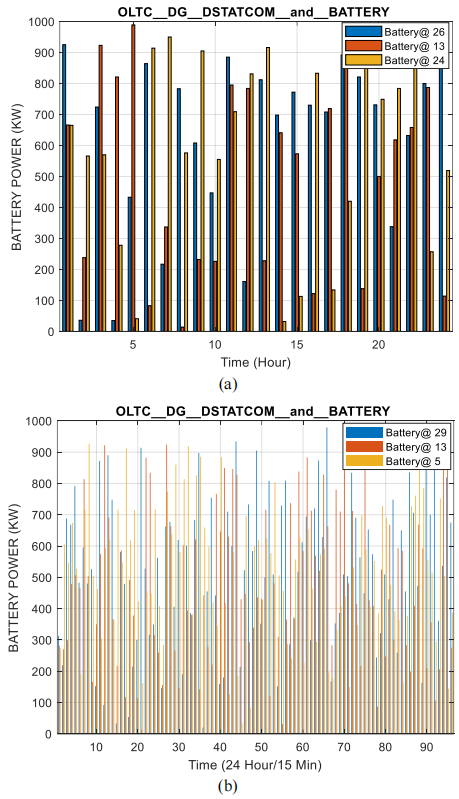
Similarly, the optimal battery locations and sizes for different buses at both hourly and 15-minute intervals are illustrated in Figure 15(a) and (b).
Figure 13. 15-minute intervals voltage profile after optimal coordination with batteries
Figure 14. DGs and D-STATCOMs sitting and sizing (a) hourly; (b) 15-minute interval
Figure 15. Batteries sitting and sizing (a) hourly; (b) 15-minute interval
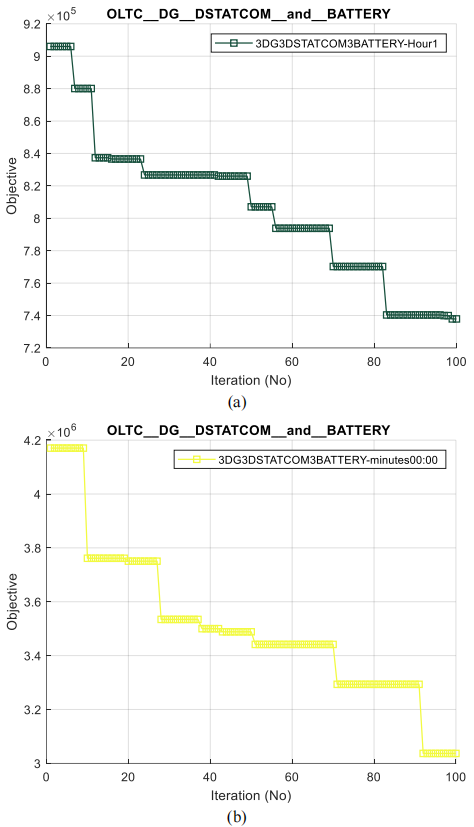
Figure 16 shows the convergence behavior of multi-objective CSA under hourly and 15-minute operating intervals.
Figure 16. Fitness function convergence with OLTC, DGs, D-STATCOMs and batteries (a) hourly; (b) 15-minute interval
This study presented a two-timescale OVR scheme using a modified CSA to coordinate OLTC, DGs, D-STATCOMs, and batteries in active distribution networks. Validated on the IEEE 33-bus system with realistic hourly and 15-minute load/solar profiles, the proposed approach effectively maintains voltage within permissible limits while minimizing power losses and OLTC switching cycles.
|
BIBC |
bus-injection to branch-current |
|
BCBV |
the branch-current to bus-voltage |
|
OVR |
optimal voltage regulation |
|
VVC |
Volt/VAR control |
|
CBs |
capacitor banks |
|
RLF |
radial load flow |
|
Greek symbols |
|
|
$\Delta \mathrm{t}$ |
time step |
|
T |
overall period |
|
N |
entire quantity of buses |
|
R/X |
high resistance to reactance |
|
µ |
dynamic viscosity, kg. m-1.s-1 |
|
Subscripts |
|
|
$V_i^n$ |
bus voltage |
|
$I_i^n$ |
bus current |
|
$I_i^r I_i^i$ |
real and imaginary portions |
|
$\mathrm{P}_{\mathrm{TL}}$ |
overall power fatalities |
|
$\operatorname{Tap}_{\text {tpos }, i}$ |
entire tap changed location |
|
$\begin{aligned} & \left(\mathrm{V}_{\mathrm{i}}(\mathrm{t})\right. \left.-\mathrm{V}_{\mathrm{Ref}}\right)\end{aligned}$ |
voltage aberrations crossways buses |
[1] Sambaiah, K.S., Jayabarathi, T. (2021). Optimal reconfiguration and renewable distributed generation allocation in electric distribution systems. International Journal of Ambient Energy, 42(9): 1018-1031. https://doi.org/10.1080/01430750.2019.1583604
[2] Szinai, J.K., Sheppard, C.J.R., Abhyankar, N., Gopal, A.R. (2020). Reduced grid operating costs and renewable energy curtailment with electric vehicle charge management. Energy Policy, 136: 111051. https://doi.org/10.1016/j.enpol.2019.111051
[3] Reddy, P.D.P., Reddy, V.C.V., Manohar, T.G. (2017). Whale optimization algorithm for optimal sizing of renewable resources for loss reduction in distribution systems. Renewable: Wind Water and Solar, 4(1): 3. https://doi.org/10.1186/s40807-017-0040-1
[4] Ruan, H., Gao, H., Liu, Y., Wang, L., Liu, J. (2020). Distributed voltage control in active distribution network considering renewable energy: A novel network partitioning method. IEEE Transactions on Power Systems, 35(6): 4220-4231. https://doi.org/10.1109/TPWRS.2020.3000984
[5] Dhulipala, S.C., Monteiro, R.V.A., Silva Teixeira, R.F.D., Ruben, C., Bretas, A.S., Guimaraes, G.C. (2019). Distributed model-predictive control strategy for distribution network Volt/VAR control: A smart-building-based approach. IEEE Transactions on Industry Applications, 55(6): 7041-7051. https://doi.org/10.1109/TIA.2019.2941179
[6] Antoniadou-Plytaria, K.E., Kouveliotis-Lysikatos, I.N., Georgilakis, P.S., Hatziargyriou, N.D. (2017). Distributed and decentralized voltage control of smart distribution networks: Models, methods, and future research. IEEE Transactions on Smart Grid, 8(6): 2999-3008. https://doi.org/10.1109/TSG.2017.2679238
[7] Zhang, B., Lam, A.Y.S., Dominguez-Garcia, A.D., Tse, D. (2015). An optimal and distributed method for voltage regulation in power distribution systems. IEEE Transactions on Power Systems, 30(4): 1714-1726. https://doi.org/10.1109/TPWRS.2014.2347281
[8] Sheng, W., Liu, K., Cheng, S. (2014). Optimal power flow algorithm and analysis in distribution system considering distributed generation. IET Generation, Transmission & Distribution, 8(2): 261-272. https://doi.org/10.1049/iet-gtd.2013.0389
[9] Ali, H.K., Haidar, A.M.A., Julai, N., Helwig, A. (2024). Voltage regulation planning based on optimal grid-connected renewable energy allocation using nature-inspired algorithms to reduce switching cycles of on-load tap changing transformers. Electric Power Components and Systems, 52(1): 146-171. https://doi.org/10.1080/15325008.2023.2215783
[10] Borozan, V., Baran, M.E., Novosel, D. (2001). Integrated volt/VAr control in distribution systems. Proceedings of the IEEE Power Engineering Society Winter Meeting, Columbus, OH, USA, pp. 1485-1490. https://doi.org/10.1109/PESW.2001.917328
[11] Kim, Y.J., Kirtley, J.L., Norford, L.K. (2015). Reactive power ancillary service of synchronous DGs in coordination with voltage control devices. IEEE Transactions on Smart Grid. https://doi.org/10.1109/TSG.2015.2472967
[12] Najar, I.A., Ahmadi, R., Mourad, R., Khan, N.A., Kour, R., Asif, S. (2026). Site specific geophysical-geotechnical integration: Correlating ERT and SPT for subsurface characterisation. Journal of Petroleum Exploration and Production Technology, 16(7): 42. https://doi.org/10.1016/j.compeleceng.2019.106461
[13] Sridhar, J.P., Prakash, R. (2019). Multi-objective whale optimization-based minimization of loss, maximization of voltage stability considering cost of DG for optimal sizing and placement of DG. International Journal of Electrical and Computer Engineering, 9(2): 835-839. https://doi.org/10.11591/ijece.v9i2
[14] Abdelsattar, M., Hamed, A.M.A.E., Elbaset, A.A., Kamel, S., Ebeed, M. (2022). Optimal integration of photovoltaic and shunt compensator considering irradiance and load changes. Computers and Electrical Engineering, 97: 107658. https://doi.org/10.1016/j.compeleceng.2021.107658
[15] Kamal, H.A., Afrouzi, H.N., Jayamani, E., Ektesabi, M., Siang, C.H., En, L.H. (2024). Optimal voltage regulator coordination via cuckoo search algorithm in distributed generation system to enhance grid stability. In 2024 IEEE Sustainable Power and Energy Conference (iSPEC), Kching, Sarawak, Malaysia, pp. 687-691. https://doi.org/10.1109/iSPEC59716.2024.10892484
[16] Fallahzadeh-Abarghouei, H., Nayeripour, M., Hasanvand, S., Waffenschmidt, E. (2017). Online hierarchical and distributed method for voltage control in distribution smart grids. IET Generation, Transmission & Distribution, 11(5): 1223-1232. https://doi.org/10.1049/iet-gtd.2016.1096
[17] Aryanezhad, M. (2018). Management and coordination of LTC, SVR, shunt capacitor and energy storage with high PV penetration in power distribution system for voltage regulation and power loss minimization. International Journal of Electrical Power & Energy Systems, 100: 178-192. https://doi.org/10.1016/j.ijepes.2018.02.015
[18] Yuvaraj, T., Ravi, K., Devabalaji, K.R. (2017). Optimal allocation of DG and D-STATCOMs in radial distribution system using cuckoo search optimization algorithm. Modelling and Simulation in Engineering, 2017(1): 2857926. https://doi.org/10.1155/2017/2857926
[19] Zhang, Y., Xu, Y., Srivastava, A.K., Liu, C.C. (2017). Voltage control strategy in distribution system with energy storage and distributed generations. In Proceedings of the IEEE Industry Applications Society Annual Meeting, Cincinnati, OH, USA, pp. 1-8. https://doi.org/10.1109/IAS.2017.8101784
[20] Abdel-Rahman, M.H., Youssef, F.M.H., Saber, A.A. (2006). New static var compensator control strategy and coordination with under-load tap changer. IEEE Transactions on Power Delivery, 21(3): 1630-1635. https://doi.org/10.1109/TPWRD.2005.858814
[21] Liu, X., Aichhorn, A., Liu, L., Li, H. (2012). Coordinated control of distributed energy storage system with tap changer transformers for voltage rise mitigation under high photovoltaic penetration. IEEE Transactions on Smart Grid, 3(2): 897-906. https://doi.org/10.1109/TSG.2011.2177501
[22] Yan, R., Marais, B., Saha, T.K. (2014). Impacts of residential photovoltaic power fluctuation on on-load tap changer operation and a solution using D-STATCOMs. Electric Power Systems Research, 111: 185-193. https://doi.org/10.1016/j.epsr.2014.02.020
[23] Lim, H., Jo, J., Chun, K.H. (2025). Optimal on-load tap changer tap control method for voltage compliance rate improvement in distribution systems, based on field measurement data. Energies, 18(2): 439. https://doi.org/10.3390/en18020439
[24] Maataoui, Y., Chekenbah, H., Boutfarjoute, O., Puig, V., Lasri, R. (2023). A coordinated voltage regulation algorithm of a power distribution grid with multiple photovoltaic distributed generators based on active power curtailment and on-line tap changer. Energies, 16(14): 5279. https://doi.org/10.3390/en16145279
[25] Yang, M., Guo, L., Liu, Y., Li, X., Wang, Z., Zhang, Y., Wang, C. (2025). Data-driven static voltage chance constrained security region modeling and application for MV DNs with high PV penetration. Applied Energy, 392: 125978. https://doi.org/10.1016/j.apenergy.2025.125978
[26] Meng, L., Yang, X., Zhu, J., Wang, X., Meng, X. (2024). Network partition and distributed voltage coordination control strategy of active distribution network system considering photovoltaic uncertainty. Applied Energy, 362: 122846. https://doi.org/10.1016/j.apenergy.2024.122846