Eni Heni Hermaliani*![]() | Ahmad Zainul Fanani
| Ahmad Zainul Fanani![]() | Heru Agus Santoso
| Heru Agus Santoso![]() | Affandy
| Affandy![]()
© 2026 The authors. This article is published by IIETA and is licensed under the CC BY 4.0 license (http://creativecommons.org/licenses/by/4.0/).
OPEN ACCESS
Predicting student academic performance in Learning Management Systems (LMS) is challenged by class imbalance and the "black-box" nature of many high-accuracy models, limiting their practical adoption in educational settings. This study proposes an explainable stacking ensemble framework that integrates heterogeneous base learners—k-nearest neighbors (KNN), random forest (RF), extra trees (ET), XGBoost, and LightGBM—with a Logistic Regression (LR) meta-learner for transparent aggregation. To address class imbalance, a hybrid SMOTE-ENN resampling strategy is applied exclusively within training folds under stratified 5-fold cross-validation (CV), preventing data leakage. Model interpretability is achieved through Shapley Additive Explanations (SHAP), providing both global feature importance and local prediction explanations. Experiments were conducted on the Kalboard 360 benchmark dataset (480 instances, 16 features), which exhibits natural class imbalance across three performance levels (High: 29.58%, Medium: 43.95%, Low: 26.45%). The proposed framework achieves an accuracy of 96.57%, precision of 96.34%, recall of 93.26%, and F1-score of 94.40%, outperforming individual classifiers and homogeneous ensembles. Low fold-wise variance confirms stability across validation splits. Wilcoxon signed-rank tests (α = 0.05) indicate no statistically significant difference between the proposed model and baseline classifiers, though the stacking framework consistently achieves the highest mean scores. SHAP analysis reveals that behavioral engagement features—particularly student absence days and visited resources—dominate predictions, while demographic attributes contribute negligibly. The framework supports early warning analytics and educator-oriented intervention strategies as a modular decision-support component for LMS-based educational information systems. These findings demonstrate that combining stacking ensembles with leakage-safe resampling and SHAP-based explainability offers a practical, interpretable solution for student performance prediction.
student performance prediction, stacking ensemble, SMOTE-ENN, Explainable Artificial Intelligence, SHAP, Learning Management Systems
The growing digitization of education has altered traditional learning environments by including Learning Management Systems (LMS). LMS platforms make learning content distribution easier and allow for the systematic collection of behavioral data, such as login frequency, time spent on learning modules, and activity completion rates [1, 2]. This information opens up many doors for Educational Data Mining (EDM), a field that uses data mining methods to learn more about students and how they learn [3].
Recent advances in machine learning have shown promising results in predicting student academic outcomes, enabling timely and personalized interventions [4]. Different challenges, though, make predictive models useless in the classroom. First, class imbalance where high-performance students outshine failing or at-risk children is common in educational databases. This bias causes models to favor majority classes and overlook minority trends, reducing early-warning effectiveness [5]. Secondly, while complex models like ensemble methods (e.g., stacking, boosting, bagging) deliver higher accuracy, they often act as "black boxes"—provides little to no insight into how predictions are produced [6]. In the context of education, where trust, transparency, and accountability are critical, insufficient interpretability may impede acceptance by stakeholders, including educators, parents, and legislators [7]. Thus, a growing demand exists for interpretable and Explainable Artificial Intelligence (XAI) approaches that preserve model performance while making outcomes understandable [8].
This study proposes a stacking ensemble with Logistic Regression (LR) as a transparent meta-learner, enabling interpretable aggregation of heterogeneous classifiers while preserving interpretability. Shapley Additive Explanations (SHAP) allocates a contribution value to each feature for a given prediction, enabling both local (instance-level) and global (dataset-level) explanations [9]. This research also addresses class imbalance using Synthetic Minority Over-sampling Technique – Edited Nearest Neighbors (SMOTE-ENN), a hybrid resampling method that combines over-sampling of minority classes with noise reduction through edited nearest neighbors [10]. The framework is optimized using Grid Search and evaluated with stratified 5-fold cross-validation (CV), ensuring competitive and generalizable performance.
Kaggle xAPI-Edu-Data in Kalboard 360 (https://www.kaggle.com/aljarah/xAPI-Edu-Data, accessed June 8, 2023) offers the data needed for this research. Its parts related to student involvement and academic performance are behavior-driven. Its pragmatic base makes it ideal for developing interpretable models pertinent to learning environments in the real world. This research aims to: 1) create a highly competitive predictive model using stacking ensemble learning, 2) effectively address class imbalance through hybrid resampling SMOTE-ENN, 3) improve interpretability through SHAP for local and global explanations, and 4) identify and analyze critical behavioral features that impact academic performance.
This work contributes to the literature of EDM and learning analytics in four major ways:
Beyond predictive accuracy, this framework is explicitly conceived as a decision-support component for LMS-based educational information systems. By integrating a transparent meta-learner with SHAP-based explanations and leakage-safe resampling, the framework supports deployment scenarios that require institutional trust, accountability, and data governance.
Predicting student academic performance has become a key research direction in EDM and Learning Analytics, particularly as the adoption of LMS increases across formal and informal learning environments. LMS creates detailed behavioral traces, like logins, resource visits, assignment submissions, and participation in discussion forums, that can be used to model student involvement and learning progress based on data [11, 12].
Dogan et al. [13] earlier surveys showed that classical machine learning methods performed well for predicting academic success. A recent study found that behavior and relationships are more important than demographic traits for making accurate predictions [14-16]. These results show how important it is to include behavior-driven indicators in LMS-based predictive models and to select and analyze them properly.
Traditional machine learning models, including decision trees (DT), LR, and support vector machines (SVMs), have been widely used for academic performance classification. These models are easy to understand and use, but they do not always work well when dealing with LMS data that is different from one another. Recent work has focused on ensemble-based learning as a solution to this problem, using bagging, boosting, and stacking to combine multiple models. Ensembles frequently achieve better results than individual models in educational datasets, according to earlier studies. This is particularly the case when there are interaction effects or nonlinear correlations in the student's behaviors [17, 18]. Nonetheless, ensemble models often behave as "black boxes," limiting their suitability for educational settings where transparency, trust, and accountability are essential for adoption by instructors and policymakers [19].
To resolve interpretability challenges, XAI has gained substantial attention in the EDM community. At the same time, XAI addresses the black-box nature of prediction models [19] and enhances their performance by leveraging multidimensional behavioral, motivational, and demographic data to uncover patterns that traditional methods cannot. Artificial Intelligence (AI)-driven models can combine several types of data, such as simulation logs, engagement scores, and test outcomes, to provide you with individualized feedback and predictions [20]. SHAP and LIME are two techniques that have been shown to help determine the importance of features and model logic, thereby building confidence and ensuring that AI is used ethically in schools [21]. This transparency is especially critical in high-stakes settings where decisions based on algorithmic predictions must be justifiable. SHAP provides one of the most powerful model-agnostic frameworks for decomposing predictions into additive feature contributions. SHAP has been successfully used to identify important learning behaviors and provide interpretable explanations at both global and local levels [22]. For instance, SHAP was used by Swamy et al. [23] to understand dropout rates and by Tong and Li [24] to analyze logs of massive open online course (MOOC) enrollment.
The foregoing review reveals a consistent pattern across three interconnected research directions — ensemble learning, class imbalance handling, and XAI — each of which has advanced substantially in isolation but has rarely been integrated into a coherent, system-oriented architecture for LMS environments. The following critical gaps emerge from this analysis.
Notwithstanding these gains, some significant deficiencies persist. First, most previous ensemble-based EDM studies either ignore class imbalance or treat it superficially, even though imbalance is endemic in educational data (with more high-performing than at-risk students). Only a few works explore hybrid resampling, such as SMOTE-ENN, and even fewer apply them rigorously within cross-validation folds [5, 25]. Second, even though more and more people are using SHAP, it is most often used as a post-hoc analysis rather than as part of a single prediction pipeline. This can lead to explanations that do not fit with the techniques used to optimize models. Third, earlier research has rarely examined the stability and reliability of SHAP explanations, which is a key need for real-world LMS deployment, as model transparency must be consistent across different data splits and student cohorts. Fourth, limited research offers a systemic architecture perspective, incorporating ensemble modeling and explainability as functional components within an academic decision-support system.
No previous research has explicitly built an architecture for LMS decision-support processes that combines stacking ensemble learning, full SHAP-based interpretability, and hybrid class-imbalance handling via SMOTE-ENN synthesis (see Table 1). Furthermore, the current literature seldom situates models within an information systems context, which limits their usefulness for actual institutional implementation. Using a modular, deployment-aware architecture that views explanation, imbalance handling, and prediction as co-designed functional components inside an LMS-based academic information system, this study fills these overlapping gaps.
Table 1 summarizes the methodological distinctions between the proposed framework and representative prior studies. The study shows four major gaps: (1) most ensemble-based EDM studies do not use hybrid resampling or do so outside of cross-validation, which could cause data leakage; (2) SHAP is mostly added after the fact rather than being an integral part of the pipeline; (3) the choice of meta-learner in stacking architectures is not always backed up by evidence; and (4) no previous work on the Kalboard 360 dataset has looked at all three problems (imbalance, stacking, and interpretability) from the point of view of deployment-aware information systems. The proposed framework is created to address these four gaps cohesively.
Table 1. Gap analysis of previous studies and the proposed framework
|
Study |
Dataset |
Imbalance Handling |
Ensemble |
Explainability |
Identified Limitations |
Gap Addressed by This Study |
|
[24] |
XuetangX LMS |
One-Sided Selection |
Stacking |
SHAP |
No LMS Kalboard; limited local explainability |
Global + local SHAP on Kalboard |
|
[26] |
Kalboard 360 |
None |
Bagging/RF |
None |
Low interpretability |
Introduce interpretable ensemble |
|
[27] |
OULAD |
None |
RF |
SHAP |
No LMS Kalboard; limited local explainability |
Global + local SHAP on Kalboard |
|
[28] |
Korea Univ. LMS |
None |
Stacking |
SHAP |
No LMS Kalboard; limited local explainability |
Global + local SHAP on Kalboard |
|
[15] |
Kalboard 360 |
None |
Boosting+RF |
None |
Low interpretability |
Introduce interpretable ensemble |
The following framework organizes the research discussion: Section 2 describes the method used. We will present and analyze our experimental findings and their implications for XAI methods, and describe how XAI improves the EDM system, as mentioned in 3. This study concludes in Section 4.
This section presents the unifying methodological framework developed to forecast how well students would perform in LMS contexts, ensuring it is easy to understand and competitive. The suggested solution combines data preparation, hybrid imbalance handling, stacking for ensemble learning, hyperparameter optimization, and SHAP-based explainability. Figure 1 shows how the whole process works.

2.1 Dataset description
The Kalboard 360 dataset was selected based on three criteria. First, it has been used in at least two peer-reviewed publications [15, 26], so it can be meaningfully compared to other work in the EDM field and is thus considered an established benchmark. Also, it is ecologically relevant since its feature composition records behavioral interactions inside an LMS context: 480 records and 16 attributes, which include four categories: demographic, academic backgrounds, parent participation, and behavioral (such as visited resources, raised hands, announcements viewed, and discussion)—closely resemble data commonly documented by modern LMS platforms. The dataset is suitable for testing the SMOTE-ENN resampling component of the proposed system. Thirdly, it offers a non-trivial three-class classification problem with natural class imbalance (High: 142 instances = 29.58%; Medium: 211 instances = 43.95%; Low: 127 instances = 26.45%). The adoption of the dataset here prioritizes reproducibility and direct comparability with the current EDM research, despite the single-source nature of this dataset, which is acknowledged as a limitation (Section 3). In Table 2, a full description of the features and the categories.
Table 2. Feature and properties of the datasets
|
No |
Features & Feature Types |
Feature Category |
Description |
|
1 |
Gender |
categorical |
Male or Female |
|
2 |
Nationality |
categorical |
Egypt, Kuwait, Saudi Arabia, Lebanon, etc. |
|
3 |
Birthplaces |
categorical |
Egypt, Kuwait, Saudi Arabia, Lebanon, etc. |
|
4 |
Relation |
categorical |
Guardian Responsible for the Student (Father or Mother) |
|
5 |
Educational stages |
categorical |
Low Level, Middle Level, High Level |
|
6 |
Grade levels |
categorical |
G-01 to G-12 |
|
7 |
Section ID |
categorical |
A, B, C |
|
8 |
Topic |
categorical |
English, Arabic, IT, Math, Chemistry, Biology, etc |
|
9 |
Semester |
categorical |
First or Second |
|
10 |
Student absence days |
numerical |
Above-7, Under-7 |
|
11 |
Discussion groups |
numerical |
0 - 100 |
|
12 |
Visited resources |
numerical |
0 - 100 |
|
13 |
Viewing announcements |
numerical |
0 - 100 |
|
14 |
Raised hand |
numerical |
0 - 100 |
|
15 |
Parent answering survey |
categorical |
Yes or Not |
|
16 |
Parent school saticfaction |
categorical |
Yes or Not |
2.2 Data pre-processing
The data preprocessing is a critical phase that precedes the application of classification algorithms. Numerous machine learning frameworks exist within the Python ecosystem, including scikit-learn which is expected to model and perform better [29-31]. Before constructing the predictive model, feature transformation and normalization were applied to prepare the dataset for machine learning algorithms.
2.2.1 Encoding of categorical attributes
Nominal attributes (e.g., nationality, topic, section) were transformed using one-hot encoding, while ordinal attributes (e.g., grade level, educational stage) were encoded using ordinal encoding. This dual strategy preserves semantic relationships in ordinal features while enabling algorithms to operate effectively on categorical variables. It is important to note that the performance of machine learning algorithms is significantly influenced by categorical data encoding [32, 33].
Two encoding procedures applied to the categorical features in the dataset are illustrated in Figure 2. Ordinal encoding was used for features having a natural rank order, where each category is assigned an integer value in sequence. Notably, the target variable Class was encoded with a custom category order ['L', 'M', 'H'], so the ordinal relationship—Low, Medium, and High performance—is kept numerically during model training. Nominal categorical features that are not ordered were One-Hot Encoded using OneHotEncoder(sparse_output=False), which creates a binary column for each category of the variable. The original nominal columns were then eliminated and merged with the encoded binary features to create the final feature matrix for subsequent modelling processes.

Figure 2. Ordinal encoder process
2.2.2 Normalization of numeric features
Numerical features were normalized using Min-Max scaling features (such as resource visits, announcements watched, or how often the user raised their hand) to ensure all algorithms had the same feature ranges and prevent features with larger values from having more influence. Normalization methods include min-max, z-score, and decimal scaling [34]. The following from Figure 3 shows that the process of applying MinMax Normalization to reduce errors.

Figure 3. MinMax normalization process
2.3 Hybrid class imbalance handling
The majority of students are categorized as having mid- to high-performance levels, while there are often noticeable performance discrepancies as shown in educational records. The SMOTE-ENN hybrid resampling method is used to solve this research problem [35, 36]. There is always the chance of data leakage in resampling investigations. The training fold is the only one that uses SMOTE-ENN during cross-validation. Using a sampling technique that accounts for instances' closest neighbors, SMOTE generates synthetic minority samples. By eliminating noisy samples or those that approach the threshold, ENN raises the assessment threshold [37-39].
2.4 Machine learning models
This study evaluated various classical machine learning algorithm to enhance the predicted accuracy of student academic performance. Eight methods were employed. A concise summary of each algorithm is shown below:
2.5 Ensemble-based learning models
Ensemble learning is an ML technique that combines multiple models to improve overall performance and predictive accuracy [40]. The basic concept behind ensemble learning is the combination of multiple individual models. These individual models are combined in an ensemble approach to improve the stability and predictive power of the model [34]. This approach allows for higher predictive performance compared to a single model. Other ensemble models used include:
2.6 Proposed stacking ensemble model
A stacked ensemble architecture incorporates many learning patterns and improves prediction. This structure consists of two hierarchical levels:
2.6.1 Base learners
Five different classifiers were chosen based on their complementing strengths, likes KNN, RF, ETC, XGB, and LGBM. We chose these models because they use linear, tree-based, and boosting methods to show both simple and complicated decision structures.
2.6.2 Meta-learners
As a meta-learner, LR combines all of the base model predictions. During training, k-fold cross-validation (k = 5) is used to make predictions for each base learner that are not in the fold. These predictions create a new meta-feature matrix that is utilized to train LR and make the final predictions. This hierarchical structure makes the model more interpretable and less variable, which solves the problems with individual and homogeneous ensemble models.
Wolpert [24] proposed that stacking differs from bagging and boosting because it uses a meta-learner to combine the outputs of different basis learners rather than using the same base models. Stacking is an ensemble learning strategy that combines numerous models with meta-models to improve performance and durability. Stacking models use training data to construct numerous base models, which then feed their predictions into the meta-model to get the final result. There are several types of stacking, including homogeneous stacking, which is used with templates of the same type as the base model. Heterogeneous stacking employs various types of models as base learners [40]. The stacking ensemble model proposed in this study operates at two levels, as shown in Figure 4: Level 1 (multiple base learners) and Level 2 (meta-learners). The proposed stacking ensemble consists of two hierarchical levels.

Figure 4. Proposed stacking ensemble flowchart for predicting student academic performance
At Level-1, heterogeneous base learners (KNN, RF, ETC, XGB, and LGBM) are trained using stratified 5-fold cross-validation. At Level-2, LR is employed as the meta-learner to combine out-of-fold predictions generated by the base models.
LR was selected due to its competitiveness, low variance, and transparency, which aligns with the explainability requirements of educational decision support systems.
2.7 Hyperparameter optimization
Grid search and stratified 5 fold cross-validation were used together to improve all of the models. The stage is used for both base learners and meta learners. When working with unbalance educational data, it is important to use stratification to make sure that the class proportions stay the same between folds. The optimization procedure lowers the chance of overfitting. It finds the optimal values for parameters like learning rate (boosting models), regularization strength (LR), maximum tree depth (ETC, LGBM), and number of estimators (KNN, RF, XGB). The results of the final parameter settings are detailed in Section 3.
2.8 Explainability using Shapley Additive Explanations
Using SHAP helps make things clear and lets stakeholders understand the outcomes of the model. SHAP may break down predictions into the contributions of each feature, which gives explanations that are not tied to the model and are specific to the predictions.
2.8.1 Global interpretation
Finding the most important academic and behavioral characteristics in the whole dataset by analyzing global SHAP values. Resource visits, hand-raising frequency, and attendance patterns are some of the major indicators that are highlighted in summary and significance plots.
2.8.2 Local interpretation
SHAP power plots serve to generate local explanations. They demonstrate how particular attributes influence individual predictions at the instance level. Model assessments are clear and implementable with these elucidations for customized academic interventions.
2.8.3 Interaction effects
The efficacy of performance prediction is contingent upon SHAP interaction values, which encapsulate pairwise feature interactions and provide a more profound understanding of the aggregation of engagement behaviors. Thus, understanding common nonlinear patterns in LMS behavioral data is used in interaction analysis.
Thus, the human should be able to explain and determine which features significantly influence the prediction results if the model is explainable [42, 43]. In this work, SHAP is used to explain the proposed methodology because SHAP [44], is model-agnostic. This method is based on game theory and aims to explain how machine learning systems make decisions [45, 46]. SHAP values not only play an important role in feature selection [47] and model explanation [48], but also experience significant growth in explainable AI (XAI). SHAP calculates each feature's Shapley value, which affects model output. Each feature's Shapley value is determined using the equation:
$\phi \mathrm{i}(p)=\sum_{S \subseteq \backslash\{i\}} \frac{|S|!(n-|S|-1)!}{n!}(p(S \cup\{\mathrm{i}\})-p(S))$ (1)
Finding the Shapley value for a given function i (out of n total features, where S is a subset of n) based on the prediction p (the output of the complex model).
2.9 Performance evaluation metrics
Models were evaluated using methods including accuracy, precision, recall, and F1-score. These are the most commonly used metrics to measure classification performance. The calculation of these metrics is described by Eqs. (2)-(5). A true negative (TN) indicates that the individual is healthy and the test is negative. A true positive (TP) means the person is sick and the test is positive. A false positive (FP) occurs when a test indicates that someone is sick when they are actually healthy. A false negative (FN) occurs when the test indicates the person is not unwell when they really are. The proposed model's performance parameters can be calculated using the following equation [49-51].
Accuracy $=\frac{T P+T N}{T P+F P+F N+T N}$ (2)
Precision $=\frac{T P}{T P+F P}$ (3)
Recall $=\frac{T P}{T P+F N}$ (4)
F1-score $=\frac{2 *\ { Precision }\ *\ { Recall }}{{ Precision }\ + \ { Recall }}$ (5)
Eight machine learning algorithms have been applied to the LMS Kalboard 360 dataset. The investigation the setup and protocol of the experimental, also evaluation. Some prepossessing was carried out on the dataset before applying the algorithm. Following the application of the eight classic ML algorithms, bagging, and voting to the preprocessed dataset, an explainable stacking ensemble method was developed. The examine focuses on performance, specifically how the ensemble method enhances performance when compared to earlier research to predict student academic success. Futhermore, explainability refers to whether SHAP values can explain the ensemble method's internal logic. The predictor model calculates the performance metrics, whereas the interpreter summarizes the consequences of negative and positive attributes. In this study, the model was initialized using an ensemble learning meta-learner and Shapley values to build a stacked ensemble learning model and an XAI model.
3.1 Experimental setup
The proposed framework was implemented using Python with scikit-learn [29]. SHAP libraries [52] was used to interpret the model that provides local and global explanations. Imbalanced-learn with SMOTE-ENN [53] was used to combine under-sampling and over-sampling to handle imbalanced data. All experiments were conducted on a machine with 16GB RAM and an AMD Ryzen 7000 series processor.
To ensure unbiased evaluation, SMOTE-ENN was applied exclusively within the training portion of each stratified cross-validation fold. No resampling was performed on the validation or test partitions. This leakage-aware protocol prevents synthetic information from influencing evaluation data and guarantees consistent performance estimation.
3.2 Model performance evaluation
A hybrid resampling (SMOTE-ENN) method was used in the experiment to address issues arising from an unbalanced dataset. We then looked at a five-fold cross-validation method for training the model, since validation is an important step in making useful predictive models. In order to construct models for the purpose of forecasting students' performance, two classes of machine learning algorithms were employed: classical methods (KNN, LR, DT, RF, SVM, XGB, ETC, LGBM) and ensemble methods (bagging, voting, and stacking).
This study compared eight different machine learning models with a stacked ensemble learning approach for predicting student academic performance to demonstrate the empirically effectiveity of the ensemble learning method. When testing the selected stacking ensemble model, five fundamental learning models: KNN, RF, ETC, XGB, and LGBM were used to build a stacked classifier. LR was the meta-model used.
The comparative experiment was conducted on candidate meta-learners, LR and SVM, to justify the selection of LR as the meta-learner empirically. All candidates are tested using the same stacking architecture and 5-fold cross-validation conditions. Table 3 presents the findings of the comparison to identify the best meta-learner. In terms of mean accuracy (75.83% vs. 70.83%) and macro F1-score (76.55% vs. 71.68%), Stacking + LR performed better than Stacking + SVM. The 5-point accuracy discrepancy remains unaddressed, despite Stacking + SVM having a smaller standard deviation (1.47% vs. 5.41%). Because of its high computational efficiency, compliance with accurate SHAP-based interpretability, and excellent predictive accuracy, LR was chosen as the meta-learner.
Table 3. Comparison of meta-learner on stacking classifier (5-fold CV)
|
Meta Learner Model |
Accuracy Mean (%) |
Accuracy Std (%) |
F1 Macro Mean (%) |
F1 Macro Std (%) |
|
Stacking+LR |
75.83 |
5.41 |
76.55 |
5.26 |
|
Stacking+SVM |
70.83 |
1.47 |
71.68 |
1.43 |
Using a stratified approach, the data were divided into training and testing subsets at an 80:20 ratio. Moreover, to avoid models suffering from the overfitting problem, the k-fold cross-validation technique was used with the value of k set to 5 using GridSearchCV as hyperparameter tuning. Table 4 presents the optimal hyperparameter configurations obtained through grid search optimization with 5-fold cross-validation for each classifier. Evaluation metrics were employed to measure and compare the performance of stacking ensembles against other ML models such as bagging and voting approaches.
Table 4. Hyperparameter search space for grid search cross-validation (CV)
|
Algorithm Model |
Parameter |
Values Searched |
|
KNN |
n_neighbors |
10 |
|
|
weights |
uniform, distance |
|
DT |
criterion |
gini, entropy |
|
|
max_depth |
5, 10 |
|
|
min_samples_leaf |
3 |
|
LR |
C |
0.1, 1, 10 |
|
SVM |
C |
0.1, 0.3, 1 |
|
RF |
n_estimators |
100 |
|
|
max_depth |
8, 10 |
|
|
min_samples_leaf |
2, 3 |
|
XGB |
n_estimators |
80, 120 |
|
|
max_depth |
2, 3 |
|
|
learning_rate |
0.03, 0.05 |
|
ETC |
default parameter |
|
|
LGBM |
n_estimators |
200, 250 |
|
|
learning_rate |
0.05 |
|
Bagging |
n_estimators |
50, 60 |
|
|
min_samples |
0.07 |
|
Voting |
optimized base estimators |
|
|
Stacking |
optimized base estimators |
|
The results of all the models' predictions, as measured by Accuracy, Precision, Recall, and F1-score. The model successfully reduces the likelihood of inaccurately identifying students as top performers by efficiently minimizing false positive predictions, as seen by the high precision value. At the same time, the model was able to accurately identify most high-performing students despite the initial class imbalance in the dataset, as shown by its strong recall performance. The model appears to strike a good compromise between sensitivity and prediction dependability, as evidenced by the relatively tight association between F1-score and precision.
These results are the product of the hybrid features of the SMOTE-ENN resampling approach, which incorporates synthetic minority oversampling and noise reduction through Edited Nearest Neighbors (ENN). To reduce majority-class bias and increase the classifier's discriminative strength, this strategy helps to establish a more even distribution of training data. Figure 5 shows the best score evaluation measurement for predicting students' academic performance that is produced by combining stacking ensembles with hybrid resampling.

Figure 5. The best score evaluation measurement
Table 5 shows the model performance in terms of Accuracy, Precision, Recall, and F1-score using SMOTE-ENN resampling. The Stacking Classifier performed best overall (Accuracy: 96.57%, Precision: 96.34%, Recall: 93.26%, and F1-score: 94.40%), followed by ETC and LGBM. LR performed the worst among all the metrics.
Table 5. Performance comparison of the proposed classifier models
|
Algorithm Model |
Accuracy (%) |
Precision (%) |
Recall (%) |
F1-Score (%) |
|
KNN |
94.10 |
93.56 |
87.54 |
89.36 |
|
DT |
93.42 |
90.68 |
88.01 |
88.88 |
|
LR |
87.32 |
81.19 |
75.54 |
76.23 |
|
SVM |
95.54 |
95.14 |
91.17 |
92.38 |
|
RF |
94.93 |
93.57 |
89.95 |
91.29 |
|
XGB |
92.63 |
90.11 |
87.32 |
88.08 |
|
ETC |
96.27 |
96.00 |
92.55 |
93.73 |
|
LGBM |
95.93 |
95.66 |
91.85 |
93.15 |
|
Bagging |
93.33 |
90.14 |
89.57 |
89.52 |
|
Voting |
94.76 |
93.28 |
89.84 |
91.11 |
|
Stacking (Meta-Learner: LR) |
96.57 |
96.34 |
93.26 |
94.40 |
Figure 4 shows a comparison of metrics (accuracy, precision, and F1-score) of eleven classification models (KNN, DT, LR, SVM, RF, ETC, XGB, LGBM, Bagging, Voting, and Stacking) in four resampling situations (none, SMOTE, ENN, and SMOTE-ENN). The results show that, in all metrics, SMOTE-ENN consistently achieves the highest performance. The worst scores are achieved without resampling at the same time, which indicates that the resampling technique has a considerable influence on the model performance for imbalanced class distributions.
Moreover, the low standard deviation values observed across all evaluation metrics confirm the resilience and reproducibility of the proposed framework during stratified 5-fold cross-validation. This indicates that the stacking-based SMOTE-ENN model can maintain a competitive predictive performance despite variations in data partitioning.
The results (see Table 5) show that the ensemble-based models are more effective for the unbalanced classification tasks after SMOTE-ENN resampling. This improvement indicates that the suggested framework captures more discriminative patterns in the data when compared to earlier results on the same dataset, such as Abu Amrieh et al. [26]. This improvement is significant. Three pieces of evidence bolster the credibility of this discovery. To begin, the very consistent fold-wise performance is seen by the small error bars in Figure 6(a-c). Secondly, the model demonstrates that promising generalization is maintained across all evaluation criteria, as seen by the uniformly low standard deviations across accuracy, precision, and F1-score. Section 3.3's SHAP analysis demonstrates, thirdly, that the model is dependent on significant behavioral variables, most notably StudentAbsenceDays.

(a) Accuracy per model and resampling

(b) Precision per model and resampling

(c) F1-score per model and resampling
Figure 6. Comparison of performance metrics of selected models
The results of the Wilcoxon signed-rank test indicated no statistically significant differences at α = 0.05 (p > 0.05), even though the proposed stacking structure regularly scored the highest mean F1-score under the SMOTE-ENN configuration. It is clear from the low fold-wise variability and consistent performance gains that the proposed framework offers dependable predictive capability for LMS-based student performance prediction. Detailed statistical test results are presented in Table 6.
Table 6. Wilcoxon signed-rank test: stacking vs baseline models (metrics: F1, resampling: SMOTE-ENN, a = 0.05)
|
Comparison (vc Stacking) |
F1 Mean (Baseline) % |
F1 Mean (Stacking) % |
W-Statistic |
p-Value |
Significance |
|
KNN |
89.36 |
94.40 |
1.0 |
0.125 |
no significance |
|
DT |
88.88 |
94.40 |
3.0 |
0.3125 |
no significance |
|
LR |
76.23 |
94.40 |
0.0 |
0.0625 |
no significance |
|
SVM |
92.38 |
94.40 |
5.0 |
0.625 |
no significance |
|
RF |
91.29 |
94.40 |
6.0 |
0.8125 |
no significance |
|
XGB |
93.73 |
94.40 |
7.0 |
1.0 |
no significance |
|
ETC |
88.08 |
94.40 |
0.0 |
0.0625 |
no significance |
|
LGBM |
93.15 |
94.40 |
4.0 |
0.4375 |
no significance |
|
Bagging |
89.52 |
94.40 |
2.0 |
0.1875 |
no significance |
|
Voting |
91.11 |
94.40 |
3.0 |
0.3125 |
no significance |
3.3 Result of Explainable Artificial Intelligence: Shapley Additive Explanations
The results of the interpretability analysis utilizing the SHAP methodology are presented below. Each attribute is represented by a SHAP summary graphic, which shows how it affects the student's academic achievement.
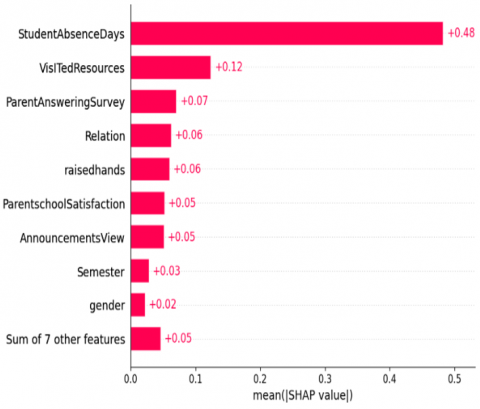
The explanation for Figure 7 shows that StudentAbsenceDays is the most dominant feature, surpassing all others. This indicates that student attendance has the greatest influence on predicting academic performance. The second most influential feature is VisitedResources, which reflects the intensity of students' access to learning materials within the LMS. Subsequent features, such as ParentAnsweringSurvey, Relationship, RaiseHands, ParentSchoolSatisfaction, and AnnouncementView, make relatively moderate yet significant contributions. Semester and gender contribute the least among the features displayed individually. These findings confirm that the optimal stack ensemble is primarily driven by behavioural engagement features, reinforcing the importance of LMS interactions and attendance patterns in predicting students' academic performances. The model is easy to understand using the SHAP method, which helps identify important factors for early teaching support.
Figure 7. A global explanation of the stacking model SHAP explainer
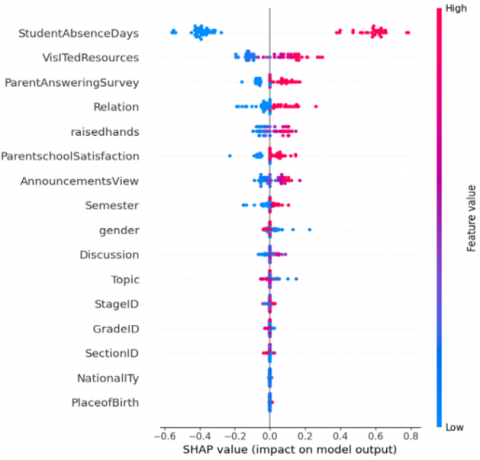
Figure 8 shows the SHAP summary plot, which reveals both the magnitude and directional influence of each feature on the model's predictions. StudentAbsenceDays exhibits the widest SHAP value distribution, with clear polarization by colour: low absence values (blue) consistently push predictions in a positive direction. In contrast, high absence values (red) exert strong negative impacts, confirming that absenteeism is the most decisive and consistent behavioural determinant in the model. VisitedResources demonstrates the opposite pattern, where higher feature values yield positive SHAP contributions, affirming that active engagement with learning materials meaningfully elevates predicted academic performance. ParentAnsweringSurvey and Relation show similar trends, suggesting that when parents are involved, and there is a good relationship between home and school, it positively influences predictions. RaisedHands and AnnouncementsView similarly exhibit positive directional associations, reflecting the predictive value of interactive participation and responsiveness to instructional communications within the LMS. In contrast, demographic and institutional features, including gender, Semester, StageID, GradeID, SectionID, Nationality, and PlaceofBirth, display SHAP distributions tightly concentrated near zero, confirming their negligible predictive contribution. The summary plot substantiates that the model's predictive behaviour is predominantly governed by dynamic behavioural engagement indicators rather than static student attributes, demonstrating both statistical validity and pedagogical interpretability.
Figure 8. Shapley Additive Explanations (SHAP) summary plot based on mean SHAP values
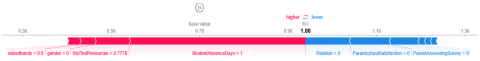
Figure 9 presents a SHAP force plot providing a local explanation for an individual prediction. The visualisation illustrates how specific features shift the prediction away from the baseline, either increasing or decreasing the final output. The prediction ultimately leans toward the high-performance class, indicating that the model classifies the student as likely to achieve excellent academic results. Low absence emerges as the primary positive contributor, substantially strengthening the prediction. Active engagement with learning resources and classroom participation reinforces this effect, further pushing the output toward high performance.
Figure 9. Force plot depicting feature contribution toward a single prediction
In contrast, certain parental-related variables exert minor negative contributions, slightly moderating the prediction. Overall, the combined influence of behavioural engagement factors outweighs opposing signals, resulting in a confident, high-performance classification. This local explanation aligns with the global SHAP analysis, reaffirming that attendance and LMS engagement are the central drivers of academic performance predictions.
To enhance the interpretability of the Stacking Classifier, SHAP dependence plots were generated for the most influential feature identified in the model. Figure 10 presents two dependence plots for StudentAbsenceDays—encoded ordinally as 0 (above 7 days, high absenteeism) and 1 (under 7 days, low absenteeism)—with interaction effects colored by VisITedResources (Figure 10(a)) and raisedhands (Figure 10(b)), both evaluated with respect to the High Performance (H) class prediction.

(a) VisitedResources

(b) RaisedHands
Figure 10. Shapley Additive Explanations (SHAP) dependence plots for studentabsencedays with interaction effects on high performance (H) class prediction
The plots show a clear bifurcation in SHAP values. Students with a low absence rate (encoded as 1) tend to have very high SHAP values (around +0.5 to +0.6), indicating that the model predicts they will perform well. On the other hand, students who are frequently absent from class (encoded as 0) have low SHAP values (about -0.4 to -0.6), which reduces the likelihood of being labeled as high performers—even if other behavioral characteristics still have favorable values. That StudentAbsenceDays is the principal gating characteristic in the model's decision-making process is supported by this pattern, which aligns with educational research findings that consistent attendance is necessary for good learning outcomes.
Beyond the main effect, the interaction coloring in Figure 10(a) reveals that among students with low absenteeism, those who more frequently access digital learning resources (VisitedResources, higher values shown in warmer colors) tend to obtain marginally higher SHAP contributions. This suggests a synergistic relationship between physical attendance and digital engagement, in which both behaviors jointly increase the likelihood of high academic performance. Similarly, Figure 10(b) demonstrates that students who combine consistent attendance with active classroom participation (RaisedHands, higher values in warmer colors) attain the highest SHAP values, reflecting the principle of active learning, in which participatory behavior reinforces comprehension and correlates positively with academic achievement.
The pedagogical implications of these findings are direct. Before cumulative learning impairments become irreversible, academic counselors should intervene early when an individual's absenteeism exceeds 7 days. Second, attending class is not enough to guarantee good grades; teachers also need to actively encourage students to participate and make effective use of digital tools. Thirdly, the Stacking Classifier's SHAP values are interpretable, which makes the model a good early warning system. It can identify students who are struggling before the end-of-semester exams and then help them with quick, evidence-based interventions.
3.4 Comparison with previous studies
These results offer important new information about the advantages of using stacking ensemble techniques for predicting student academic performance, a basic strategy. Furthermore, in Table 7, we compared the proposed student performance prediction model with previous models (i.e., Abu Amrieh et al. [26], Alsulami et al. [15], Adnan et al. [27], Jang et al. [28], and Tong and Li [24]) in addition to each of the machine learning models that make up the stacking ensemble (KNN, RF, XGB, ETC, and LGBM). An outline of the baseline is provided below:
Abu Amrieh et al. [26]: Using ANN, NB, DT, and ensemble methods (bagging, boosting, and RF) to improve classification performance. The conducted feature selection and 10-fold CV, but did not resample the data. The recorded accuracy was 82%, precision was 85%, recall was 82%, and F1-score was 82%. The ensemble results increased accuracy by up to 25.8%.
Alsulami et al. [15]: Used the Kalboard 360 LMS dataset, the Boosting+DT algorithms achieved an accuracy of 77.9% with hyperparameter optimization, and 10-fold CV was used.
Table 7. Comparing the proposed model with previous model
|
Ref. |
Model |
Dataset |
Train Test Split |
Resampling |
Performance Metrics |
|||
|
Accuracy |
Precision |
Recall |
F1-Score |
|||||
|
Abu Amrieh et al. [26] |
Decision Tree (DT) |
Kalboard 360 LMS |
- 10-fold CV |
- |
0.82 |
0.85 |
0.82 |
0.82 |
|
Alsulami, et al. [15] |
Boosting+DT |
Kalboard 360 LMS |
10-fold CV |
- |
0.77 |
0.77 |
0.77 |
0.79 |
|
Adnan et al. [27] |
Random Forest (RF) |
OULAD |
80:20, 10-fold CV |
- |
0.92 |
0.87 |
0.96 |
0.91 |
|
Jang et al. [28] |
Logistic Regression (LR) |
LMS Korea University |
10-fold CV |
- |
0.84 |
- |
- |
0.80 |
|
Tong and Li [24] |
Stacking (LR meta-learner) |
XuetangX LMS |
80:20, 5-fold CV |
OneSidedSelection |
0.98 |
0.85 |
0.87 |
0.86 |
|
Proposed Model |
Stacking (LR meta-learner) |
Kalboard 360 LMS |
80:20, 5-fold CV |
SMOTE-ENN |
0.97 |
0.96 |
0.93 |
0.94 |
Adnan et al. [27]: Using the OULAD dataset, the RF algorithms achieved 92% accuracy and precision. A 10-fold CV was used, with 80% and 20% data splits, and then 10-fold cross-validation was added. Jang et al. [28]: Using the Korea University LMS dataset, the selected STC algorithm successfully achieved 94% accuracy and precision, and a 10-fold CV was used. Tong and Li [24]: The conducted research using the LMS dataset in China. Applied six algorithms and a stacking ensemble with a meta-learner LR on online student behaviour logs and demographic data. The split is 80:20, with 5-fold CV and OneSideSelection resampling. The best results are from the stacking model with meta-learner LR, which achieved 98% accuracy and precision. The proposed model, which used ensemble stacking with an LR meta-learner, got 96.57% accuracy, 96.34% precision, 93.26% recall, and 94.40% F1. A 5-fold CV grid search was used with an 80:20 data split. Also, SMOTE-ENN resampling was utilised to fix the imbalance.
Our stacked ensemble strategy addresses these issues by combining the best features of multiple models. Mixing the outputs of several base learners with LR meta-learners improves performance by combining the simplicity and complexity of linear and nonlinear models. By immediately correcting data imbalances, our strategy improves projection performance metrics. Our primary goal is to utilize interpretability modeling to gain a deeper understanding of education. SHAP integration has made our method more competitive and consistent than independent models for academic performance.
3.5 Discussion
These findings suggest that behavioral engagement within LMS environments may partially compensate for certain academic risk factors, thereby providing meaningful pedagogical insights into student learning behavior. The integration of SHAP-based interpretability further enables transparent identification of influential behavioral attributes, facilitating transparent interpretation of how specific LMS engagement behaviors contribute to student performance prediction. Consequently, the proposed framework may support targeted intervention strategies based on explainable behavioral indicators rather than demographic profiling alone.
Several limitations of this study should nevertheless be acknowledged. First, the experimental evaluation was conducted using the Kalboard 360 dataset (n = 480). Although this benchmark dataset has been widely utilized in EDM research, reliance on a single institutional dataset may not adequately represent the behavioral diversity and contextual variability of broader LMS ecosystems. Furthermore, institution-specific learning practices and learner interaction patterns may limit the transferability of the proposed framework across different educational settings. The relatively limited sample size may also constrain model generalizability in larger-scale educational environments. Nevertheless, the use of the Kalboard 360 benchmark enables meaningful comparison with prior studies and provides a controlled setting for evaluating the methodological contribution of the proposed framework.
Second, the proposed approach relies primarily on static tabular features and does not explicitly model temporal learning trajectories, despite the increasing importance of sequential interaction data in modern LMS platforms. Consequently, longitudinal engagement dynamics and evolving learning behaviors remain unexplored in the present study.
Third, although the framework demonstrated promising predictive performance under experimental conditions, its practical deployment feasibility has not yet been evaluated through real-time inference scenarios, long-term institutional implementation, or user acceptance assessment involving educators and academic administrators.
Future research should therefore investigate cross-institutional validation and sequence-aware learning analytics models capable of capturing temporal engagement dynamics from continuous LMS interaction data. Additional studies may also explore deployment-oriented evaluation frameworks to assess scalability, transparency, and practical integration within real educational environments.
This research presented an explainable stacking ensemble model for predicting students' performance in LMS settings. It did this by accounting for class imbalance, ensemble interpretability, and real‑time prediction constraints. The proposed framework combines diverse base learners, a LR meta‑learner, and SHAP‑based interpretability for both local and global predictions. Experimental results show an F1-score of 94.40% and an accuracy of 96.57% using the SMOTE-ENN in a stratified 5-fold cross-validation on the Kalboard 360 dataset. The framework's relatively low fold‑wise variability results in accurate and stable predictions across validation folds. Statistical tests using the Wilcoxon signed‑rank test (α = 0.05) showed no significant difference between the proposed stacking model and the baseline classifiers. Nevertheless, the proposed framework consistently achieved the highest scores across all evaluation metrics.
LR offered better predictive performance and interpretability within the stacking architecture, as shown by additional experiments comparing LR with SVM as the meta‑learner. Demographic variables had a smaller impact on model decisions, according to the SHAP analysis, whereas behavioral engagement markers, especially StudentAbsenceDays and VisitedResources, emerged as strong predictors. The results indicate that the proposed framework is useful for behavioral analytics in LMS and has practical applications in educational technology. Future endeavors will focus on validating the framework with larger, multi-institutional datasets and on integrating temporal learning models to better understand student involvement patterns.
The authror is deeply grateful to Universitas Nusa Mandiri for their invaluable help and assistance in making this research possible.
[1] Batool, S., Rashid, J., Nisar, M.W., Kim, J., Kwon, H., Hussain, A. (2022). Educational data mining to predict students' academic performance: A survey study. Education and Information Technologies, 28(1): 905-971. https://doi.org/10.1007/s10639-022-11152-y
[2] Romero, C., Ventura, S. (2020). Educational data mining and learning analytics: An updated survey. WIREs Data Mining and Knowledge Discovery, 10(3): e1355. https://doi.org/10.1002/widm.1355
[3] Yağcı, M. (2022). Educational data mining: Prediction of students' academic performance using machine learning algorithms. Smart Learning Environments, 9(1): 1-19. https://doi.org/10.1186/s40561-022-00192-z
[4] Umer, R., Susnjak, T., Mathrani, A., Suriadi, L. (2021). Current stance on predictive analytics in higher education: Opportunities, challenges and future directions. Interactive Learning Environments, 31(6): 3503-3528. https://doi.org/10.1080/10494820.2021.1933542
[5] Wongvorachan, T., He, S., Bulut, O. (2023). A comparison of undersampling, oversampling, and SMOTE methods for dealing with imbalanced classification in educational data mining. Information, 14(1): 54. https://doi.org/10.3390/info14010054
[6] Teoh, C., Ho, S., Dollmat, K.S., Tan, C. (2022). Ensemble-learning techniques for predicting student performance on video-based learning. International Journal of Information and Education Technology, 12(8): 741-745. https://doi.org/10.18178/ijiet.2022.12.8.1679
[7] Nayak, P., Vaheed, S., Gupta, S., Mohan, N. (2023). Predicting students’ academic performance by mining the educational data through machine learning-based classification model. Education and Information Technologies, 28(11): 14611-14637. https://doi.org/10.1007/s10639-023-11706-8
[8] Zhao, C., Liu, J., Parilina, E. (2025). The shapley value contribution to explainable Artificial Intelligence: A comprehensive survey. Dynamic Games and Applications, 1-38. https://doi.org/10.1007/s13235-025-00670-2
[9] Er, E. (2023). An explainable machine learning approach to predicting and understanding dropouts in MOOCs. Kastamonu Education Journal, 31(1): 143-154. https://doi.org/10.24106/kefdergi.1246458
[10] Wang, J., Awang, N. (2025). A novel synthetic minority oversampling technique for multiclass imbalance problems. IEEE Access, 13: 6054-6066. https://doi.org/10.1109/access.2025.3526673
[11] Abdullah, M., Al-Ayyoub, M., Shatnawi, F., Rawashdeh, S., Abbott, R. (2023). Predicting students’ academic performance using e-learning logs. IAES International Journal of Artificial Intelligence (IJ-AI), 12(2): 831-839. https://doi.org/10.11591/ijai.v12.i2.pp831-839
[12] Sultana, I., Sadaf, Jilani, D. (2021). Classifying student's academic performance using SVM. Journal of Engineering and Applied Sciences, 8(2): 61-61. https://doi.org/10.5455/jeas.2021110107
[13] Dogan, M.E., Dogan, T.G., Bozkurt, A. (2023). The use of Artificial Intelligence (AI) in online learning and distance education processes: A systematic review of empirical studies. Applied Sciences, 13(5): 3056. https://doi.org/10.3390/app13053056
[14] Maraza-Quispe, B., Valderrama-Chauca, E.D., Cari-Mogrovejo, L.H., Apaza-Huanca, J.M. (2022). Predictive model of student academic performance from LMS data based on learning analytics. ICETC 2021: 2021 13th International Conference on Education Technology and Computers, Wuhan China. pp. 13-19. https://doi.org/10.1145/3498765.3498768
[15] Alsulami, A.A., Al-Ghamdi, A.S.A., Ragab, M. (2023). Enhancement of e-learning student’s performance based on ensemble techniques. Electronics, 12(6): 1508. https://doi.org/10.3390/electronics12061508
[16] Khan, M., Naz, S., Khan, Y., Zafar, M., Khan, M., Pau, G. (2023). Utilizing machine learning models to predict student performance from LMS activity logs. IEEE Access, 11: 86953-86962. https://doi.org/10.1109/access.2023.3305276
[17] Niyogisubizo, J., Liao, L., Nziyumva, E., Murwanashyaka, E., Nshimyumukiza, P.C. (2022). Predicting student's dropout in university classes using two-layer ensemble machine learning approach: A novel stacked generalization. Computers and Education: Artificial Intelligence, 3: 100066. https://doi.org/10.1016/j.caeai.2022.100066.
[18] Keser, S.B., Aghalarova, S. (2021). HELA: A novel hybrid ensemble learning algorithm for predicting academic performance of students. Education and Information Technologies, 27(4): 4521-4552. https://doi.org/10.1007/s10639-021-10780-0
[19] Arya, S., Aggarwal, S., Soni, N., Nishant, N., Ansar, S.A. (2024). Explainable Artificial Intelligence (XAI) in critical decision-making processes. International Conference On Innovative Computing And Communication, New Delhi, India, pp. 445-454. https://doi.org/10.1007/978-981-97-4152-6_32
[20] Osmanli, T. (2025). AI-enhanced predictive modelling of virtual laboratory microlearning in online distance education. Ingénierie des Systèmes d'information, 30(9): 2461-2471. https://doi.org/10.18280/isi.300920
[21] Niu, T., Liu, T., Luo, Y.T., Pang, P.C., Huang, S., Xiang, A. (2025). Decoding student cognitive abilities: A comparative study of explainable AI algorithms in educational data mining. Scientific Reports, 15(1): 26862. https://doi.org/10.1038/s41598-025-12514-5
[22] Svanberg, J., Öhman, P., Samsten, I., Neidermeyer, P., Rana, T., Berg, N. (2024). Predictive machine learning in assessing materiality: The global reporting initiative standard and beyond. In Artificial Intelligence for Sustainability, pp. 105-131. https://doi.org/10.1007/978-3-031-49979-1_6
[23] Swamy, V., Radmehr, B., Krco, N., Marras, M., Käser, T. (2022). Evaluating the explainers: Black-box explainable machine learning for student success prediction in MOOCs. arXiv preprint arXiv:2207.00551. https://doi.org/10.48550/arXiv.2207.00551
[24] Tong, T., Li, Z. (2025). Predicting learning achievement using ensemble learning with result explanation. PLoS ONE, 20(1): e0312124. https://doi.org/10.1371/journal.pone.0312124
[25] Mduma, N. (2023). Data balancing techniques for predicting student dropout using machine learning. Data, 8(3): 49. https://doi.org/10.3390/data8030049
[26] Abu Amrieh, E., Hamtini, T., Aljarah, I. (2016). Mining educational data to predict student’s academic performance using ensemble methods. International Journal of Database Theory and Application, 9(8): 119-136. https://doi.org/10.14257/ijdta.2016.9.8.13
[27] Adnan, M., Uddin, M.I., Khan, E., Alharithi, F.S., Amin, S., Alzahrani, A.A. (2022). Earliest possible global and local interpretation of students’ performance in virtual learning environment by leveraging explainable AI. IEEE Access, 10: 129843-129864. https://doi.org/10.1109/access.2022.3227072
[28] Jang, Y., Choi, S., Jung, H., Kim, H. (2022). Practical early prediction of students’ performance using machine learning and eXplainable AI. Education and Information Technologies, 27(9): 12855-12889. https://doi.org/10.1007/s10639-022-11120-6
[29] Garreta, R., Moncecchi, G., Hauck, T., Hackeling, G. (2017). Scikit-learn: Machine learning simplified: implement scikit-learn into every step of the data science pipeline. Packt Publishing Ltd.
[30] Paper, D. (2020). Hands-On Scikit-Learn for Machine Learning Applications. Springer Nature. https://doi.org/10.1007/978-1-4842-5373-1
[31] Aguagallo, L., Salazar-Fierro, F., García-Santillán, J., Posso-Yépez, M., Landeta-López, P., García-Santillán, I. (2023). Analysis of student performance applying data mining techniques in a virtual learning environment. International Journal of Emerging Technologies in Learning (iJET), 18(11): 175-195. https://doi.org/10.3991/ijet.v18i11.37309
[32] Purwoningsih, T., Santoso, H.B., Puspitasari, K.A., Hasibuan, Z.A. (2021). Early prediction of students’ academic achievement: Categorical data from fully online learning on machine-learning classification algorithms. Journal of Hunan University Natural Sciences, 48(9): 131-141.
[33] Ahmed, A.S., Haddad, A.A., Hameed, R.S., Taha, M.S. (2025). An accurate model for text document classification using machine learning techniques. Ingénierie des Systèmes d'information, 30(4): 913-921. https://doi.org/10.18280/isi.300408
[34] Kibria, H.B., Nahiduzzaman, Goni, O.F., Ahsan, M., Haider, J. (2022). An ensemble approach for the prediction of diabetes mellitus using a soft voting classifier with an explainable AI. Sensors, 22(19): 7268. https://doi.org/10.3390/s22197268
[35] Wang, Y., Zhang, Y., Liang, M., Yuan, R., Feng, J., Wu, J. (2023). National student loans default risk prediction: A heterogeneous ensemble learning approach and the SHAP method. Computers and Education: Artificial Intelligence, 5: 100166. https://doi.org/10.1016/j.caeai.2023.100166.
[36] Al-Hammouri, M.F., Hammouri, Z.A.A., Almalkawi, I.T., Lafee, A. (2024). Optimizing multi-class classification in educational data with ensemble learning and data balancing techniques. In 2024 Fifth International Conference on Intelligent Data Science Technologies and Applications (IDSTA), DUBROVNIK, Croatia. https://doi.org/10.1109/IDSTA62194.2024.10746987
[37] Mujahid, M., Kına, E., Rustam, F., Villar, M.G., Alvarado, E.S., Diez, I.D.L.T., Ashraf, I. (2024). Data oversampling and imbalanced datasets: An investigation of performance for machine learning and feature engineering. Journal of Big Data, 11(1): 87. https://doi.org/10.1186/s40537-024-00943-4
[38] Althaqafi, T., Saleem, F., Al-Ghamdi, A.A. (2025). Enhancing student performance prediction: The role of class imbalance handling in machine learning models. Discover Computing, 28(1): 79. https://doi.org/10.1007/s10791-025-09576-4
[39] Fachrie, M., Musdholifah, A., Pulungan, R. (2025). Effectiveness of data resampling and ensemble learning in multiclass imbalance learning. Artificial Intelligence Review, 58(12): 368. https://doi.org/10.1007/s10462-025-11357-w
[40] AlMohimeed, A., Saleh, H., Mostafa, S., Saad, R.M.A., Talaat, A.S. (2023). Cervical cancer diagnosis using stacked ensemble model and optimized feature selection: An explainable artificial intelligence approach. Computers, 12(10): 200. https://doi.org/10.3390/computers12100200
[41] Ujwal, U.J., Malik, S. (2023). A hybrid weight based feature selection algorithm for predicting students’ academic advancement by employing data science approaches. International Journal of Education and Management Engineering, 13(5): 1-22. https://doi.org/10.5815/ijeme.2023.05.01
[42] Burkart, N., Huber, M.F. (2021). A survey on the explainability of supervised machine learning. Journal of Artificial Intelligence Research, 70: 245-317. https://doi.org/10.1613/jair.1.12228
[43] Alwarthan, S., Aslam, N., Khan, I.U. (2022). An explainable model for identifying at-risk student at higher education. IEEE Access, 10: 107649-107668. https://doi.org/10.1109/access.2022.3211070
[44] Lundberg, S.M., Lee, S.I. (2017). A unified approach to interpreting model predictions. Advances in Neural Information Processing Systems, Long Beach, CA, USA.
[45] Li, M., Sun, H., Huang, Y., Chen, H. (2024). Shapley value: From cooperative game to explainable Artificial Intelligence. Autonomous Intelligent Systems, 4(1): 2. https://doi.org/10.1007/s43684-023-00060-8
[46] Hamilton, R.I., Papadopoulos, P.N. (2023). Using SHAP values and machine learning to understand trends in the transient stability limit. IEEE Transactions on Power Systems, 39(1): 1384-1397. https://doi.org/10.1109/tpwrs.2023.3248941
[47] Fryer, D., Strumke, I., Nguyen, H. (2021). Shapley values for feature selection: The good, the bad, and the axioms. IEEE Access, 9: 144352-144360. https://doi.org/10.1109/access.2021.3119110
[48] Parisineni, S.R.A., Pal, M. (2023). Enhancing trust and interpretability of complex machine learning models using local interpretable model agnostic shap explanations. International Journal of Data Science and Analytics, 18(4): 457-466. https://doi.org/10.1007/s41060-023-00458-w
[49] Ramaswami, G., Susnjak, T., Mathrani, A. (2022). On developing generic models for predicting student outcomes in educational data mining. Big Data and Cognitive Computing, 6(1): 6. https://doi.org/10.3390/bdcc6010006
[50] Hasib, K.M., Rahman, F., Hasnat, R., Alam, G.R. (2022). A machine learning and explainable AI approach for predicting secondary school student performance. In 2022 IEEE 12th Annual Computing and Communication Workshop and Conference (CCWC), Las Vegas, NV, USA. https://doi.org/10.1109/CCWC54503.2022.9720806
[51] Butt, N.A., Mahmood, Z., Shakeel, K., Alfarhood, S., Safran, M., Ashraf, I. (2023). Performance prediction of students in higher education using multi-model ensemble approach. IEEE Access, 11: 136091-136108. https://doi.org/10.1109/access.2023.3336987
[52] SHAP explainer. https://shap.readthedocs.io/en/latest/, accessed on Aug. 5, 2023.
[53] Malik, E.F., Khaw, K.W., Chew, X.Y. (2022). New hybrid data preprocessing technique for highly imbalanced dataset. Computing and Informatics, 41(4): 981-1001. https://doi.org/10.31577/cai_2022_4_981