Lina Jassim![]() | Ali A. Nadhim
| Ali A. Nadhim![]() | Shouket A. Ahmed
| Shouket A. Ahmed![]() | Hazry Desa
| Hazry Desa![]() | Firas H. Merie
| Firas H. Merie![]() | Enes Bektaş
| Enes Bektaş![]() | Taha Almulaisi*
| Taha Almulaisi*![]() | Ahmed D. Radhi
| Ahmed D. Radhi![]() | Raid Gaib
| Raid Gaib![]() | Hasan S. Majdi
| Hasan S. Majdi![]()
© 2026 The authors. This article is published by IIETA and is licensed under the CC BY 4.0 license (http://creativecommons.org/licenses/by/4.0/).
OPEN ACCESS
The work is an experimental analysis of the effectiveness of a pneumatic solar air collector, which is combined with two types of porous media, namely, glass balls and metal fibers, under the conditions of different airflow velocities that increase the heat transfer and efficiency of solar energy conversion. The experimental research was carried out during three months (August, September, and October 2024) on two prototypes of solar collectors, which will be created in the same way, on the roof of Hawija Technical Institute. A particular airflow velocity was applied every month, which was 1 m/s in August, 2 m/s in September, and 3.5 m/s in October, to study the impact of the velocity of air on thermal behavior and efficiency of the system. The experiments were conducted on the first day of each month with stable atmospheric conditions, such as clear skies and low wind speed, to ensure quality performance assessment. These findings suggest that metal fibers can have a fast thermal response at higher airflow velocities, which is 200 W/maximum useful energy output at 3.5 m/s versus 190 W/maximum useful energy output at 3.5 m/s in a glass ball arrangement. Nevertheless, glass balls show better thermal stability and heat retention properties with a maximum thermal efficiency of about 57% at low airflow velocity (1 m/s) as opposed to 52% in metal fibers. Moreover, the glass ball system retains a longer internal air temperature at the peak of solar radiation, which makes it favorable in systems that would need thermal performance over extended periods. According to experiment results, a favorable airflow regime is defined in which the lower to moderate air velocities are favorable to the thermal efficiency and heat storage, especially when glass balls are used as porous media, whereas higher airflow velocities are more favorable to the extraction of heat immediately when metal fibers are used. Therefore, solar air heating and ventilation systems need glass balls in case of the stabilization and extended duration of thermal output, and use metal fibers in case of quick thermal reaction.
pneumatic solar collector, porous media, glass balls, metal fibers, heat absorption, thermal efficiency, renewable energy, sustainable heating systems
Two main challenges that the global community will face over the next few decades are the exhaustion of the conventional fossil fuel deposits and the increased risk of environmental damage. Recent estimates indicate that the oil reserves can be depleted within less than 60 years, a fact that has made international governments focus on renewable energy sources. In addition to that, the use of fossil fuels has also contributed to global warming and climate change, requiring the transition to cleaner forms of power like solar, wind, geothermal, and hydro-power. Among them, solar energy is often noted by researchers as the most appropriate and efficient alternative to the existing energy structures [1, 2].
Solar energy is a clean and renewable energy source that is crucial in curbing the emission of greenhouse gases and reliance on fossil fuels [3]. Its use is varied, including photovoltaic (PV) electricity production, solar water heating, and climate control in buildings. Also, it finds applications in water desalination as well as agricultural operations, e.g., irrigation pumping, showing its application in various fields. Broadly, there are three types of solar systems namely photovoltaic (PV) systems, which transform sunlight directly into electricity through a series of solar cells [4, 5]; solar thermal systems, which collect sunshine and use it to heat fluid or air; and concentrated solar power (CdTe), which reflect sunlight onto fluid to push steam turbines and generate power at a large scale.
Hybrid systems consist of solar energy and other technologies, like wind turbines or storage batteries, in order to enhance the consistency and reliability in production to heat warehouses, homes, and industrial facilities. Solar air heaters (SAHs) are most effective in climate control by converting solar radiation to thermal energy to heat up air flowing through collectors [6]. These can be classified as active systems, whereby they use mechanical fans or pumps to cause the circulation of the hot air, and passive systems that are supported by natural convection [7].
The structure of a typical flat-plate collector consists of a glass plate with a transparent covering, a plate absorber, and an insulated casing [8, 9]. The absorber material is typically made of high-conductivity metals; copper is the best in terms of thermal properties, whereas aluminum and stainless steel are not expensive alternatives. These elements are enclosed in a strengthened frame with insulation on the backside and sides to reduce heat loss [10]. The glass cover will enable it to transmit about 80–90 of the incident solar radiation to the absorber and shield the system against environmental debris and the loss of heat to the surroundings through conventional means [11]. Porous media can also be combined further to enhance the heat transfer surface area and to facilitate mixing of air [12]. Of the media, air is the most favored medium of these collectors as it finds application in preheating and ventilation activities [13, 14].
Various studies have been conducted on the optimization of these systems. Pang et al. [15] discovered that increasing the coolant flow rate helps avoid the problem of absorbing overheating as well as enhances thermal efficiency. Tekkalmaz et al. [16] showed that dual-glass covers will minimize convective loss, which will enhance the efficiency, which is 12% higher compared to single-cover designs. Studies conducted by Cruz et al. [17] revealed that seasonal optimization of the collector, by changing the inclination of the collector, could maximize efficiency by as much as 18%. Also, Patel [18] found that with high conductivity fluids like mixtures of ethylene glycol, it is possible to increase the efficiency by 20% in cold climates. Lastly, El-Sebaii et al. [19] established that daily thermal efficiency can be improved by 15 by improving the back-side insulation.
Although porous media have been extensively used to promote performance, current studies tend to concentrate on steady-state conditions, ignoring dynamic thermal processes in changing climatic conditions. Comparative data are missing significantly on the ethical dilemma in terms of rapid thermal response and heat retention. This paper fills these gaps by conducting an experiment comparing porous media of glass balls and metal fibers in actual outdoor environments. This study offers a new separation between short-term heat gain and long-term thermal stability by studying seasonal differences and temporary performance through the analysis of these parameters, which can be valuable in providing real-life references on the choice of material used in solar heating and ventilation systems.
This part is about the experimental methodology that would be employed to test the thermal performance of a solar air heater that is integrated with porous media at different speeds. The description of the experimental setup, the operating conditions, measuring instruments, and data analysis procedures provides detailed descriptions to enable clarity and reproducibility.
2.1 Description of the solar air heater
Two solar air heaters, which were identical, were designed and tested in the outdoor environment. A collector was made of a rectangular-shaped enclosure; the dimensions of the collector were 100 cm × 80 cm × 10.2 cm, and it was fixed on a movable base to enable the inclination angle to be adjusted. The collectors were mounted on the rooftop of the Renewable Energy Research Unit of Hawija Technical Institute (35.19 °N, 43.46 °E), and they were exposed to the same amount of sunlight.
2.2 Porous media characteristics
The research involved two porous media, namely, glass balls and metal fibers. The porous materials were evenly applied across the plate of the absorber to increase the surface area of heat transfer and to create turbulence of air. Although metal fibers are defined as highly thermal conductive and possess a high heat uptake rate, glass balls have a high thermal inertia, which allows their cooling to maintain heat for a long period.
2.3 Experimental setup and operating conditions
The three representative months (August, September, and October, 2024) were used as the period of carrying out the experiments so as to capture the various climatic conditions. August, September, and October were adjusted to 1 m/s, 2 m/s, and 3.5 m/s, respectively. The measurements were conducted between the time of 9:00 AM and 16:00 PM in clear sky conditions with less wind effect.
Experimental measurements were conducted on a single representative day for each selected month (August, September, and October) due to operational constraints. As a result, the dataset provides limited temporal resolution and does not capture short-term variability or stochastic disturbances within each month. Therefore, the analysis focuses on identifying deterministic performance trends under comparable operating conditions rather than performing a comprehensive statistical or probabilistic evaluation. Extended measurement campaigns with higher sampling frequency are required to fully characterize long-term system behavior and variability.
2.4 Instrumentation and measurement procedure
The intensity of solar radiation, ambient temperature, wind speed, and relative humidity were observed by means of a Davis Vantage Pro2 weather station. A K-type thermocouple was used to measure the temperature attached to an Applent AT4516 data logger with an accuracy as +-1 ℃. A hot-wire anemometer was used to measure air velocity at the collector outlet, and the error was +-0.03 m/s.
2.5 Data reduction and performance parameters
Standard energy balance equations were used to determine the useful heat gain, mass flow rate, and thermal efficiency of the solar air heater. It was calculated that the useful heat gain over the incident solar radiation on the collector surface is the thermal efficiency.
2.6 Uncertainty analysis
To measure the errors in the measurements of the experimental tools, an uncertainty analysis was done. The general uncertainty of the calculated parameters was calculated through the root-sum-square method, which is dependent on the uncertainty of temperature, air velocity, and solar radiation measurements.
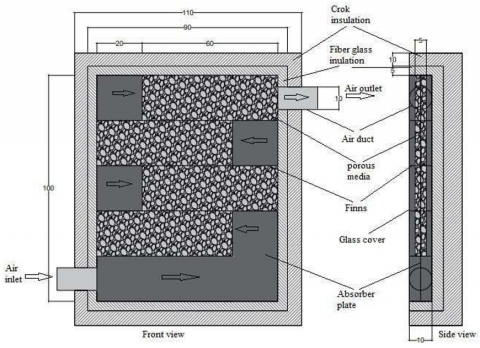
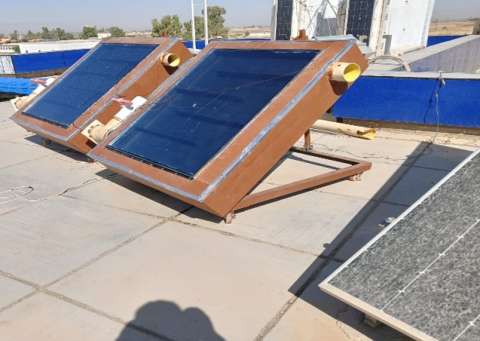
In order to reach the objectives of the research, two similar practical models were designed at a certain angle and in specific variable weather conditions to determine the efficiency of solar collectors. Solar collector model is given in Figure 1, and the models that are mounted on the top of the Renewable Energies Research Unit at the Hawija Technical Institute are given in Figure 2. It is 8 meters high and is situated in the north of Iraq, its location being 35.19 °N, 43.46 °E. The components of all the solar collector models include:
The device has a box-shaped structure of a rectangle, which is sustained by a rectangular base with wheels to allow changing the direction. The piece is made up of the following elements.
Figure 1. Dimensions of the solar collector
3.1 The iron structure
The steel frame of the 0.9 mm thick iron sheets is made in the shape of an open-top box, 100 cm long, 80 cm wide, and 10.2 cm high. Side apertures are designed in such a way that they allow air to pass through them.
3.2 Devise a base
The cast iron forms the basis of the device, and the size of the machine is 5 cm by 5 cm by 0.4 cm. The total length of the machine is 120 cm, and the width is 100 cm, making it rectangular-shaped. The bottom is shaped in a way that it has four plastic wheels to ensure navigation and movement.
3.3 Thermal insulation
The device would be encased in thermo insulation in two layers to ensure that there is the least heat loss. The first layer is the high-resistance glass wool that has a thickness of 5 cm and was used because it has better efficiency than other layers to achieve better thermal performance. An additional cork layer was applied at a thickness of 10 cm and was intended to increase the thermal insulation property and help prevent heat loss through the sides and the bottom of the device.
3.4 The glass cover
The device was covered at its top with two layers of glass, and the two layers were separated by an air gap to provide the best thermal insulation. The glass thickness of both glass layers is 4 mm, and the interstitial space is 9 mm. The glass has a transmittance (= 0.92) and emissivity (e = 0.88) of light.
3.5 Wooden casing
A contrasting wood was used to cover the exterior of the gadget to make it even more beautiful and enhance its external appearance. A 2 mm iron plate was used that had a 100 cm length and 80 cm breadth, and 4 fins attached to it on each side to increase the absorption area to mix the heat. All the fins measure 60 cm long, 5 cm wide, and 0.9 mm thick, and they are heterogeneously arranged to allow the passage of air between them. The board was enclosed within a frame to maintain its straightness with the weight of the porous medium, and this left two holes on the sides to allow air to pass through. The board and fins have been sprayed with a matte charcoal black spray paint that is very resistant to heat and can withstand a temperature over 600 ℃. To ensure the functioning of the device under forced load and control the airspeed both at the entrance and exit, as in Figure 2, two small entrance and exit fans with a capacity of 26 W each were installed.
Figure 2. Wooden casing for the device
3.6 Apparatus and tools utilized in the experiment
High-precision, low error variates to measure the required variables were used to ensure good results and reduce the error of measurements. The measurements have been carried out on the location of the system installation as a way to ensure the accuracy and real data. The devices used and their work mechanisms are as follows: The weather station that was located on the roof of the renewable energies research unit of the Technical Institute was installed in Hawija, in coincidence with the placement and direction of the solar complex. The Vantage Pro2 system is a complex device manufactured by Davis, and it provides accurate readings of meteorological parameters such as the intensity of solar radiation, temperature of seawater, relative humidity, atmospheric pressure, as well as speed of the wind and many other weather parameters.
Temperatures were monitored using a multi-channel temperature meter, which was the Applent (AT4516), and the thermocouples were sixteen K-type and had an accuracy of +- 1 ℃. Calibration of the thermocouples was carried out, and the error ratio was determined to check the accuracy of the measurements. The thermocouples were appropriately distributed to the investigated models as follows: two for determining the air input and outlet temperatures. The temperature of the absorber plate was measured using four sensors, the temperature of the glass cover using one sensor, and the temperature of the porous medium using another sensor. A device of air speed (Hot wire) was used to measure the air speed at the outlet of the collector, which had an error of (+- 0.03 m/s). The device is used to detect air velocity in pipes and ducts, and the end of the device has a long lever that is sensitive to gathering speed. The calibration of the equipment was checked, and the error ratio was also confirmed to ascertain that the measurements were accurate.
The subsequent formula allows us to ascertain the quantity of heat received by the solar collector [20]:
$Q_u=\dot{m} \cdot c_p\left(T_{\text {out }}-T_{{in }}\right)$ (1)
where, $\dot{m}$ is mass flow rate of air, cp is specific density at constant pressure of air, $Q_u$ is the heat gain, $T_{in}$ is the temperature of the air entering the collector absorber, and $T_{out}$ is the air temperature leaves the collector absorber.
The mass flow rate has been calculated as follows [21]:
$\dot{m}=\rho A_d V_{a i r}$ (2)
where, $A_d$ is the cross-sectional area of the heater inlet, $V_{a i r}$ is air velocity, $\rho$ is the density of the air egressing the solar collector.
By using (1) and (2), density can be defined as [22]:
$\rho=1.1614-0.00353\left[\left(T_{{out }}+273\right)-300\right]$ (3)
The specific heat can be determined using (4) given as follows [20]:
$c_p=\left[1.007+0.00004\left(\left(T_{{out }}+273\right)-300\right)\right] \times 10^3$ (4)
Using Eqs. (1)-(4), the thermal efficiency of the solar collector can be calculated as in Eq. (5) given as follows [23]:
$\eta_{{th }}=\frac{Q_u}{\mathrm{I}_{{solar }} \times \mathrm{A}_{{front }}} \times 100 \%$ (5)
The findings encompass a margin of error due to the constraints of the equipment utilized in the investigation, with the error rates for the devices. In addition, Eq. (6) is derived to determine the error rate of the apparatus utilized in the experiment [24].
$\omega_R=\sqrt{\left(\frac{\partial \eta}{\partial x_1} \times \Omega_1\right)^2+\left(\frac{\partial \eta}{\partial x_2} \times \Omega_2\right)^2+\cdots \ldots .\left(\frac{\partial \emptyset}{\partial x_n} \times \Omega_n\right)^2}$ (6)
The empirical study aimed to evaluate the performance of the Solar Complex over three months: August, September, and October 2024. Air velocity was measured at varying rates: 1 m/s in August, 2 m/s in September, and 3.5 m/s in October. The first day of each month was selected for the study, ensuring calm winds and clear, cloudless weather conditions.
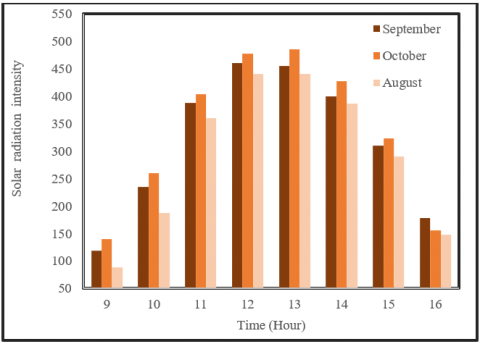
Figure 3. Solar radiation intensity
5.1 Solar radiation intensity
Figure 3 indicates the variation of the intensity of the solar radiation in the day, 9:00 AM to 16:00 PM; August at (V = 1 m/s), September at (V = 2 m/s) and October at (V = 3.5 m/s) the month of August, September and October respectively, which denotes how well the thermal system can convert solar energy into useful heat. According to the figure, the strength of the solar radiation in all months is relatively lower at 9:00 AM; the radiation is highest in October at an average of 140 W/m2, compared to September and August, which had lows of 120 and 90 W/m2, respectively. It was revealed that the month of October prevails early, and this means that the morning is more intense in precipitating solar radiation. The strength of the solar radiation at all three months is gradually rising with time, as the value of the curves is on the rise, which culminates at around 13:00 PM. At this peak, the intensity of the radiation is the highest, with almost 485 W/m2 in October, almost 460 W/m2 in September, and almost 445 W/m2 in August. The implication of this action is that October possesses greater solar radiation absorption capacity within the best hours, which can be attributed to more favorable atmospheric and solid incidence conditions.
The strength of the solar radiation at the solar radiation at after 13:00 PM decreases in the afternoon, as can be seen in the downward movement of the curves. The values obtained at 16:00 PM fall to approximately 150 W/m2 in October, 175 W/m2 in September, and 145 W/m2 in August. Generally, the figure shows that the intensity of the solar radiation in October is greater in most areas of the day, which could have a positive impact on the performance and efficiency of the solar thermal systems that make use of the main source of energy, which is the solar radiation.
5.2 The temperature difference of the exiting air
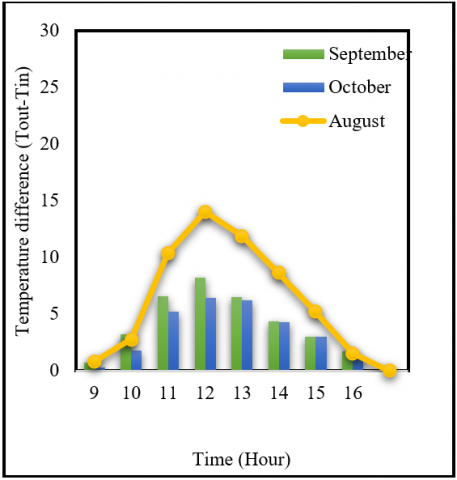
The thermal performance of the system is shown in Figure 4 as the daily change in the temperature difference between the air outlet and inlet (Tout -Tin) between 9:00 AM and 16:00 PM in the months of August, September, and October. All months have low temperature differences, with August having about 1 ℃, then September (10 ℃) and October (10 ℃), which means that solar heating is still restricted at this early part of the day. A rise in the intensity of solar radiation towards midday increases (Tout-Tin) at a consistent rate, reaching its peak at a time around 12.00 PM in August, which has an ideal temperature difference of about 14 ℃, showing a high level of heat absorption and conversion in the air duct. Comparatively, the mean peak value is moderate at 8.2 ℃ in September and lowest in October at 6.5 ℃, which is explainable by the variation in ambient conditions and the angles of incidence of the sun. The difference in temperature decreases slowly in the afternoon after noon. At 14:00 PM, August continues to be more thermally efficient (about 12 ℃), but September and October fall down to about 6.5 ℃ and 6.2 ℃, respectively. At 16: 00, the disparities of temperatures of all months are unified to low values, 1.5 ℃ to 2 ℃, which is the cessation of the useful solar heating season. On the whole, this figure shows that the thermal performance of August is better, and the impact of climatic conditions and system design parameters on the efficiency of solar air heating systems is great.
Figure 4. The difference in temperature (Tout-Tin) between the exit and the entrance
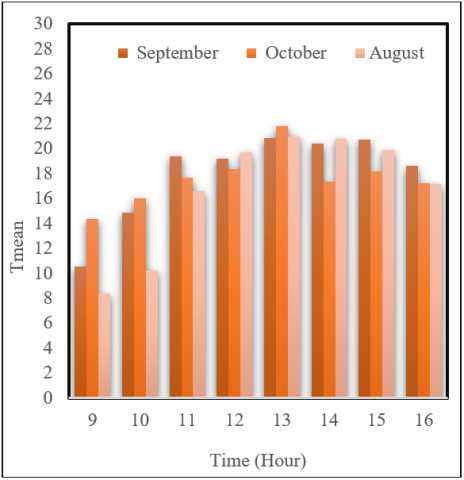
5.3 Average temperature of inlet and outlet air
Figure 5 shows how the average temperature varies between 9:00 AM and 16:00 PM in August, September, and October under varying seasonal conditions of the solar system. The maximum average temperature is observed in October (≈ 14.5 ℃), then in September (≈ 10 ℃), and then in August (≈ 8.5 ℃). This means that during this season, the temperature rises earlier in the morning as the ambient temperature is higher. This tendency is still present at 10:00 AM, with October attaining some 16 ℃, a little higher than in September (15 ℃), and in August (also 10 ℃) a delayed heating reaction in August at the beginning of the day can be observed. In the middle of the day, the temperature values become very close to each other; at the moment of noon, the average temperature of all systems is similar and reaches 19–20 ℃, which is the time of maximum solar radiation and maximum efficiency of systems.
The warmer temperature occurs at 13.00 PM when the average temperature has its daily maximum, with October being the highest (around 22 ℃), slightly higher than August and September (around 21 ℃). This demonstrates that there was a performance edge in October when the solar conditions were at their peak. Subsequently, there is a slight decrease in the average temperatures in the afternoon. At 14:00 PM, October decreases more sharply to approximately 17.5℃, whereas August and September have much higher values (approximately 21 ℃ and 20.5 ℃, respectively). At 16:00 PM, the temperatures are once again united to about 17 ℃ or 18.5 ℃ for all months, which is the decrease in the level of the solar input at the end of the day. On the whole, Figure 5 indicates that seasonal climatic conditions, including ambient temperature, solar radiation intensity, and incidence angle, have an impact on the thermal behavior of the system. The fact that temperatures came together around the peak hours proves that the system performs well in the presence of high amounts of radiation, and the fact that the temperatures drop in the afternoon highlights the importance of material thermal properties in heat retention.
Figure 5. The average temperature between entry and exit
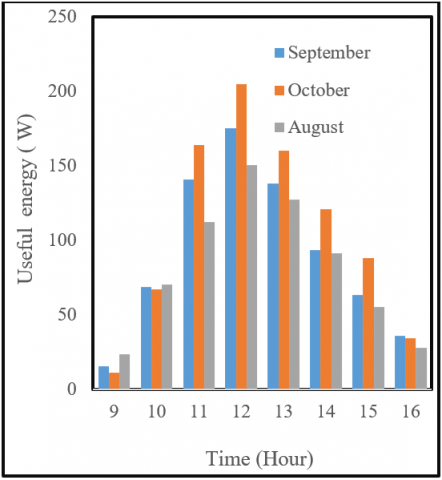
5.4 The useful thermal energy of the solar collector
Figure 6 shows the useful energy harvested by the solar system at 9:00 AM to 16:00 PM in the months of August, September, and October, indicating how seasonal conditions impact thermal performance. The extracted power is usually low at all months, with August registering the highest (= 25 W), followed by September (= 15 W) and October (= 10 W), meaning that the thermal response is earlier in August in the morning hours.
Figure 6. Energy of a solar collector
The closer values of the useful energy are seen at 10:00 AM when the useful energy values are approximately 6575 W in all months, and this is where the effective solar collection begins. There is a sharp rise during the time of the day with maximum values of 12:00 PM, and the highest useful energy output is 12:00 PM. (120 W) then September (180 W) and August (150 W) with the higher values as a result of the higher solar irradiance and better heat absorption properties of the time. The usable energy reduces slowly after noon due to a reduction in the solar radiation. Even at 13:00 PM, October continues to perform better (the best is approximately 160 W), as compared to September (the best is approximately 140 W) and August (the best is approximately 130 W). This downwards trend persists into the afternoon, as at 14:00 PM, the extracted energy has decreased to approximately 120 W in October.
At 15:00, the values drop to about 90 W, 65 W, and 55 W in October, September, and August, respectively. Lastly, the useful energy values are equal to all months (around 35–40 W) at 16:00 PM, which means the conclusion of the effective sunlight gathering time. In general, it can be seen that in most of the day, October will show the greatest useful energy production, and it was also found that system efficiency greatly relies on how strong the solar radiation is, and seasonal climatic conditions, and it is also noted that there is a convergence at the early morning hours and late afternoon, and this indicates that the system efficiency depends greatly on the amount of solar radiation available.
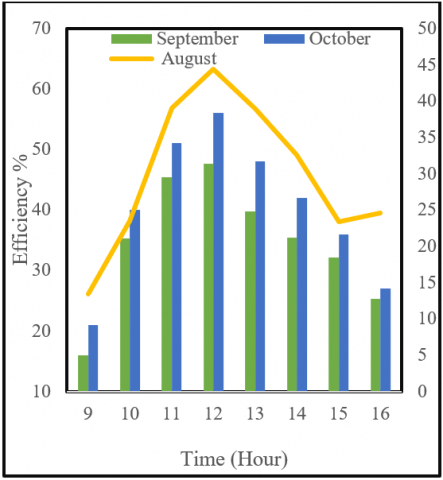
5.5 Thermal efficiency of the solar collector
Figure 7 represents how the thermal efficiency of the solar system changed between 9:00 AM and 16:00 PM during August, September, and October, and the impacts of the seasonal conditions on the conversion of solar radiation to useful thermal energy.
Figure 7. Comparison of the thermal efficiency
The values of efficiency are low at 9:00 AM, although all months have fairly high efficiency, with the highest efficiency of 21% in October (15%), and the lowest efficiency of 13%, which reflects that the thermal response was more efficient in October, in the morning. The thermal efficiency also increases as the solar radiation increases. The efficiency also rises to an average of 40% at 10:00 AM in October, contrary to 35% in September and almost 24% in August, which confirms the accelerated reaction of the system when conditions are typical of October. Its efficiency is further enhanced towards midday, and maximum efficiency is recorded in positions of 11:00 AM, where the highest value is achieved by October (58%), then by September (47%), and finally by August (45%), indicating that the system is working optimally under the maximum sunshine, especially in the month of October. The efficiency starts to decline slowly after noon and retains the same ranking as other months. The efficiency values drop to only around 50% of October, 40% of September, and 39% of August, which is the overall impact of lower radiation and higher thermal losses. Additional cuts are seen in the afternoon time; at 14:00 PM, efficiencies decrease to approximately 42%, 36%, and 33% in the months of October, September, and August, respectively.
A stronger decline is also found during 15:00 PM, with the highest in August (approximately 24%), than in the months of September (approximately 32%) and October (approximately 36%). Lastly, the efficiency values approach 26-27% for all months at 16:00 PM meaning that the effective solar collection phase is over. In general, this number shows that the performance of October is always better, which proves the significant impact of the sun radiation intensity, environmental conditions, and thermal properties of the system.
Generally, the comparative monthly analysis showed the apparent thermal and energetic characteristics of the solar air collector with different climatic and operational conditions. The solar radiation intensity was highest in October, with a peak of about 485 W/m2 at 13:00 PM in the day, as compared to 460 W/m2 in September and 445 W/m2 in August. The increase in the radiation level can be mainly explained by the presence of a better solar altitude angle and clearer weather conditions in October, which increased the amount of incident radiation that is incident on the collector surface and positively impacted the thermal performance of the system. Nevertheless, the largest outlet-inlet air temperature difference (Tout-Tin) was experienced during the month of August, with high values of 14 ℃ at noon and low values of 8.2 ℃ and 6.5 ℃ during the months of September and October, respectively. This observation is primarily attributed to the fact that there is a reduced air velocity in August, and therefore, the residence time of the air in the collector was longer, and the absorber plate and porous medium were able to absorb more heat. Conversely, greater air speeds in September and October caused a shorter contact duration, leading to a low temperature increase, though radiation intensities were high.
Regarding ambient conditions, October was observed to have the highest average air temperature in all cases of early mornings (14.5 ℃ at 9:00 AM), and all the months had similar temperature averages of about 19–20 ℃ at noon. This intersection suggests that at high solar radiation, the collector is in a quasi-steady thermal condition with the solar input taking over as the most significant variable and minimizing the impact of climatic variations. As a result, the useful thermal energy obtained in the collector was greatest in October, over 200 W at peak hours, as compared to 180 W in September, and 150 W in August. This has been enhanced by the combined effect of increased solar radiation and the rate of increase in the air mass flow rate, which promoted the heat removal of the absorber and, at the same time, minimized the thermal loss to the environment. Consequently, the peak thermal efficiency was also recorded in October with a thermal efficiency of around 58% at midday, as compared to September and August, which recorded thermal efficiencies of 47% and 45%, respectively. These results indicate that it is not only the size of temperature increase that determines thermal efficiency, but also the ratio between useful heat gain and the incident solar energy. Moreover, daily thermal response analysis revealed that the performance of August in terms of thermal response in the peak hours was strong, but its performance deteriorated quickly in the afternoon, meaning that it lacked thermal stability. On the other hand, October exhibited a more consistent thermal performance following the peak radiation conditions that can be linked to the enhanced heat removal and decreased thermal losses and heat gain, it is more applicable in other applications where continuous and effective thermal performance is a requirement.
Besides the results found, more studies are suggested to increase the extent to which the solar air collector system proposed can be used. Further research can be carried out into a more detailed parametric exploration of air mass flow rate, porous medium properties, and surface modifications of an absorber to allow even more of its thermal efficiency to be captured and its operational stability to be improved. Experimental testing of the system over long durations under various seasons and climatic conditions would also be useful in terms of determining the durability and year-round functionality of the system. Application-wise, the low thermal variability and increased efficiency noticed especially in October suggest that the proposed collector can be highly useful in real-life applications, and that may include space heating of residential structures, solar-aided agricultural drying, and pre-cooling of ventilatory air. The system can also be enhanced to suit the system with energy storage facilities or hybrid solar technologies to enhance its applicability in continuous and large-scale thermal energy solutions.
The authors would like to express their sincere appreciation to their affiliated institutions for providing the facilities and support necessary to conduct this research. Special thanks are extended to Mustansiriyah University, Al-Farahidi University, Al-Kitab University, Universiti Malaysia Perlis, Northern Technical University, Çankırı Karatekin University, University of Al-Ameed, Al-Bayan University, and Al-Mustaqbal University College for their continuous academic and research support.
[1] Saleh, M.J., Atallah, F.S., Ahmed, O.K., Algburi, S. (2024). Performance augmentation of photovoltaic solar chimneys using asphalt material. Energy Storage, 6(4): e640. https://doi.org/10.1002/est2.640
[2] BP PLC. (2023). Statistical Review of World Energy 2023.
[3] Merie, F.H., Ahmed, O.K. (2024). Analysis of the performance of the PV/solar chimney: An experimental study. Results in Engineering, 7(1): 1-12. https://doi.org/10.56286/z1k7az75
[4] Merie, F.H., Ahmed, O.K. (2025). Performance augumation of PV/solar chimney using gravel bed: Experimental appraisal. Energy Storage, 7(2): e70149. https://doi.org/10.1002/est2.70149
[5] Ibrahim, A.K., Ahmed, O.K., Algburi, S. (2023). Optimum angle of reflective mirrors integrated on PV/Trombe wall: An experimental assessment. Energy Reports, 10: 591-603. https://doi.org/10.1016/j.egyr.2023.07.020
[6] Abed, F.M., Ahmed, O.K., Ahmed, A.E. (2018). Effect of climate and design parameters on the temperature distribution of a room. Journal of Building Engineering, 17: 115-124. https://doi.org/10.1016/j.jobe.2018.02.007
[7] Jouybari, H.J., Saedodin, S., Zamzamian, A., Nimvari, M.E. (2017). Experimental investigation of thermal performance and entropy generation of a flat-plate solar collector filled with porous media. Applied Thermal Engineering, 127: 1506-1517. https://doi.org/10.1016/j.applthermaleng.2017.08.170
[8] Merie, F.H., Ahmed, O.K. (2024). Experimental assessment of the performance of the PV/solar chimney under the cloudy weather. Results in Engineering, 23: 102605. https://doi.org/10.1016/j.rineng.2024.102605
[9] Algburi, S., Ahmed, O.K., Abdullah, A.A., Atallah, F.S. (2023). Comparative assessment of PV/Trombe wall performance: Compound influence of paraffin wax and reflective mirrors. Results in Engineering, 20: 101433. https://doi.org/10.1016/j.rineng.2023.101433
[10] Kareem, M.W., Gilani, S.I., Habib, K., Irshad, K., Saha, B.B. (2017). Performance analysis of a multi-pass solar thermal collector system under transient state assisted by porous media. Solar Energy, 158: 782-791. https://doi.org/10.1016/j.solener.2017.10.016
[11] Ali, F.H., Al-amir, Q.R., Hamzah, H.K., Alahmer, A. (2025). Integrating thermal phase-change material energy storage with solar collectors: A comprehensive review of techniques and applications. International Communications in Heat and Mass Transfer, 162: 108606. https://doi.org/10.1016/j.icheatmasstransfer.2025.108606
[12] Sharma, B.K., Kumar, A., Almohsen, B., Fernandez-Gamiz, U. (2023). Computational analysis of radiative heat transfer due to rotating tube in parabolic trough solar collectors with Darcy Forchheimer porous medium. Case Studies in Thermal Engineering, 51: 103642. https://doi.org/10.1016/j.csite.2023.103642
[13] Awad, M.M., Ahmed, O.K., Ali, O.M., Alwan, N.T., Yaqoob, S.J., Nayyar, A., Abouhawwash, M., Alrasheedi, A.F. (2022). Photovoltaic thermal collectors integrated with phase change materials: A comprehensive analysis. Electronics, 11(3): 337. https://doi.org/10.3390/electronics11030337
[14] Ahmed Mohammed, M., Ali, O.M., Ibrahim Musa, J. (2024). A comprehensive review on the thermal management of solar panels. Energy Sources, Part A: Recovery, Utilization, and Environmental Effects, 46(1): 8646-8670. https://doi.org/10.1080/15567036.2024.2368506
[15] Pang, W., Cui, Y., Zhang, Q., Yu, H., Zhang, L., Yan, H. (2019). Experimental effect of high mass flow rate and volume cooling on performance of a water-type PV/T collector. Solar Energy, 188: 1360-1368. https://doi.org/10.1016/j.solener.2019.07.024
[16] Tekkalmaz, M., Timuralp, Ç., Sert, Z. (2020). The effect of the use of different cover materials on heat transfer in flat solar collectors. Journal of Thermal Engineering, 6(5): 829-842. https://doi.org/10.18186/thermal.800158
[17] Cruz, J.M., Crepaldi, S.A., Gutiérrez-Urueta, G.L., Rubio, J.D.J., Zacarías, A., Jiménez, C., Romage, G., Romage, J.A., López, A., Balcazar, R. (2024). Performance assessment of flat plate solar collector using simple and hybrid carbon nanofluids at low thermal capacity. Applied Sciences, 14(19): 8732. https://doi.org/10.3390/app14198732
[18] Patel, A. (2023). Analyzing heat transfer fluids for improved solar water heater performance. International Journal of Development Research. https://doi.org/10.37118/ijdr.27172.11.2023
[19] El-Sebaii, A.A., Al-Ghamdi, A.A., Al-Hazmi, F.S., Faidah, A.S. (2009). Thermal performance of a single basin solar still with PCM as a storage medium. Applied Energy, 86(7-8): 1187-1195. https://doi.org/10.1016/j.apenergy.2008.10.014
[20] Li, Y., Liu, S. (2014). Experimental study on thermal performance of a solar chimney combined with PCM. Applied Energy, 114: 172-178. https://doi.org/10.1016/j.apenergy.2013.09.022
[21] Cottam, P.J., Duffour, P., Lindstrand, P., Fromme, P. (2016). Effect of canopy profile on solar thermal chimney performance. Solar Energy, 129: 286-296. https://doi.org/10.1016/j.solener.2016.01.052
[22] Bassiouny, R., Korah, N.S. (2009). Effect of solar chimney inclination angle on space flow pattern and ventilation rate. Energy and Buildings, 41(2): 190-196. https://doi.org/10.1016/j.enbuild.2008.08.009
[23] Xia, Y., Lin, X., Cheng, Z., Xie, F., Huang, J. (2023). Numerical study on the enhanced thermal performance of the porous media‐assisted flat‐plate solar collector. International Journal of Energy Research, 2023(1): 2244771. https://doi.org/10.1155/2023/2244771
[24] Abdullah, A.A., Atallah, F.S., Algburi, S., Ahmed, O.K. (2022). Impact of a reflective mirrors on photovoltaic/trombe wall performance: Experimental assessment. Results in Engineering, 16: 100706. https://doi.org/10.1016/j.rineng.2022.100706