Vo Van Tuyen*![]()
© 2025 The author. This article is published by IIETA and is licensed under the CC BY 4.0 license (http://creativecommons.org/licenses/by/4.0/).
OPEN ACCESS
This study applied the Decision-Making Trial and Evaluation Laboratory (DEMATEL) method to analyze the causal relationship between risk factors leading to natural forest degradation in Quang Ngai province, Vietnam. While DEMATEL has been widely applied in environmental and risk analysis, empirical studies that explicitly uncover the causal structure of forest degradation risks at the provincial level in Vietnam remain limited. This study addresses this gap by quantitatively distinguishing between root (cause) risks and outcome (effect) risks based on both direct and indirect influences. Twelve main risks were identified through expert assessment. The DEMATEL method was then used, and the results classified the risks into two groups: cause risks and consequence risks. Of which, R11 has the highest positive (r − c) value (0.1152), indicating that farming practices are the key cause of other risks; R1 and R2 have (r − c) = 0.0793 and 0.2997, respectively, reflecting that livelihood pressure and economic exploitation have a strong impact on other risks. The prominent consequence risks include forest cover loss and soil erosion (R9, r − c = -0.6245), which are directly affected by the cause factors. Based on the DEMATEL-derived causal relationships, the study links policy recommendations directly to the identified systemic drivers. Priority policies are therefore proposed to reduce livelihood pressure, transform slash-and-burn farming practices, strengthen coordination in forest management, enhance environmental education, and mitigate forest fire risks, thereby effectively addressing the root causes of natural forest degradation in Quang Ngai province.
DEMATEL, natural forest degradation, forest management, climate change impacts, risk management, Quang Ngai, Vietnam
Natural forests play an essential role in maintaining ecological balance, regulating climate, and protecting soil and water resources, as well as providing sustainable livelihoods for local communities [1, 2]. However, in recent decades, natural forest degradation has become one of the serious environmental challenges in many regions of the Central and Central Highlands of Vietnam [3], of which Quang Ngai province is a notable example. With mountainous terrain interspersed with coastal plains, Quang Ngai possesses a rich forest ecosystem but is also strongly affected by socio-economic activities, along with increasingly extreme weather events due to climate change [4].
In fact, in recent years, Quang Ngai has frequently recorded severe natural disasters such as upstream floods, landslides, extreme rains, and prolonged droughts, especially in mountainous areas such as Ba Dong, Kon Dao, Ba To, and Dak To. Heavy rains causing flash floods and landslides not only destroy people's infrastructure but also destroy forest areas, wash away topsoil, and affect the natural regeneration of forests. On the contrary, prolonged heat waves and droughts in the dry season increase the risk of forest fires and reduce soil moisture. These phenomena, combined with human impacts such as illegal logging, agricultural expansion, single-species economic forest plantations (acacia, eucalyptus), or a lack of close supervision in forest resource management, have significantly reduced the area and quality of natural forests in Quang Ngai.
In addition to natural factors, socio-economic causes, such as livelihood pressure, lack of sustainable alternative livelihood models, or limited public awareness of the importance of forest protection, are also indirect factors but have far-reaching impacts [5]. In particular, the lack of synchronization in the management policy system, land use planning, and coordination between forest management agencies has created gaps in the protection and restoration of natural forests [6]. Identifying and understanding the cause-and-effect relationship between these factors is an urgent requirement to propose more effective and sustainable forest management solutions. In that context, the Decision-Making Trial and Evaluation Laboratory (DEMATEL) method is considered a modern and suitable analytical tool for studying complex systems such as forest degradation. DEMATEL is a multi-criteria decision-making (MCDM) tool that allows identifying and quantifying the level of mutual influence between factors, thereby distinguishing between “cause” and “effect” factors in a multidimensional interaction network [7]. Applying DEMATEL not only helps to model the structure of cause-and-effect relationships between factors but also supports managers in identifying root factors that need priority intervention, instead of just dealing with the consequences [8]. Different from traditional descriptive statistical methods, DEMATEL emphasizes systematicity and policy orientation, which is very suitable for environmental studies and natural resource management.
This study was conducted to analyze and clarify the cause-and-effect relationship between factors leading to natural forest degradation in Quang Ngai province through the application of the DEMATEL method. The research results not only contribute to identifying key factors driving forest degradation but also provide a scientific basis for policymaking, building strategies for sustainable management and restoration of natural forests in the context of current climate change and economic development.
Despite increasing attention to forest degradation in Vietnam, existing studies largely rely on descriptive analyses or methods that focus on identifying factors or assessing their relative importance, without explicitly modeling the causal interdependencies among risks. As a result, policymakers often address visible consequences rather than the underlying systemic drivers of forest degradation. Moreover, empirical studies that quantitatively distinguish between cause-and-effect risks at the provincial level remain limited. This study addresses this research gap by applying the DEMATEL method to uncover the causal structure of natural forest degradation risks in Quang Ngai province, thereby providing a stronger analytical foundation for priority-setting in forest management policies.
2.1 The phenomenon of natural forest degradation
Degradation of natural forests is a global environmental phenomenon that has serious impacts on biodiversity, soil quality, water regulation, and resilience to natural disasters [9]. Internationally, studies have shown that forest degradation is caused by a combination of natural and anthropogenic factors. Natural disasters such as storms, floods, prolonged droughts, and forest fires reduce the regeneration capacity of forests and weaken the vegetation layer [10]. At the same time, logging activities, agricultural expansion, land use conversion, and population pressure also increase the risk of deforestation and ecological quality decline [11, 12].
In Vietnam, natural forest degradation is becoming more serious in the central provinces [13]. Illegal logging, slash-and-burn cultivation, and mono-species afforestation are the main causes of the decline in the area and quality of natural forests [14]. Quang Ngai, with its mountainous terrain interspersed with coastal plains, is strongly affected by both natural and human disasters. In recent years, this province has frequently experienced upstream floods, landslides, extreme rains, and prolonged droughts, especially in mountainous areas such as Ba Dong, Kon Dao, Ba To, and Dak To. These phenomena not only cause deforestation and topsoil destruction but also directly affect the natural recovery capacity of forests. In addition, socio-economic factors such as livelihood pressure, limited community awareness of forest protection, and lack of synchronization in forest management policies are also indirect factors but have far-reaching impacts. The complex interactions between natural and anthropogenic factors make identifying the root causes of forest degradation a challenge.
2.2 Application of MCDM tools in risk research
In the context of increasingly complex risk problems influenced by many interacting factors, MCDM tools have become an effective method to support researchers and managers in evaluating, comparing, and selecting optimal options under uncertain conditions. Rafiei-Sardooi et al. [15] applied TOPSIS and machine learning in urban flood risk assessment. Tuyen [16] applied AHP in prioritizing risks in tourism activities. Van et al. [17] applied AHP and Pareto in prioritizing risks in manufacturing activities. Nguyen et al. [18] applied AHP and a risk matrix in prioritizing risks in food supply chains. Trần et al. [19] applied AHP in prioritizing risks in rice distribution activities. Cheng et al. [20] applied ANP to assess high-speed rail operational risks. Zhang et al. [21] assessed the operational risk of water supply and drainage using ANP-fuzzy. AbdolkhaniNezhad et al. [22] applied the combination of ANP-TOPSIS in assessing the environmental risk of urban landfills. Liu et al. [23] used FMEA in maritime transport risk management.
The DEMATEL method has been applied in risk-related studies. Zhu et al. [24] applied DEMATEL in assessing the operational and maintenance management risks of electric power communication networks. Dehghani et al. [25] applied DEMATEL in assessing the risks of irrigation projects. Benabdallah et al. [26] assessed the risk of a sustainable supply chain using the DEMATEL method. Natural forest degradation is a result of complex interactions between natural and anthropogenic factors, in which extreme events such as floods, landslides, droughts, and forest fires play an important role. Applying DEMATEL in this context will help identify root factors and quantify the level of influence and interactions between them, thereby supporting managers and policymakers to come up with priority, effective, and sustainable solutions. DEMATEL is a powerful tool for analyzing cause-and-effect relationships and identifying root factors, supporting the prioritization of effective interventions [27]. This study will fill the research gap in Quang Ngai, providing quantitative data on forest degradation risks and supporting sustainable forest management policy-making under climate change and socio-economic pressures.
Although various MCDM methods such as AHP, TOPSIS, and ANP have been widely applied in environmental and risk assessment studies, these approaches mainly focus on ranking or weighting risk factors based on their relative importance. They do not explicitly capture the direction and intensity of causal relationships among interdependent risks. In contrast, DEMATEL is specifically designed to analyze complex systems with feedback effects by quantifying both direct and indirect influences and classifying factors into cause-and-effect groups. This characteristic makes DEMATEL particularly suitable for analyzing natural forest degradation, where socio-economic, environmental, and institutional factors interact dynamically.
3.1 Consult an expert to determine risk criteria
To identify and screen risk criteria related to natural forest degradation in Quang Ngai province, this study used the expert consultation method to collect in-depth opinions and ensure the objectivity of the criteria set. The expert consultation method is a popular tool in scientific research to collect in-depth expertise from individuals with experience and a specific understanding of the research field [28]. In this study, a total of 12 experts were selected to participate, including scientists in the fields of forestry, natural resource management, and climate change and managers with practical experience in the locality. The selection of experts was carried out using the purposive sampling method, based on criteria of professional qualifications, years of experience, and level of understanding of natural forest ecosystems in the research area.
The process of working with experts was carried out in two main stages. In the first phase, the research team developed a preliminary list of risk factors based on the literature review and previous studies. This list was sent to experts to assess the relevance and to add or remove inaccurate factors. Feedback was compiled, categorized, and adjusted to form a complete set of criteria. Working sessions were conducted through face-to-face interviews and online exchanges to ensure complete information collection and minimize bias in the assessment process. The list of risk criteria is presented in Table 1.
Table 1. The list of risk criteria
|
Criteria |
Sub-criteria |
Description |
|
Economics & Society |
(R1) Pressure on local people's livelihoods |
People in Quang Ngai, especially in the mountainous and midland areas, depend heavily on forests as their main source of livelihood, from logging and forest products to hunting and shifting cultivation. This pressure leads to high-intensity forest exploitation without a recovery plan, causing a decline in biodiversity and forest quality. In addition, when forests are degraded, people are forced to exploit other forest areas, creating an increasingly serious degradation spiral. |
|
(R2) Short-term economic value from timber and forest agricultural products exploitation |
Forest exploitation aimed at maximizing immediate economic benefits overwhelms forest management and conservation decisions. Activities such as logging, harvesting forest agricultural products, or harvesting secondary forest products bring quick economic benefits but cause long-term sustainable decline, leading to loss of forest land, decline in arable land, and reduced resilience of ecosystems to natural disasters. |
|
|
(R3) Lack of sustainable alternative livelihoods |
When alternative livelihood opportunities, such as high-tech agriculture, handicrafts, or ecotourism, are not developed or accessible to communities, forests become the only source of livelihood. The lack of sustainable alternatives increases pressure on illegal logging and hinders forest restoration and biodiversity conservation programs. |
|
|
Management & Policy |
(R4) Land and forest allocation policies still have limited effectiveness |
Despite policies on forest allocation to communities and households, many regulations are still not strict and have not been implemented synchronously, leading to forest land disputes and uncontrolled exploitation. These limitations reduce the sustainability of forest management and create opportunities for illegal exploitation to increase. |
|
(R5) Weak forestry law enforcement and monitoring |
Forest rangers and authorities often lack resources in terms of human resources, monitoring technology, and funding, leading to limited detection and handling of violations. As a result, illegal logging and deforestation for farming or timber extraction continue to occur, creating increasing pressure on forest ecosystems. |
|
|
(R6) Lack of coordination between regulatory agencies |
The lack of coordination among management levels, including forest rangers, local authorities, and communities, reduces the effectiveness of forest management and control. When information on exploitation, deforestation, or natural disaster risks is not shared and processed promptly, measures to prevent forest degradation become fragmented and delayed, making it difficult to achieve the desired results. |
|
|
Nature & Environment |
(R7) Climate change |
Extreme climate events, such as prolonged droughts, extreme rainfall, flash floods, and landslides, directly affect forest regeneration and ecological structure. Reduced forest resilience increases the risk of forest loss, soil erosion, and ecological damage, while also increasing the negative impacts of human forest exploitation activities. |
|
(R8) Natural and human-caused forest fires |
Forest fires occur due to dry natural conditions and slash-and-burn farming activities, causing loss of vegetation, biodiversity, and forest cover. In addition to direct damage, forest fires also reduce the ability of natural regeneration, increase the risk of erosion, and change the soil structure. |
|
|
(R9) Land cover loss and erosion |
When forests are logged, burned, or impacted by flash floods and landslides, topsoil is lost, reducing the soil’s ability to retain water and nutrients. This process not only hinders forest regeneration but also impacts agriculture and community livelihoods and increases disaster risk. |
|
|
Social |
(R10) Community awareness of forest protection is still low |
Lack of understanding of the ecological value and role of forests in climate regulation, natural disaster prevention, and biodiversity maintenance leads to unsustainable forest exploitation. When communities are not aware of the long-term impacts, forest protection efforts are unlikely to be effective. |
|
(R11) Practices of slash-and-burn cultivation and slash-and-burn farming |
This is a long-standing traditional practice in the mountainous areas of Quang Ngai, directly affecting the decline of natural forests, reducing land cover, and increasing erosion. This practice still exists due to the lack of alternative livelihood solutions and community awareness, increasing the risk of forest degradation. |
|
|
(R12) Lack of environmental education and communication |
The lack of education and communication programs on forest and environmental protection leads to limited community participation in forest management and protection activities, reducing the effectiveness of sustainable forest management measures and increasing the risk of degradation. |
In the second phase, experts were invited to participate in an in-depth survey to assess the level of influence and causal relationships between the identified criteria, from which the author performed calculations according to the steps of the DEMATEL method.
3.2 DEMATEL
DEMATEL is a method for analyzing complex systems and interacting factors, developed to determine the cause-and-effect relationships between factors in a system [29]. Unlike traditional quantitative methods, DEMATEL not only assesses the importance of each factor but also analyzes the direct and indirect effects between factors, thereby helping to understand the system structure and potential cause-and-effect relationships [30]. DEMATEL allows researchers to identify key causal factors, classify them into causes and effects, and visualize the relationships using a cause-and-effect diagram. According to Si et al. [31], the basic DEMATEL method implementation process consists of 6 steps:
Step 1: Determine the direct impact matrix based on the opinions of experts. Suppose H experts are participating in assessing the level of interaction between n risks. The level of impact of risk i on risk j is denoted by xij and is scored on a scale from 0 to 4, with the following corresponding meanings: 4 = very strong impact; 3 = strong impact; 2 = moderate impact; 1 = slight impact; 0 = almost no impact.
The k-th expert's assessment is in the form of an n × n matrix represented as follows:
$\left[\begin{array}{ccccc}0 & x_{12}^k & x_{13}^k & \cdots & x_{1 n}^k \\ x_{21}^k & 0 & x_{23}^k & \cdots & x_{2 n}^k \\ x_{31}^k & x_{32}^k & 0 & \cdots & x_{3 n}^k \\ \vdots & \vdots & \vdots & \ddots & \vdots \\ x_{n 1}^k & x_{n 2}^k & x_{n 3}^k & \cdots & 0\end{array}\right] \mathrm{k}=1,2,3 \ldots \mathrm{H}$
In this study, Step 1, the results from 12 experts were used to construct the initial direct relationship matrix, which is the basis for the subsequent calculation steps of the DEMATEL method. This approach helps to ensure that the criteria and relationships are determined not only based on theoretical grounds but also reflect local forest management practices and degradation trends.
Step 2: Find the average direct relationship matrix A. The matrix A is defined as follows:
$\left[\begin{array}{ccccc}0 & \frac{1}{H} \sum_{k=1}^H x_{12}^k & \frac{1}{H} \sum_{k=1}^H x_{13}^k & \cdots & \frac{1}{H} \sum_{k=1}^H x_{1 n}^k \\ \frac{1}{H} \sum_{k=1}^H x_{21}^k & 0 & \frac{1}{H} \sum_{k=1}^H x_{23}^k & \cdots & \frac{1}{H} \sum_{k=1}^H x_{2 n}^k \\ \frac{1}{H} \sum_{k=1}^H x_{31}^k & \frac{1}{H} \sum_{k=1}^H x_{32}^k & 0 & \cdots & \frac{1}{H} \sum_{k=1}^H x_{3 n}^k \\ \vdots & \vdots & \vdots & \ddots & \vdots \\ \frac{1}{H} \sum_{k=1}^H x_{n 1}^k & \frac{1}{H} \sum_{k=1}^H x_{n 2}^k & \frac{1}{H} \sum_{k=1}^H x_{n 3}^k & \cdots & 0\end{array}\right]$
Step 3: Find the normalized direct correlation matrix D.
$D=\frac{A}{S}$
where, S is the maximum value of the sum of rows and columns in matrix A.
Step 4: Find the general influence matrix T.
$T=D \times(I-D)^{-1}$
where, I is the identity matrix. In this study, I is a 12 × 12 identity matrix, with n = 12.
Step 5: Determine the sum of rows and columns of the T matrix.
Assume r and c are n × 1 and 1 × n vectors representing the sum of rows and the sum of columns of the T relational matrix.
The total impact includes the direct impact and the indirect impact caused by the i-th risk, denoted by ri, calculated by the following formula:
$r_i=\sum_{j=1}^n t_{i j}$
The total impact, including both direct and indirect effects on risk j from other risks, is denoted by cj and calculated using the following formula:
$c_j=\sum_{i=1}^n t_{i j}$
When i = j, the sum of (ri + cj) is the importance level of the i-th risk in the system. The difference of (ri − cj) represents the net impact contributed by the i-th risk to the system. In case (ri − cj) > 0, factor i is the cause factor, and if (ri − cj) < 0, factor i is the effect factor.
Step 6: Determine the threshold value and build the relationship map. Threshold value:
$\alpha=\frac{\sum_{i=1}^n \sum_{j=1}^n t_{i j}}{N}$
where, N is the total number of elements in the overall matrix T. After calculating the values of the pairs (ri + cj, ri − cj) of all risks, a diagram showing the causal relationship can be drawn. Before drawing this diagram showing the causal relationship, a threshold value needs to be determined to eliminate unnecessary relationships. The threshold value α is the average value of all elements in the matrix T. If the sum (ri + cj) of the i-th risk is very small, it means that the i-th risk is quite independent, and therefore, the number of risks affecting the i-th risk will be small. On the contrary, if the value of (ri + cj) of the i-th risk is very large, this is the main risk that needs to be addressed.
4.1 Expert characteristics
This study recruited 12 experts with direct experience in forest management, forestry, environment, and disaster prevention in Quang Ngai to ensure the reliability and practicality of DEMATEL data. The experts were selected based on their professional qualifications, practical experience, and role in local forest management. The experts all had university degrees or higher, of which five had postgraduate degrees in forestry, forest resource management, environmental science, or disaster management. They had 10–25 years of experience in forest management and research, participating in biodiversity conservation projects, natural forest restoration, environmental impact assessment, and disaster risk management.
The expert group included forestry officials and officials of the Protection and Special-Use Forest Management Board. They directly identified forest degradation factors, assessed the level of direct influence between factors, and ensured that the DEMATEL survey closely reflected the local situation, including extreme rainfall events, upstream floods, landslides, forest fires, and human pressure on forest exploitation. The participation of these 12 experts provided reliable, realistic, and multidimensional data, forming a solid basis for DEMATEL analysis, identifying root factors, and proposing sustainable forest management solutions in Quang Ngai.
The selection of 12 experts is consistent with common practice in DEMATEL-based studies, where expert panels typically range from 8 to 20 participants to balance diversity of expertise and cognitive consistency. The expert group in this study includes both academic researchers and practitioners directly involved in forest management in Quang Ngai province, ensuring representativeness across scientific, managerial, and local perspectives. Unlike priority-weighting methods such as AHP, DEMATEL focuses on aggregating perceived influence relationships rather than pairwise priority judgments; therefore, it does not require consistency ratio testing. The aggregation of individual expert matrices through averaging is a widely accepted approach in DEMATEL applications to reduce individual bias and reflect collective expert knowledge in causal analysis.
4.2 DEMATEL results and causal analysis
4.2.1 Average direct relationship matrix
The levels of mutual influence between the 12 risks were assessed by 12 experts on a scale of 0–4, where 0 = almost no influence and 4 = very strong influence. To construct the direct influence matrix for the DEMATEL analysis, the author calculated the average of the assessments from all experts, forming an average direct influence matrix, taking the nearest integer. The use of the average was intended to reflect the general trend of the group of experts while minimizing individual differences in assessment. The results of the average direct relationship matrix A are shown in Table 2. Averaging expert judgments is a common practice in DEMATEL-based studies, as it captures collective expert knowledge while reducing individual subjectivity and extreme bias.
Table 2. Average direct association matrix A
|
|
R1 |
R2 |
R3 |
R4 |
R5 |
R6 |
R7 |
R8 |
R9 |
R10 |
R11 |
R12 |
|
R1 |
0 |
3 |
2 |
2 |
1 |
1 |
2 |
1 |
2 |
2 |
3 |
2 |
|
R2 |
2 |
0 |
3 |
2 |
2 |
1 |
2 |
1 |
1 |
1 |
2 |
1 |
|
R3 |
2 |
2 |
0 |
2 |
2 |
1 |
1 |
1 |
2 |
1 |
3 |
2 |
|
R4 |
1 |
1 |
1 |
0 |
2 |
2 |
1 |
1 |
1 |
1 |
2 |
1 |
|
R5 |
2 |
1 |
2 |
2 |
0 |
2 |
1 |
1 |
1 |
1 |
2 |
1 |
|
R6 |
1 |
1 |
1 |
1 |
1 |
0 |
2 |
2 |
1 |
1 |
2 |
1 |
|
R7 |
1 |
1 |
1 |
1 |
1 |
1 |
0 |
2 |
1 |
1 |
1 |
1 |
|
R8 |
2 |
1 |
2 |
1 |
2 |
2 |
1 |
0 |
4 |
1 |
3 |
1 |
|
R9 |
2 |
1 |
2 |
1 |
1 |
1 |
1 |
2 |
0 |
2 |
2 |
1 |
|
R10 |
2 |
1 |
1 |
1 |
1 |
0 |
0 |
2 |
2 |
0 |
3 |
2 |
|
R11 |
3 |
2 |
3 |
2 |
2 |
2 |
1 |
3 |
4 |
2 |
0 |
2 |
|
R12 |
2 |
1 |
2 |
1 |
1 |
0 |
0 |
2 |
2 |
3 |
2 |
0 |
4.2.2 Normalized direct correlation matrix D
The normalized relational matrix D is shown in Table 3. Normalization ensures that all influence values fall within a comparable scale, thereby allowing the subsequent calculation of the total-relation matrix without dominance by any single factor.
Table 3. Normalized relational matrix D
|
|
R1 |
R2 |
R3 |
R4 |
R5 |
R6 |
R7 |
R8 |
R9 |
R10 |
R11 |
R12 |
|
R1 |
0 |
0.1154 |
0.0769 |
0.0769 |
0.0385 |
0.0385 |
0.0769 |
0.0385 |
0.0769 |
0.0769 |
0.1154 |
0.0769 |
|
R2 |
0.0769 |
0 |
0.1154 |
0.0769 |
0.0769 |
0.0385 |
0.0769 |
0.0385 |
0.0385 |
0.0385 |
0.0769 |
0.0385 |
|
R3 |
0.0769 |
0.0769 |
0 |
0.0769 |
0.0769 |
0.0385 |
0.0385 |
0.0385 |
0.0769 |
0.0385 |
0.1154 |
0.0769 |
|
R4 |
0.0385 |
0.0385 |
0.0385 |
0 |
0.0769 |
0.0769 |
0.0385 |
0.0385 |
0.0385 |
0.0385 |
0.0769 |
0.0385 |
|
R5 |
0.0769 |
0.0385 |
0.0769 |
0.0769 |
0 |
0.0769 |
0.0385 |
0.0385 |
0.0385 |
0.0385 |
0.0769 |
0.0385 |
|
R6 |
0.0385 |
0.0385 |
0.0385 |
0.0385 |
0.0385 |
0 |
0.0769 |
0.0769 |
0.0385 |
0.0385 |
0.0769 |
0.0385 |
|
R7 |
0.0385 |
0.0385 |
0.0385 |
0.0385 |
0.0385 |
0.0385 |
0 |
0.0769 |
0.0385 |
0.0385 |
0.0385 |
0.0385 |
|
R8 |
0.0769 |
0.0385 |
0.0769 |
0.0385 |
0.0769 |
0.0769 |
0.0385 |
0 |
0.1538 |
0.0385 |
0.1154 |
0.0385 |
|
R9 |
0.0769 |
0.0385 |
0.0769 |
0.0385 |
0.0385 |
0.0385 |
0.0385 |
0.0769 |
0 |
0.0769 |
0.0769 |
0.0385 |
|
R10 |
0.0769 |
0.0385 |
0.0385 |
0.0385 |
0.0385 |
0.0000 |
0.0000 |
0.0769 |
0.0769 |
0 |
0.1154 |
0.0769 |
|
R11 |
0.1154 |
0.0769 |
0.1154 |
0.0769 |
0.0769 |
0.0769 |
0.0385 |
0.1154 |
0.1538 |
0.0769 |
0 |
0.0769 |
|
R12 |
0.0769 |
0.0385 |
0.0769 |
0.0385 |
0.0385 |
0 |
0 |
0.0769 |
0.0769 |
0.1154 |
0.0769 |
0 |
4.2.3 General influence matrix T
The general influence matrix T is shown in Table 4.
Table 4. General influence matrix T
|
|
R1 |
R2 |
R3 |
R4 |
R5 |
R6 |
R7 |
R8 |
R9 |
R10 |
R11 |
R12 |
|
R1 |
0.1731 |
0.2384 |
0.2455 |
0.2102 |
0.1751 |
0.1484 |
0.1733 |
0.1905 |
0.2544 |
0.2103 |
0.3112 |
0.2027 |
|
R2 |
0.2184 |
0.1155 |
0.2528 |
0.1928 |
0.1909 |
0.1361 |
0.1609 |
0.1656 |
0.1925 |
0.1533 |
0.2495 |
0.1501 |
|
R3 |
0.2316 |
0.1945 |
0.1612 |
0.2005 |
0.1985 |
0.1424 |
0.1312 |
0.1776 |
0.2408 |
0.1661 |
0.2953 |
0.1921 |
|
R4 |
0.1528 |
0.1251 |
0.1527 |
0.0931 |
0.1641 |
0.1505 |
0.1068 |
0.1408 |
0.1600 |
0.1289 |
0.2103 |
0.1242 |
|
R5 |
0.2030 |
0.1406 |
0.2029 |
0.1792 |
0.1060 |
0.1609 |
0.1177 |
0.1539 |
0.1777 |
0.1424 |
0.2319 |
0.1383 |
|
R6 |
0.1535 |
0.1256 |
0.1534 |
0.1293 |
0.1302 |
0.0782 |
0.1415 |
0.1770 |
0.1646 |
0.1295 |
0.2110 |
0.1247 |
|
R7 |
0.1368 |
0.1128 |
0.1367 |
0.1162 |
0.1170 |
0.1037 |
0.0593 |
0.1604 |
0.1457 |
0.1163 |
0.1586 |
0.1120 |
|
R8 |
0.2396 |
0.1656 |
0.2394 |
0.1704 |
0.2029 |
0.1830 |
0.1371 |
0.1494 |
0.3195 |
0.1718 |
0.3056 |
0.1631 |
|
R9 |
0.2082 |
0.1426 |
0.2069 |
0.1456 |
0.1450 |
0.1255 |
0.1165 |
0.1918 |
0.1487 |
0.1803 |
0.2375 |
0.1416 |
|
R10 |
0.2085 |
0.1407 |
0.1738 |
0.1434 |
0.1428 |
0.0889 |
0.0775 |
0.1906 |
0.2215 |
0.1106 |
0.2673 |
0.1741 |
|
R11 |
0.3154 |
0.2332 |
0.3152 |
0.2389 |
0.2380 |
0.2091 |
0.1622 |
0.2893 |
0.3641 |
0.2404 |
0.2565 |
0.2304 |
|
R12 |
0.2129 |
0.1443 |
0.2102 |
0.1472 |
0.1465 |
0.0896 |
0.0792 |
0.1934 |
0.2250 |
0.2190 |
0.2425 |
0.1075 |
4.2.4 Results on the importance, impact, and causality of risks
The threshold value results were determined to be α = 0.1763. The results of the importance, impact, and causality of the risks are shown in Table 5.
Table 5. Results on the importance, impact, and causality of risks
|
|
r |
c |
r + c |
r − c |
Cause or Effect |
|
R1 |
2.5331 |
2.4539 |
4.9870 |
0.0793 |
Cause |
|
R2 |
2.1784 |
1.8787 |
4.0571 |
0.2997 |
Cause |
|
R3 |
2.3317 |
2.4506 |
4.7824 |
-0.1189 |
Effect |
|
R4 |
1.7094 |
1.9669 |
3.6763 |
-0.2575 |
Effect |
|
R5 |
1.9546 |
1.9571 |
3.9117 |
-0.0025 |
Effect |
|
R6 |
1.7187 |
1.6163 |
3.3350 |
0.1023 |
Cause |
|
R7 |
1.4754 |
1.4633 |
2.9387 |
0.0122 |
Cause |
|
R8 |
2.4475 |
2.1803 |
4.6278 |
0.2672 |
Cause |
|
R9 |
1.9901 |
2.6146 |
4.6048 |
-0.6245 |
Effect |
|
R10 |
1.9396 |
1.9687 |
3.9083 |
-0.0292 |
Effect |
|
R11 |
3.0927 |
2.9774 |
6.0701 |
0.1152 |
Cause |
|
R12 |
2.0174 |
1.8607 |
3.8781 |
0.1566 |
Cause |
The DEMATEL analysis results show that the risks of natural forest degradation in Quang Ngai province can be divided into two main groups: cause risks and effect risks. Figure 1 illustrates the causal–importance distribution of the identified risks based on the DEMATEL results, where prominence (r + c) represents overall importance and (r − c) distinguishes cause-and-effect factors.

Figure 1. Causal–importance diagram of DEMATEL results (r + c vs. r − c)
This classification helps clarify the key factors that need to be prioritized in forest management and policy making. The cause risk group includes R1 (pressure on local people’s livelihoods), R2 (short-term economic value from logging and forest agricultural products), R6 (lack of coordination between management agencies), R7 (climate change), R8 (natural and human-caused forest fires), R11 (swidden farming practices, slash-and-burn farming), and R12 (lack of environmental education and communication). These risks have positive (r − c) values, indicating that they strongly impact other risks in the forest ecosystem and are the source of many problems. Among them, R11 has the highest positive (r − c) value, indicating that shifting cultivation and forest burning practices are the core factors leading to the risk of forest degradation. At the same time, risks related to livelihoods and short-term economic values (R1, R2) also play an important role, reflecting the economic pressure of local communities on forest resources. The identification of livelihood pressure (R1), economic exploitation (R2), and farming practices (R11) as key causal risks highlights the dominant role of socio-economic drivers in natural forest degradation in Quang Ngai province. These factors act as root causes that trigger or intensify other environmental and institutional risks, rather than being consequences of forest degradation itself. This finding is consistent with previous studies emphasizing that unsustainable livelihood strategies and economic dependency on forest resources are primary drivers of deforestation in developing regions. In the context of Quang Ngai, limited alternative income sources and traditional slash-and-burn farming practices further reinforce these causal relationships. Management and environmental risks (R6, R7, R8, R12) create a spillover effect, affecting many other risks, both social and environmental.
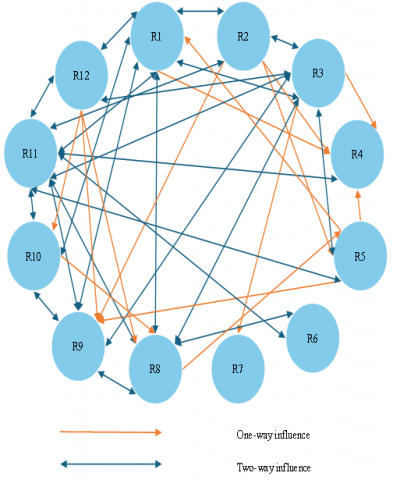
In contrast, the group of consequence risks includes R3 (lack of sustainable alternative livelihoods), R4 (land and forest allocation policies are limited in effectiveness), R5 (weak monitoring and law enforcement), R9 (land cover reduction and erosion), and R10 (low community awareness of forest protection). These risks have negative (r − c) values, indicating that they are affected by the cause risks. In particular, R9 has the strongest negative (r − c) value, reflecting that forest cover loss and soil erosion are clear consequences of unsustainable forest exploitation and traditional farming practices. R9 (consequence risks such as forest cover loss and soil erosion) are positioned as effect factors, indicating that they are largely outcomes of upstream socio-economic and managerial pressures rather than independent drivers. This causal positioning suggests that policies focusing solely on reforestation or erosion control may yield limited long-term effectiveness if the underlying livelihood and economic pressures are not addressed. Similar cause-and-effect patterns have been reported in forest risk assessments in other Southeast Asian contexts, reinforcing the systemic nature of forest degradation processes. It should be noted that risks with r − c values close to zero, such as R5 (weak monitoring and law enforcement) and R7 (climate change), may exhibit both causal and effect characteristics. These borderline cases suggest reciprocal interactions within the system rather than strictly unidirectional influence. However, their proximity to zero does not alter the overall causal structure identified by the DEMATEL analysis, as the main causal drivers and consequence risks remain clearly differentiated. To further clarify the interrelationships among the risks, Figure 2 presents the DEMATEL causal network diagram, highlighting the dominant influence pathways within the system.
Figure 2. Causal relationships between natural forest degradation risks
The application of a threshold value of α = 0.1763 helps to eliminate weakly influential relationships, thereby highlighting the key causal effects between risks. This indicates that management strategies should focus on reducing livelihood pressure, changing farming practices, improving the effectiveness of coordinated forestry management, and improving public awareness of forest protection. These measures will directly impact the resulting risks, contributing to limiting forest cover loss and soil erosion. Figure 2 shows a diagram of the causal relationship between natural forest degradation risks in Quang Ngai.
In addition, the study results also emphasize the role of environmental factors such as climate change (R7) and forest fire risk (R8). Although they do not directly result from social risks, their spillover effects increase the risk of forest degradation, creating a causal spiral between economic, social, and environmental factors. Therefore, sustainable forest management measures need to integrate strategies for forest fire prevention and climate change adaptation.
4.3 Sensitivity analysis
To examine the robustness of the DEMATEL results, a sensitivity analysis was conducted by varying the elements of the initial direct-relation matrix by ±10%, following common practice in DEMATEL-based studies. The total-relation matrix and the corresponding r, c, and (r − c) values were recalculated for each scenario.
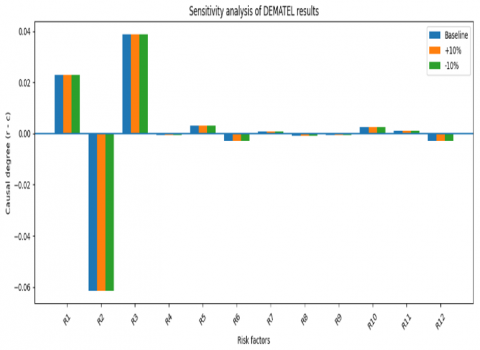
The results show that the classification of risk factors into cause-and-effect groups remains unchanged across the tested scenarios. Key causal risks such as livelihood pressure (R1), economic exploitation (R2), and farming practices (R11) consistently exhibit positive (r − c) values, while consequence risks, including forest cover loss and soil erosion (R9), maintain negative (r − c) values. Although minor variations in the magnitude of influence values were observed, the overall causal structure and priority ordering of major risks remained stable. Figure 3 further illustrates that the causal degree (r − c) of all twelve risks remains consistent under baseline, +10%, and -10% scenarios, confirming the robustness of the DEMATEL results.
Figure 3. Sensitivity analysis of DEMATEL results for twelve risks
These findings indicate that the DEMATEL results are robust to moderate variations in expert judgments, thereby reinforcing the reliability of the identified causal relationships and the validity of the derived policy implications.
Notably, risks with borderline r − c values remain stable in their relative positions across the ±10% sensitivity scenarios, indicating that their dual cause-and-effect characteristics do not compromise the overall classification.
This robustness further strengthens the reliability of the DEMATEL-based causal structure and confirms that the identified priority risks and policy implications are not sensitive to moderate uncertainty in expert judgments.
5.1 Conclusion
This study applied the DEMATEL method to analyze the causal relationship between natural forest degradation risks in Quang Ngai province, Vietnam. The results showed that the risks can be divided into two main groups: cause and effect. The causal risks include R1 (local people's livelihood pressure, r − c = 0.0793), R2 (short-term economic value from logging and forest agricultural products, r − c = 0.2997), R6 (lack of coordination between management agencies, r − c = 0.1023), R7 (climate change, r − c = 0.0122), R8 (natural and human-caused forest fires, r − c = 0.2672), R11 (Swidden farming practices, forest burning, r − c = 0.1152), and R12 (Lack of environmental education and communication, r − c = 0.1566). This group has a positive (r − c) value, reflecting the important role of these risks in spillover effects to other risks. Among them, R2 and R8 have the highest (r − c) values, indicating that short-term economic pressure and forest fire risk are the key drivers of forest degradation, while R11 emphasizes the importance of traditional farming practices. In contrast, the consequence risks include R3 (lack of sustainable alternative livelihoods, r − c = −0.1189), R4 (land and forest allocation policies are limited in effectiveness, r − c = -0.2575), R5 (weak monitoring and law enforcement, r − c = -0.0025), R9 (land cover reduction and erosion, r − c = -0.6245), and R10 (low community awareness of forest protection, r − c = -0.0292). This group has negative (r − c) values, indicating that they are directly affected by the cause risks. R9, with the strongest negative (r − c) value, shows that forest cover loss and soil erosion are prominent consequences of a combination of many social, economic, and environmental risks. Beyond reporting numerical cause-and-effect relationships, this study contributes theoretically by highlighting the systemic and interactive nature of natural forest degradation risks. The DEMATEL results empirically demonstrate that socio-economic pressures and traditional land-use practices act as upstream driving forces, whereas institutional weaknesses and environmental degradation emerge primarily as downstream consequences within the same risk system. This causal structure is directly supported by the DEMATEL analysis, while the associated policy implications reflect the specific socio-economic and environmental context of Quang Ngai province. The study provides a clear quantitative basis for policymakers and forest resource managers in Quang Ngai to prioritize key factors, thereby contributing to reducing the risk of forest degradation and sustainably conserving natural forest ecosystems.
5.2 Policy implications
Based on the DEMATEL analysis, the main risk drivers of forest degradation in Quang Ngai include livelihood pressure on local people (R1), short-term economic value from forest exploitation (R2), shifting cultivation practices, forest burning (R11), lack of coordinated forestry management (R6), climate change (R7), risk of forest fires (R8), and lack of environmental education/communication (R12). These factors have a strong spillover effect on consequential risks such as forest cover loss, soil erosion, low community awareness, and limitations in land and forest allocation policies. Based on this, some specific policy recommendations are as follows:
1) Reduce livelihood pressure and short-term forest exploitation
Develop and implement sustainable livelihood programs, such as economic forest plantation combined with sustainable agriculture, develop aquaculture projects, and process agricultural and forestry products to increase community income. Provide technical and financial support to people to reduce dependence on short-term logging and forest agricultural products, thereby limiting pressure on natural forests.
2) Change traditional farming practices
Organize training courses, education, and guidance on sustainable farming practices, and limit slash-and-burn farming. Combine with alternative livelihood support measures to give people reasonable alternatives, reducing the risk of deforestation.
3) Strengthen coordination in the management and enforcement of forestry laws
Improve coordination between forest management agencies, including local authorities, rangers, and community organizations. Strengthen monitoring and handling of violations, and develop a mechanism for sharing information and data on forest fire risks, illegal logging, and forest cover loss.
4) Raise public awareness and environmental education
Implement communication campaigns on forest protection, climate change, forest fire prevention and fighting, appropriate to local cultural conditions and characteristics. Encourage community participation in forest protection, from monitoring and management to implementing sustainable livelihood projects.
5) Responding to climate change and forest fires
Develop a forest fire prevention and control plan, combining forecasting and early warning technology and risk reduction strategies. Develop forest management solutions adapted to climate change, including planting protective forests and maintaining and restoring natural forest ecosystems.
5.3 Limitations
This study has several limitations that should be noted. First, the data collected is mainly based on expert opinion and may be influenced by personal views and does not cover the entire community in Quang Ngai. Second, the study focused on natural forest degradation risks at the provincial level, so the results may have limited application to other areas or other forest types.
The author would like to sincerely thank the experts who assisted the author in conducting this research.
[1] Kumar, M., Phukon, S.N., Singh, H. (2021). The role of communities in sustainable land and forest management. In Forest Resources Resilience and Conflicts, pp. 305-318. https://doi.org/10.1016/B978-0-12-822931-6.00024-1
[2] Aju, P.C., Iwuchukwu, J.J., Ibe, C.C. (2015). Our forests, our environment, our sustainable livelihoods. European Journal of Academic Essays, 2(4): 6-19.
[3] Tran, D.X., Tran, T.V., Pearson, D., Myint, S.W., Lowry, J., Nguyen, T.T. (2022). Spatiotemporal analysis of forest cover change and associated environmental challenges: A case study in the Central Highlands of Vietnam. Geocarto International, 37(25): 9277-9297. https://doi.org/10.1080/10106049.2021.2017013
[4] Tuyen, V.V. (2024). Prioritization of coastal environmental risks under climate change in Quang Ngai, Vietnam: An integrated analytic network process–risk score approach. Acadlore Transactions on Geosciences, 3(4): 237-251. https://doi.org/10.56578/atg030405
[5] Luyen, N.T., Son, N.T. (2022). The importance of socio-economic development to sustainable natural resources management in rural areas: A case study of sustainable livelihoods and forest management in Xuan Nha Nature Reserve in Northwestern Vietnam. Vietnam Journal of Agricultural Sciences, 5(1): 1345-1358. https://doi.org/10.31817/vjas.2022.5.1.04
[6] Do, T.H., Vu, T.P., Catacutan, D., Nguyen, V.T. (2021). Governing landscapes for ecosystem services: A participatory land-use scenario development in the northwest montane region of Vietnam. Environmental Management, 68(5): 665-682. https://doi.org/10.1007/s00267-020-01378-2
[7] Li, J.Y., Xiao, Y.N. (2024). Analysis of influencing factors on review efficiency of multidisciplinary scientific research projects using DEMATEL with a 5-point scale. PloS One, 19(12): e0315349. https://doi.org/10.1371/journal.pone.0315349
[8] Sharma, S.K., Routroy, S., Singh, R.K., Nag, U. (2024). Analysis of supply chain vulnerability factors in manufacturing enterprises: A fuzzy DEMATEL approach. International Journal of Logistics Research and Applications, 27(5): 814-841. https://doi.org/10.1080/13675567.2022.2083590
[9] Kumar, R., Kumar, A., Saikia, P. (2022). Deforestation and forests degradation impacts on the environment. In Environmental Degradation: Challenges and Strategies for Mitigation, pp. 19-46. https://doi.org/10.1007/978-3-030-95542-7_2
[10] Robinne, F.N., Secretariat, F. (2021). Impacts of disasters on forests, in particular forest fires. UNFFS Background paper.
[11] López-Carr, D. (2021). A review of small farmer land use and deforestation in tropical forest frontiers: Implications for conservation and sustainable livelihoods. Land, 10(11): 1113. https://doi.org/10.3390/land10111113
[12] Kouassi, J.L., Gyau, A., Diby, L., Bene, Y., Kouamé, C. (2021). Assessing land use and land cover change and farmers’ perceptions of deforestation and land degradation in South-West Côte d’Ivoire, West Africa. Land, 10(4): 429. https://doi.org/10.3390/land10040429
[13] Tran Quoc, C., Tran Nam, T., Kull, C.A., Nguyen Van, L., et al. (2023). Factors associated with deforestation probability in Central Vietnam: A case study in Nam Dong and A Luoi districts. Journal of Forest Research, 28(3): 159-167. https://doi.org/10.1080/13416979.2023.2182259
[14] Huy, B. (2023). Shifting cultivation and rehabilitation of natural forest ecosystems: In the central highlands of Vietnam. In Farmer Innovations and Best Practices by Shifting Cultivators in Asia-Pacific, pp. 360-378. https://doi.org/10.1079/9781800620117.0018
[15] Rafiei-Sardooi, E., Azareh, A., Choubin, B., Mosavi, A.H., Clague, J.J. (2021). Evaluating urban flood risk using hybrid method of TOPSIS and machine learning. International Journal of Disaster Risk Reduction, 66: 102614. https://doi.org/10.1016/j.ijdrr.2021.102614
[16] Tuyen, V.V. (2024). Prioritization of risk factors in sea-island tourism: A study in Quang Ngai Province, Vietnam. TourismSpectrum: Diversity & Dynamics, 1(3): 141-151. https://doi.org/10.56578/tsdd010302
[17] Van, K.T., Nguyen, A.T., Tuyen, V.V. (2025). Prioritizing risks in production activities: A study of salt processing enterprises in the central region of Vietnam. International Journal of Safety and Security Engineering, 15(2): 275-285. https://doi.org/10.18280/ijsse.150208
[18] Nguyen, A.T., Tuyen, V.V., Than, V.H., Tran, V.K. (2025). Applying the analytic hierarchy process to prioritize risks of the food supply chain in Vietnam. International Journal of the Analytic Hierarchy Process, 17(1). https://doi.org/10.13033/ijahp.v17i1.1199
[19] Trần, V.K., Tuyển, V.V., Nguyễn, A.T., Võ, T.D.H. (2025). Applying hierarchical analysis to prioritize risks in rice distribution operations: A case study in Quang Ngai City [in Vietnamese]. Tạp chí Nghiên cứu Tài chính – Marketing, 16(2): 89. https://doi.org/10.52932/jfm.v16i2.524
[20] Cheng, L.Y., Wang, Y.H., Peng, Y.C. (2021). Research on risk assessment of high-speed railway operation based on network ANP. Smart and Resilient Transportation, 3(1): 37-51. https://doi.org/10.1108/SRT-10-2020-0024
[21] Zhang, W., Lai, T., Li, Y. (2022). Risk assessment of water supply network operation based on ANP-fuzzy comprehensive evaluation method. Journal of pipeline Systems Engineering and Practice, 13(1): 04021068. https://doi.org/10.1061/(ASCE)PS.1949-1204.0000602
[22] AbdolkhaniNezhad, T., Monavari, S.M., Khorasani, N., Robati, M., Farsad, F. (2022). Comparative analytical study of the results of environmental risk assessment of urban landfills approach: Bowtie, network analysis techniques (ANP), TOPSIS (case study: Gilan Province). Environmental Monitoring and Assessment, 194(12): 854. https://doi.org/10.1007/s10661-022-10513-x
[23] Liu, P.D., Wu, Y.F., Li, Y., Wu, X.M. (2024). An improved FMEA method based on the expert trust network for maritime transportation risk management. Expert Systems with Applications, 238: 121705. https://doi.org/10.1016/j.eswa.2023.121705
[24] Zhu, Y.X., Tian, A.Q., Lu, Z.Y., Zhan, S.J., Wang, X.Y. (2022). Research on operation and maintenance management risk assessment of power communication network based on DEMATEL. International Journal of Industrial and Systems Engineering, 40(3): 325-342. https://doi.org/10.1504/IJISE.2022.122247
[25] Dehghani, H., Hormozi, A., Nikpour, M. (2022). Systematic risks assessment of precast concrete canal in irrigation projects using DEMATEL method. International Journal of System Assurance Engineering and Management, 13(1): 123-130. https://doi.org/10.1007/s13198-021-01140-9
[26] Benabdallah, C., El-Amraoui, A., Delmotte, F., Frikha, A. (2022). Evaluation on risks of sustainable supply chain based on integrated rough DEMATEL in Tunisian dairy industry. International Journal of Supply and Operations Management, 9(3): 338-359. https://doi.org/10.22034/ijsom.2021.109143.2205
[27] Amirghodsi, S., Mohammadi, M., Maleki, A., Naeini, A.B. (2021). How does psychological empowerment affect knowledge management improvement in organizations? A study of cause-and-effect relationship using the fuzzy DEMATEL method. IEEE Transactions on Engineering Management, 71: 426-439. https://doi.org/10.1109/TEM.2021.3118028
[28] Von Soest, C. (2023). Why do we speak to experts? Reviving the strength of the expert interview method. Perspectives on Politics, 21(1): 277-287. https://doi.org/10.1017/S1537592722001116
[29] Nimawat, D., Gidwani, B.D. (2021). Identification of cause and effect relationships among barriers of Industry 4.0 using decision-making trial and evaluation laboratory method. Benchmarking: An International Journal, 28(8): 2407-2431. https://doi.org/10.1108/BIJ-08-2020-0429
[30] Pribićević, I., Delibašić, B. (2021). Critical sustainability indicators identification and cause–effect relationships analysis for sustainable organization strategy based on fuzzy DEMATEL. Environment, Development and Sustainability, 23(12): 17263-17304. https://doi.org/10.1007/s10668-021-01360-w
[31] Si, S.L., You, X.Y., Liu, H.C., Zhang, P. (2018). DEMATEL technique: A systematic review of the state-of-the-art literature on methodologies and applications. Mathematical Problems in Engineering, 2018(1): 3696457. https://doi.org/10.1155/2018/3696457