Iyobosa T. Asowata*![]() | Adesina Luqman Adisa
| Adesina Luqman Adisa![]() | Sunday Olabisi Daramola
| Sunday Olabisi Daramola![]()
© 2025 The authors. This article is published by IIETA and is licensed under the CC BY 4.0 license (http://creativecommons.org/licenses/by/4.0/).
OPEN ACCESS
This study aims to determine the mineralogical and chemical characteristics of the clay in the Ugieghudu area, with potential applications as a feedstock in the industry. Ten representative clay samples were collected at various horizons in the study area. The samples were sieved (> 53 μm) and analysed using X-ray diffraction (XRD), scanning electron microscopy (SEM), X-ray fluorescence (XRF), and inductively coupled plasma-mass spectroscopy (ICP-MS), respectively. From the results, the cation exchange capacity (CEC) showed a low to moderate amount (28.01–62.25 meq/100 g). XRD result showed that kaolin (33.9%–73.0%) was the dominant mineral, followed by quartz (23.0%–63.0%). SEM results showed the mean amount of SiO2, Al2O3, Fe2O3, TiO2, K2O, and MnO, in %, of 53.75, 29.17, 11.53, 4.44, 0.63, and 0.32, respectively, suggesting a correlation with the XRD results. XRF results of the clay in % showed SiO2 (55.72), TiO2 (4.55), Al2O3 (27.14), and Fe2O3 (9.03), among other oxides. Trace elements such as Ba in ppm (188.7), among others, occurred in varying amounts in the clay, revealing the effect of weathering and selective leaching. Comparison of the Ugieghudu clay with other submissions suggests that the clay is suitable as feedstock for tiles, fertilizer, and ceramic production, among other uses.
Ugieghudu, kaolinite clay, chemical index of alteration, XRD, feedstocks, ceramics
Clay minerals are layer silicates that are typically formed as products of chemical weathering of other silicate minerals at the Earth's surface [1]. Clay can be grouped generally into three groups: these include kaolin, smectite, and illite groups [1]. Clays are useful in various industries, including processing, agriculture, engineering, construction, environmental remediation, and many other miscellaneous applications [2, 3]. They can occur in a wide range of environments: as residual products in soil profiles and accumulated materials in some basins or catchment areas [4, 5]. Clay numerals are typically formed over long periods of time by the gradual chemical weathering of rocks, usually silicate-bearing, with low concentrations of carbonic acid and other diluted solvents, which are usually acidic, migrate through the weathering of rock after leading through upper weathered layers [5]. In addition, in the weathering process, hydrothermal activities form some clay minerals, and clay deposits may be formed in places as residual deposits. The relative abundance of clay in both sedimentary and crystalline environments in a typical tropical environment is not disputable; however, understanding their specific mineral and geochemical characteristics is, without doubt, very important. This will help identify the specific needs that such clay addresses. Several studies have described clay to be one of the oldest materials used in the construction industry in the production of bricks [6], though there are other important consumables, such as steel, cement, rebar, and wood; however, clay plays a very critical role worldwide in building [7, 8]. This is because it has relatively low production and maintenance costs, long durability, a simple technique, and reliability, among other advantages [9]. The specific usefulness can only be ascertained through a detailed understanding of the mineral and chemical composition of the clay under study. On a global scale, the mineral composition of clay has been determined by Abdelmalek et al. [10] in the Jijel basin of Algeria. In their work, X-ray diffraction (XRD) was used. The results showed that the clay is rich in quartz and calcite as dominant minerals, while plagioclase feldspar and chlorite were also present in relatively lower quantities. The work was also complemented with oxide determination, using inductively coupled plasma-mass spectrometry. The results showed that the average concentrations were SiO2 (52%), Al2O3 (16%), and CaO (8%). Other oxides included Fe2O3 (5%), which was relatively less abundant. The data from the study suggested that the clay can be used for tile and masonry brick production. Similar works have been carried out by Alcântara et al. [11] in Brazil, Tunisia, and Cameroon by Bennour et al. [12] and Bomeni et al. [13], respectively. These works used the mineral and chemical composition of pre-determined clay to identify the specific industrial applications of clay in their study location. In Nigeria, several studies have also been conducted to determine the mineralogical and chemical composition of clay, indicating its potential industrial applications. The works of Bomeni et al. [13] in parts of southeastern Nigeria, using the XRD method to ascertain the suitability of the clay deposits for industrial uses. Results of the analyses indicated that kaolinite is the dominant clay mineral. There were traces of bentonite and dickite in the result of XRD, while non-clay minerals were also observed. These include quartz and hematite. The Chemical analysis of the clays, using Energy Dispersive X-Ray Fluorescence (ED-XRF), revealed relatively high amount of SiO2, Al2O3, Fe2O3 and TiO2 with values averaging from 45.4%, 20.6%, 15.42% and 4.4%, for the respective oxides, while the compositions of CaO, MgO, Na2O, and MnO in the analysed samples were found to be relatively lower with values ranging from 0.19 to 0.29%, 0.13 to 0.19%, 0.11 to 0.70% and 0.01 to 0.03%, respectively. The data obtained suggested that the clay in the study area was suitable for engineering purposes, specifically for brick and tile making. This was also supported by other research [14-16]. Recently, Aromolaran and Adebayo [17] worked on the mineralogical, chemical, and physical characteristics of clay bodies in a sedimentary basin of Bida in Northern Nigeria. around Share to know their industrial relevance, use the XRD and inductively coupled plasma-emission spectrometry (ICP-ES) methods. From the result, kaolinite (88.17%) was the principal clay mineral, while quartz, muscovite, and paragonite were found to occur in minor amounts. The geochemical composition reveals moderate SiO2 (48.58 wt.%) but high Al2O3 (34.34 wt.%) contents, while MgO, CaO, K2O, Na2O, P2O5, Fe2O3, TiO2, MnO, and Cr2O3 contents were generally low in all the samples. It was deduced from the results that the clay bodies in the area can be utilized as raw materials in various industries, including ceramic, refractory, paper, paint, plastic, rubber, textile, fertilizer, and petrochemical. This also followed the earlier work [18] in the Anambra Basin, from the Oban Massif. In the work, there were relatively high concentrations of major oxides, SiO2 (69.67–90.28%) and Al2O3 (5.10–15.24%), which made up about 76% of the bulk chemical compositions. The high content of SiO2 shows that the source rocks are rich in quartz and silica-rich minerals, confirming the grittiness of the clay. Other oxides that were present occurred in relatively minimal amounts. The occurrences of CaO, NaO, and K2O, which are the major components of feldspar in clay, suggest the clay to be of granitic origin and were of relatively good materials for brick and other refractory materials. This also followed the same pattern as the works [19-23]. Similarly, Meimaroglou and Mouzakis [24] worked on the cation exchange capacity (CEC) as well as organic matter content in selected clay soils in Greece, to know their relative utilization in the construction and building industry. In the investigation, the sodium acetate method was used. It was established that the CEC provides information of stronger correlation with compressive strength and linear shrinkage in the clay. It was found that the relatively higher CEC had low linear shrinkage; hence, an increase in CEC potential increases shrinkage capability, thereby making the clay unsuitable for building materials such as brick making. This CEC outcome was in line with the investigations of previous studies [25-29], among others.
In the foregoing, the understanding of the mineral and chemical compositions of the clay bodies under study will help in classifying the clay for the specific purpose that such clay material will be used for industrially. While undergoing a literature review of research work and submissions on the mineral and chemical composition of clay in Nigeria, information about such studies in this area is rare. No known research work has been carried out in this area of study, Ugieghudu (Figure 1), an area where artisanal mining of the clay is already going on. Hence, there is a need to conduct a scientific study on the clay to determine its mineral and chemical composition, specifically regarding its industrial applicability. Therefore, this research aims to determine the mineral and geochemical characteristics of the clay bodies in the study area and to assess their potential industrial uses. The study area is Ugieghudu (Figure 1), a community situated in Uhunmwode Local Government Area, Edo State, Nigeria. It falls within the western flank of the Anambra Basin, in the Imo Shale formation. The area can be accessed in the eastern part through Ehor, while accessing the study area through the west, south, and north through Igueben, Ugoneki, and Urhohi towns, respectively. It is about nine (9) kilometres away from Ehor town, four (4) kilometres from Urhohi, fifteen (15) kilometres from Igueben, and twenty (20) kilometres from Ugoneki. Other settlements around Ugieghudu include Obazagbon, Uhi, Egbisi, and Ugiegba, among other communities. The area falls under the rainforest area and experiences high rainfall between April and October each year. The dry season is between November and March each year. The area is generally forested, with tree heights ranging between 4 and 8 meters. Similarly, because of the rainforest ecological zone, the area promotes farming activities. Hence, in the area and other adjoining communities, there is the presence of small-scale farmers who farm crops like yams, Cassava, Plantains, Maize, Cocoa, among others.

Figure 1. Study location
The study area falls within the Imo Shale (Figure 2), which is of the western part of the Formation, crossing the River Niger. It is of Palaeocene age, with exposures featuring clayey stone and iron-rich sandstone [30], as shown in Figure 2. The Imo Shale, which overlies the Nsukka Formation, consists of thick, fine-textured, dark/bluish grey clayey shale, with occasional admixture of clayey ironstone and sandstone bands, as presented in exposed outcrops in Figures 3 and 4. The formation becomes sandier and sandstone towards the top, where it consists of alternations of sandstone and shale [31]. Nwajide and Reijers [32] interpreted the Imo Shale to reflect a shallow-marine shelf in which foreshore and shore face sands are occasionally preserved. They further inferred that in the Niger Delta, the subsurface Palaeocene deposits are essentially of (deep) marine origin and are equivalent to the Imo Shale. This Shaley clay is significantly present in the study area of Ugieghudu, Edo State, Nigeria.

Figure 2. Geologic map of the study area [33]

(a)

(b)
Figure 3. Field photograph of two exposed clay bodies at a river channel and an abandoned burrow pit

(a)

(b)
Figure 4. Field photograph of an exposed clay body at another stream channel and an abandoned burrow pit
Clay samples were collected at various locations within the study area, Ugieghudu. Six (6) of the samples were collected at abandoned open mine pits, four (4) at steep river channels and erosion exposures, where we have a spring, suggesting contact between two varying lithologies. A total of 10 representative clay samples were collected during the field sampling exercise. The samples were collected with a stainless-steel digger, hand auger, hoe, and shovel, respectively. The choice of sampling method was based on the relative exposure of the clay bodies at different horizons, as seen in Figures 3 and 4. The samples were stored in polymer bags and taken to the laboratory for further preparation. At the laboratory, the samples were air dried at a room temperature of 28℃ in a relatively closed room for fourteen days. After drying, the samples were sieved using a 63 μm mesh size to remove all organic and sandy materials from the samples. Ten samples were prepared for the cation exchange analysis. In the process, 5 grams each of the clay samples were measured and emptied into a tube with 1 N of ammonium acetate at a pH of 7. This was aimed at separating the exchange sites of the clay particles. The mixtures were shaken vigorously with a mechanical shaker for at least 1 hour. To ensure complete saturation. The samples were allowed to stay for 12 hours for the sediments to be separated from the supernatant. This process was repeated three times to remove the ions from the clay samples properly. Thereafter, the concentration of the displaced ammonium (NH4+) was determined using flame photometry.
Ten samples were selected for XRD analysis. The clay samples were analysed with a Malvern Panalytical Aeris diffractometer with PIXcel detector and fixed slits with Fe-filtered Co-Kα radiation. The phases were identified using X’Pert High Score Plus software. The relative phase amounts (weights %) were estimated using the Rietveld method. This analysis was carried out at the XRD Analytical and Consulting CC, Lynnwood Glenn, South Africa, for the X-ray fluorescence analysis. The sieved samples were prepared in a sample cup, prepared with a propene thin film. The samples were now inserted in the Genius IF XRF tunnel and run with the warm X-Ray Lamp with proper settings of the voltage and emission current values to ensure that the observed deed time is between 35 and 40 kW. After heating, the smoothened samples were allowed to cool; thereafter, the analyses were carried out. For the analysis, the prepared samples were placed in the XRF spectrometer for analysis by obtaining the spectrum accordingly. With the help of the Open XRS-FP Software, the concentration of oxides in the samples was obtained by collecting the intensity of the emitted X-rays based on the emitted energy.
Similarly, the clay samples were further analyzed for Scanning Electron Microscope with energy dispersive X-ray spectroscopy (SEM EDS) to further ascertain the morphology and amounts of elemental oxides of the clay samples. Both the SEM EDS and XRF analyses were carried out at the National Steel Raw Material Institute laboratory, Kaduna. Also, 6 (six) other clay samples were selected for trace elements analysis, using the Inductively Coupled Plasma Mass Spectrometry (ICP-MS) method. Before the elemental analysis, the sieved samples at a mesh size of 53 µm were digested using the modified aqua regia (HNO3 and HCl in a ratio of 1:3) method. The trace element analysis was carried out at the Bureau Veritas Minerals Laboratories (BVML) in Vancouver, Canada. This method was chosen due to its low detection limits. All analyses were carried out in accordance with the established quality control protocols at the various laboratories. This includes the analyses of representative samples with reference materials, standards, and repetitive analyses of duplicate samples to certify the accuracy and correctness of the results obtained.
4.1 Physico-chemical characteristics
The result of the pH, as shown in Table 1, suggests that the clay in the Ugieghudu area ranges from 5.11 to 6.78 in terms of pH. A relatively lower level of pH was recorded in samples ED2 (5.16) and ED8 (5.29). While in samples ED9 and ED6, the pH level was 5.93 and 5.87, respectively. Generally, the clay samples exhibit slight acidity characteristics. The results of the CEC showed a low to moderately low CEC (Table 1). Samples ED7 and ED2 showed the highest amount of CEC of 62.25 meq/100 g and 52.52 meq/100 g, respectively. ED3 and ED10 showed 28.01 and 28.71 in meq/100 g, respectively. The relatively low CEC in the studied clay suggests a low presence of organic matter as well as a relatively low swelling capability.
Table 1. Results for the pH and cation concentration of the studied clay
|
Samples |
pH |
CEC meq/100 g |
|
ED1 |
5.93 |
40.62 |
|
ED2 |
5.16 |
52.52 |
|
ED3 |
5.27 |
28.01 |
|
ED4 |
6.78 |
32.21 |
|
ED5 |
5.11 |
46.92 |
|
ED6 |
5.87 |
39.21 |
|
ED7 |
5.32 |
62.25 |
|
ED8 |
5.29 |
36.80 |
|
ED9 |
5.93 |
46.22 |
|
ED10 |
5.37 |
28.71 |
4.2 Mineralogical characteristics
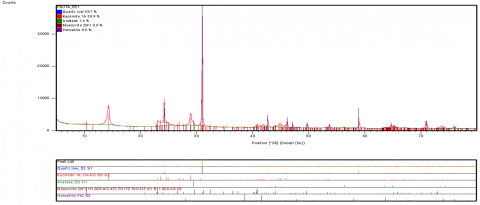
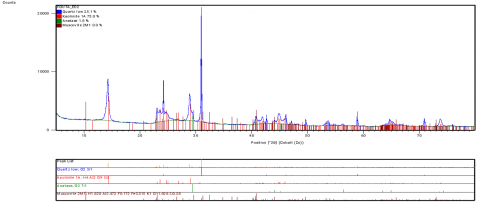
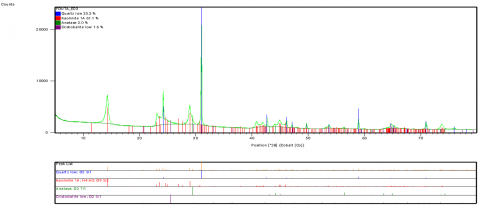
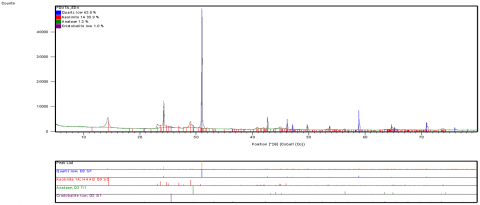
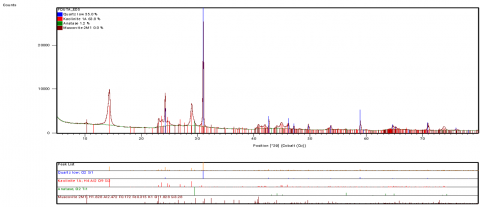
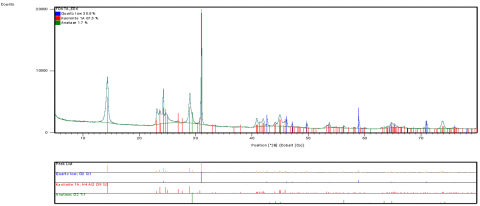
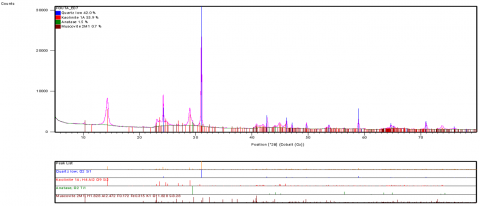
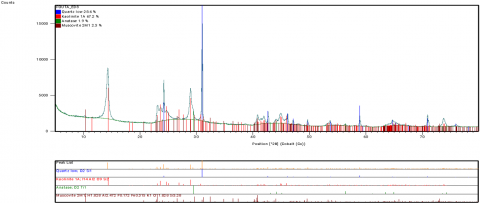
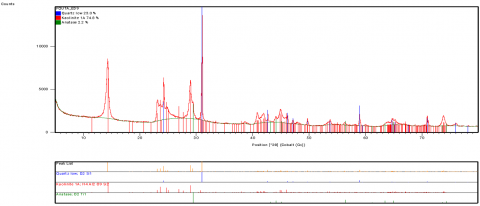
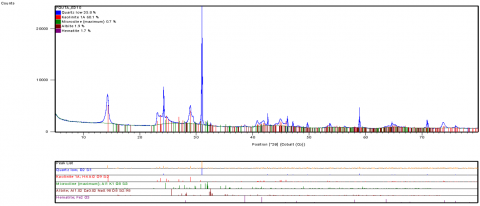
The results of the mineral composition of the clay are presented in Figure 5. This was determined using the X-Ray Diffractogram (XRD) reading pattern. And the summary results of the determined mineral composition, in percentage (%), are presented in Table 2. From the summary results, it was observed that kaolinite was the dominant mineral in all ten (10) samples analysed. Samples with relatively higher concentration of kaolinite were ED9 (74.8) and ED2 (73.0), while relatively low kaolinite mineral were found in samples ED4 (33.9) and ED7 (55.9). Other locations with relatively higher kaolinite were ED6 and ED5, with concentrations of kaolinite in % of 67.6 and 63.8, respectively. Quartz recorded the second-highest amount of mineral concentration in the analysed clay samples. Samples ED4 (63.8) and ED7 (42.0) recorded the highest concentration of quartz. While samples ED9 (23.0) and ED2 (25.1). Other samples with relatively higher concentrations of quartz were ED10 (35.8) and ED3 (35.4), respectively. Other minerals that were present, though in relatively low to no amounts, were anatase, muscovite, hematite, cristobalite, microcline, and plagioclase. The relatively higher concentration of kaolinite essentially makes the clay in the study area kaolinic, with a moderate to low amount of quartz.
Table 2. Summary results for the XRD minerals in the clay
|
|
Quartz |
Kaol |
Anat |
Musc |
Hema |
Cristo |
Microcl |
Plag |
|
ED1 |
38.7 |
59.9 |
1.4 |
0 |
0 |
0 |
0 |
0 |
|
ED2 |
25.1 |
73.0 |
1.8 |
0 |
0 |
0 |
0 |
0 |
|
ED3 |
35.4 |
61.1 |
2.0 |
0 |
0 |
1.6 |
0 |
0 |
|
ED4 |
63.8 |
33.9 |
1.3 |
0 |
0 |
1.0 |
0 |
0 |
|
ED5 |
35.0 |
63.8 |
1.2 |
0 |
0 |
0 |
0 |
0 |
|
ED6 |
30.8 |
67.6 |
1.7 |
0 |
0 |
0 |
0 |
0 |
|
ED7 |
42.0 |
55.9 |
1.5 |
0.7 |
0 |
0 |
0 |
0 |
|
ED8 |
28.6 |
67.2 |
1.9 |
2.3 |
0 |
0 |
0 |
0 |
|
ED9 |
23.0 |
74.8 |
2.2 |
0 |
0 |
0 |
0 |
0 |
|
ED10 |
35.8 |
60.1 |
0 |
0 |
1.7 |
0 |
0.7 |
1.9 |
(a)
(b)
(c)
(d)
(e)
(f)
(g)
(h)
(i)
(j)
Figure 5. XRD of clay samples from the study area
Figure 6 shows the crystal structures of the studied clay and their respective diffractograms, and Table 3 also shows the summary results of the elemental oxides concentration in the various clay samples studied. From the results of the SEMS images, it was observed that the minerals in the different samples exhibit anhedral to subhedral crystal structures, and the minerals were loosely packed. This suggests that the clay in the study area has undergone severe weathering effects, and possibly, its transportation may have involved varying sources of transportation and deposition and sedimentation, which allowed for a distinct mineral assemblage, as seen in all the images taken under 100 μm. The oxide concentration in the scanned images, as shown in Table 3, suggests that there is a significant amount of SiO2 and Al2O3 in all the clay samples studied. From the results, the SiO2 content (%) ranges from 47.13 to 65.83 with a mean value of 47.12%. The highest amount of SiO2 in % was recorded in ED7 (65.83), as well as in sample ED2 (55.31). Other locations also showed an appreciable amount of SiO2 in the Clay samples. Similarly, the Al2O3 concentration also recorded a significant amount, which ranged from 21.67 to 32.46 in percentage (%), with a mean value of 29.17. Other oxides, such as Fe2O3 and TiO2, exhibit relatively low to moderate concentrations in the clay samples, as shown in Table 3.
Table 3. Summary results of selected elements from the scanning electron microscope (%)
|
|
SiO2 |
Al2O3 |
Fe2O3 |
TiO2 |
K2O |
MnO |
SO3 |
CaO |
MgO |
Na2O |
P2O5 |
Cl |
|
ED1 |
47.13 |
31.53 |
14.26 |
5.38 |
0.69 |
0.59 |
0.22 |
0.2 |
0 |
0 |
0 |
0 |
|
ED2 |
55.31 |
30.48 |
9.31 |
4.21 |
0.31 |
0.23 |
0.16 |
0 |
0 |
0 |
0 |
0 |
|
ED3 |
54.05 |
32.46 |
8.32 |
4.15 |
0.9 |
0.12 |
0 |
0 |
0 |
0 |
0 |
0 |
|
ED4 |
55.07 |
29.27 |
10.04 |
3.97 |
0.9 |
0.26 |
0.25 |
0.23 |
0 |
0 |
0 |
0 |
|
ED5 |
57.32 |
28.13 |
8.76 |
3.46 |
1.02 |
0.95 |
0.37 |
0 |
0 |
0 |
0 |
0 |
|
ED6 |
65.83 |
21.67 |
6.09 |
5.65 |
0.61 |
0.15 |
0 |
0 |
0 |
0 |
0 |
0 |
|
ED7 |
51.32 |
29.39 |
14.55 |
4.19 |
0.42 |
0.13 |
0 |
0 |
0 |
0 |
0 |
0 |
|
ED8 |
49.28 |
30.34 |
15.5 |
4.34 |
0.34 |
0.2 |
0 |
0 |
0 |
0 |
0 |
0 |
|
ED9 |
54.8 |
27.44 |
12.25 |
4.74 |
0.46 |
0.31 |
0 |
0 |
0 |
0 |
0 |
0 |
|
ED10 |
47.2 |
31.51 |
16.05 |
4.27 |
0.44 |
0.33 |
0.2 |
0 |
0 |
0 |
0 |
0 |
|
Mean |
53.75 |
29.17 |
11.53 |
4.44 |
0.63 |
0.32 |
0.12 |
0.04 |
0 |
0 |
0 |
0 |
|
Min |
47.13 |
21.67 |
6.09 |
3.46 |
0.31 |
0.12 |
0 |
0 |
0 |
0 |
0 |
0 |
|
Max |
65.83 |
32.46 |
16.05 |
5.65 |
1.02 |
0.95 |
0.37 |
0.23 |
0 |
0 |
0 |
0 |


(a) (b)


(c) (d)


(e) (f)


(g) (h)


(i) (j)


(k) (l)


(m) (n)


(o) (p)


(q) (r)


(s) (t)
Figure 6. Scanning electron microscope of back-scattered images of the sampled clays in the study area, and energy dispersive X-ray spectroscopy (EDS) spectrum of the analysed clay, illustrating the major and minor peaks of minerals in the diffractograms
4.3 Chemical characteristics
The summary results of the elemental (Major) oxides are presented in Table 4. From the results, it was observed that SiO2 concentration in the % range from 43.85 to 66.89, with a mean value of 55.72. It was followed by the relative abundance of Al2O3 (%), which ranged from 20.84 to 31.27, with a mean value of 27.14. Fe2O3 (%) ranged from 4.04 to 17.89, with a mean value of 9.03. Other elements showed relatively low concentration, as presented in Table 4. In terms of their distribution, for SiO2, the highest concentration (%) was found in sample ED6 (66.89). other locations with relatively high amount of SiO2 were samples ED3 (59.82) and ED9 (58.47). Samples ED10 (43.85) and ED8 (49.81) recorded a relatively low amount of SiO2. Significantly, these samples showed a low standard deviation of 5.82, which suggests these samples have similarity in their SiO2 values. For Al2O3, clay samples with relatively high concentration (%) of Al2O3 were ED5 (31.00) and ED2 (30.06), while locations ED8 (24.27) and ED6 (20.84) recorded the least amount of Al2O3. Similarly, the standard deviation of 2.87 suggests close similarity of the Al2O3 concentration in the studied clay samples. A relatively low amount of Fe2O3 was observed in the studied clay samples. The Fe2O3 concentration (%) in the clay samples ranges from 4.04 to 17.89, with a mean of 9.03 and a standard deviation of 3.95. Samples ED8 and ED1 (14.48 and 11.35, respectively) recorded the highest concentration of Fe2O3. In contrast, samples ED6 (4.04) and ED3 (6.59) recorded the lowest concentration of Fe2O3 in the clay samples. The other major elements, Ti2O, CaO, MgO, K2O, MnO, and MgO, were either very low or completely not detected in the clay samples as presented in Table 4. The results of some selected trace elements in ppm are presented in Table 5. Fourteen (14) trace elements were selected for studies in the analysed clay samples. From the results, elements such as Ba, Co, Pb, Zn, and Ni recorded mean values of 188.7 ppm, 3.0 ppm, 4.4 ppm, 5.0 ppm, and 0.7 ppm, respectively. Their concentration suggests a relatively low concentration in the clay. However, their presence in the clay is apparently due to intense weathering and chemical adsorption within the clay lattices, which is the hallmark of clay derived from the tropical environment that has received considerable rainfall, resulting in flux components in the clay samples. Other elements, such as U and Th, showed significant concentration in the clay, with a mean concentration of 5.00 ppm for Uranium and 12.0 ppm for Thorium. These amounts were two (2) fold higher than the mean concentration of these elements in the Average Shale value as presented in Table 5. This suggests that the enrichment of Th and U in the clay is significantly high, apparently from a mixture of sources of the clay through weathering and transportation of sediments from varying fluxes.
Table 4. Summary result for the elemental oxides in the studied clay (%)
|
|
SiO2 |
TiO2 |
Al2O3 |
Fe2O3 |
CaO |
MgO |
Na2O |
K2O |
MnO |
P2O5 |
|
ED1 |
50.04 |
4.84 |
31.27 |
11.35 |
0.15 |
0 |
0 |
0.34 |
0.00 |
0 |
|
ED2 |
57.56 |
4.23 |
30.06 |
6.09 |
0.12 |
0 |
0 |
0.23 |
0.04 |
0 |
|
ED3 |
59.82 |
3.92 |
27.92 |
6.59 |
0.05 |
0 |
0 |
0.52 |
0.04 |
0 |
|
ED4 |
58.18 |
3.8 |
26.74 |
7.24 |
0.25 |
0 |
0 |
0.75 |
0.03 |
0 |
|
ED5 |
55.67 |
3.79 |
31.00 |
6.87 |
0.22 |
0 |
0 |
0.62 |
0.04 |
0 |
|
ED6 |
66.89 |
5.69 |
20.84 |
4.04 |
0.18 |
0 |
0 |
0.51 |
0.04 |
0 |
|
ED7 |
54.65 |
4.53 |
26.99 |
10.67 |
0.21 |
0 |
0 |
0.31 |
0.05 |
0 |
|
ED8 |
49.81 |
5.1 |
24.27 |
14.48 |
0.41 |
0 |
0 |
0.33 |
0.06 |
0 |
|
ED9 |
58.49 |
4.95 |
26.67 |
7.51 |
0.17 |
0 |
0 |
0.47 |
0.04 |
0 |
|
ED10 |
43.85 |
4.23 |
26.57 |
17.89 |
1.72 |
0 |
0 |
0.26 |
0.07 |
0 |
|
SDV |
5.82 |
0.58 |
2.87 |
3.95 |
0.45 |
0.00 |
0.00 |
0.17 |
0.01 |
0.00 |
|
Mean |
55.72 |
4.55 |
27.14 |
9.03 |
0.34 |
0.00 |
0.00 |
0.46 |
0.05 |
0.00 |
|
Min |
43.85 |
3.79 |
20.84 |
4.04 |
0.05 |
0 |
0 |
0.23 |
0.03 |
0 |
|
Max |
66.89 |
5.69 |
31.27 |
17.89 |
1.72 |
0 |
0 |
0.75 |
0.07 |
0 |
Table 5. Selected trace elements in the Ugieghudu clay (ppm)
|
Type |
Ba |
Co |
Nb |
Sr |
Th |
U |
V |
Zr |
La |
Ce |
Cu |
Pb |
Zn |
Ni |
|
ED01 |
162 |
3.4 |
91.2 |
107.4 |
26.6 |
5.2 |
145 |
801 |
108.3 |
200.2 |
2.4 |
4.4 |
15 |
1.2 |
|
ED02 |
255 |
9.3 |
136.7 |
134.5 |
24.6 |
5.1 |
134 |
809.5 |
113.3 |
175.9 |
7.1 |
14 |
10 |
7.1 |
|
ED03 |
160 |
3.3 |
88.2 |
106.4 |
25.8 |
5 |
140 |
823.1 |
104.5 |
194.3 |
2.2 |
4.4 |
13 |
1.1 |
|
ED04 |
163 |
3.5 |
109.2 |
92.2 |
23.1 |
5.8 |
152 |
1092.3 |
90.6 |
147.2 |
2.5 |
8.5 |
5 |
0.7 |
|
ED05 |
202 |
3 |
84.2 |
122.1 |
25.8 |
8.6 |
125 |
1006.9 |
115 |
206.3 |
8 |
10.7 |
14 |
0.9 |
|
ED06 |
190 |
4.5 |
95.9 |
128 |
27.5 |
5.3 |
204 |
1093.8 |
97.2 |
168.1 |
1.8 |
6.9 |
9 |
1.5 |
|
STD |
33.6 |
2.2 |
17.8 |
14.4 |
1.4 |
1.3 |
25.6 |
129.9 |
8.6 |
20.5 |
2.5 |
3.4 |
3.4 |
2.3 |
|
Mean |
188.7 |
4.5 |
100.9 |
115.1 |
25.6 |
5.8 |
150.0 |
937.8 |
104.8 |
182.0 |
4.0 |
8.2 |
11.0 |
2.1 |
|
Min |
160 |
3 |
84.2 |
92.2 |
23.1 |
5 |
125 |
801 |
90.6 |
147.2 |
1.8 |
4.4 |
5 |
0.7 |
|
Max |
255 |
9.3 |
136.7 |
134.5 |
27.5 |
8.6 |
204 |
1093.8 |
115 |
206.3 |
8 |
14 |
15 |
7.1 |
|
ASC |
600 |
20 |
20 |
400 |
12 |
2.0 |
130 |
800 |
40 |
100 |
50 |
20 |
90 |
80 |
|
NASC |
650 |
50 |
1.90 |
200 |
14.60 |
3.1 |
150 |
210 |
- |
- |
50 |
20 |
85 |
55 |
|
PASS |
636 |
- |
13 |
142 |
12.3 |
2.66 |
130 |
200 |
- |
- |
- |
- |
- |
58 |
|
UCC |
550 |
- |
- |
350 |
10.7 |
2.8 |
60 |
190 |
- |
- |
- |
15 |
71 |
- |
4.4 Sources of the clay (Provenance)
The ternary plots of Al2O3/CaO+Na2O/K2O showed that the clay in Ugieghudu, especially, is rich in Al2O3, as almost all the plotted oxides fall on the Al2O3 arena, as observed in Figure 7(a). Similarly, the ternary plot of Al2O3/CaO+NaO+K2O/Fe2O3+MgO showed that the clay in the study area is essentially rich in Al2O3, as presented in Figure 7(b). This aligns very much with the plots of Figure 6. With the plots of Figure 7(c) and (d), it can be said that the clay in the study area is rich in clay alumina oxides, suggesting that the clay may have been weathered from felsic-rich rock rich in alkaline feldspar. The ternary plots in 7(c) and 7(d) essentially showed that there is a relatively high amount of SiO2 concentration, which also buttresses the fact that the parent source of the clay is from felsic rock.

(a)

(b)

(c)

(d)
Figure 7. The ternary plots of Al2O3/CaO+Na2O/K2O; Al2O3/CaO+NaO+K2O/Fe2O3+MgO; Fe2O3+CaO+MgO/Al2O3+TiO2/K2O+Na2O; SiO2+50% (TiO2+Al2O3)+50% (MgO+CaO+Na2O_Fe2O3+K2O)
Efforts were also made to evaluate the clay under study based on Chemical indices such as Chemical Index of Alteration (CIA), Plagioclase Index of Alteration (PIA), and Index of Chemical Variability (ICV). These indices are used to assess the intensity of chemical weathering of rocks and, by extension, clay, which is derived from the weathering effect.
The following formula was used to calculate the CIA, PIA, and ICV [34-36].
$\mathrm{CIA}=\frac{{Al}_2 {O}_3}{{Al}_2 {O}_3+{CaO}*+{Na}_2 {O}+{K}_2 {O}} * 100$
$\mathrm{PIA}=\frac{{Al}_2 {O}_3-\mathrm{K}_2 {O}}{{Al}_2 {O}_3+{CaO} *+{Na}_2 {O}-{K}_2 {O}} * 100$
$\mathrm{ICV}=\frac{{Fe}_2 {O}_3+{K}_2 {O}+{Na}_2 {O}+{CaO}*+{MgO}+{Mn}_2 {O}_3+{TiO}_2}{{Al}_2 {O}_3}$
The nature and intensity of chemical weathering found in the studied clay were evaluated by estimating the CIA. CIA values less than 50% indicate no silicate weathering; 50–60% indicate low weathering; 60–80% is moderate, while above 80% is considered intensive silicate weathering at the source area. Overall, the calculated CIA values range from 88.6 to 98.5% for the samples under consideration. For the studied samples, the CIA values fall under the extreme silicate weathering category (Figure 8), which also aligns with earlier findings that the clay is ultimately derived from felsic rock.
The plot of CIA vs. ICV proposed by Long et al. [37] represents the maturity and weathering nature of clastic and clayey sediments. The index of compositional variability (ICV) is estimated for inferring the compositional maturity of sediments. The ICV values tend to be high during the weathering of early crystallised minerals (pyroxenes and amphiboles), while they decrease with the weathering of late crystallised minerals, including alkali feldspars (Figure 9).

Figure 8. Plot of CIA vs PIA [38]

Figure 9. Binary plot of CIA vs. ICV representing maturity and weathering [37]
According to Oumla et al. [28], the logarithmic values of the ratio of (SiO2/Al2O3) vs. (Fe2O3/K2O) to classify sandstones and shales basically into Fe-rich (Fe-shale and Fe-sandstone) and Fe-poor (shale, wacke, litharenite, and arkose). In the plot, all of the studied samples fall in the Fe-Shale field, as presented in Figure 10.

Figure 10. Geochemical classification (SiO2/Al2O3) vs. (Fe2O3/K2O) [40]
Table 6. Comparison of the mean concentration of major oxides with other clays analysed
|
Oxides |
A |
B |
C |
D |
E |
F |
G |
H |
I |
J |
|
SiO2 |
55.72 |
86.65 |
50.41 |
42.2 |
79.9 |
58.1 |
45.3 |
46.02 |
49.88 |
48.58 |
|
TiO2 |
4.55 |
1.05 |
2.73 |
|
1.31 |
1.72 |
1.44 |
0.5 |
0.09 |
1.72 |
|
Al2O3 |
27.14 |
10.59 |
31.62 |
26.2 |
9.57 |
15.4 |
38.38 |
38.07 |
37.65 |
34.34 |
|
Fe2O3 |
9.03 |
0.24 |
2.43 |
5.1 |
2.06 |
4.24 |
0.3 |
0.33 |
0.88 |
0.7 |
|
CaO |
0.34 |
0.01 |
0.11 |
1.6 |
0.01 |
3.11 |
0.05 |
0.38 |
0.03 |
0.11 |
|
MgO |
0.00 |
0.02 |
0.17 |
0.7 |
0.09 |
2.44 |
0.25 |
0.01 |
0.13 |
0.06 |
|
Na2O |
0.00 |
0.01 |
0.02 |
2.9 |
0.07 |
1.3 |
0.27 |
0.27 |
0.21 |
0.11 |
|
K2O |
0.46 |
0.12 |
0.29 |
8.3 |
1.87 |
3.24 |
0.01 |
0.43 |
1.61 |
0.42 |
|
MnO |
0.05 |
0.1 |
0.17 |
0.03 |
0.02 |
|
|
|
|
0.01 |
|
P2O5 |
0.00 |
0.02 |
0.14 |
|
0.03 |
|
|
|
|
0.06 |
|
LO1 |
2.71 |
5 |
9.82 |
10.23 |
4.7 |
13.03 |
13.97 |
13.47 |
12.43 |
13.02 |
The mean concentration of principal oxides in the clay of this study was compared with similar clay studies in Nigeria and elsewhere. From the results, SiO2 mean content (55.72%) in this study, is closely comparable in mean concentration of SiO2 content with clays in Ubiaja (50.41%), Average Shale (58.1%) [40], Share Clay (45.30%) [17], NAFCON, clay, (46.72%) [41], for fertiliser production, China Ball Clay (48.58%) [42], among others. However, the SiO2 clay content in this study is significantly lower in concentration when compared to the clay in Alori (86.65%) in the Anambra basin [20]. Al2O3 mean content (27.14%) in this study, is found to be similar in mean content to clay in Share (38.38%) [17, 40], (38.07%) [40], among others, but slightly higher in concentration compared to clay from Aloji area (10.59%), and Average Shale concentration (15.4%) [38]. Other Oxides also followed a similar pattern of varying concentration of other Oxides as presented in Table 6.
4.5 Discussion
Clay has a wide range of industrial applications. Clays' applications are a function of their crystal structures, mineral and chemical characteristics. It is these three main attributes, that come to play in their physical properties as reported by previous studies [17, 43-48], from the mineral composition, of the clay, being studied, the result of the XRD and the back scattered image of the scanning electron microscope, it was observed that the Ugieghudu clay is essentially rich in kaolinite, as presented in Table 2 and the diffractograms in Figure 3, kaolinite range of between 33.9% to 74.8%, as well as a relatively high amount of quartz ranging from 23.0% to 63.8%. A relatively low amount of other minerals, such as Anatese, 1.2%–2.2%, was found in the clay. Muscovite, Hematite, Cristobalite, Microcline, and Plagioclase occurred in relatively minute concentrations. The pattern of concentration was like the analysed samples of a previous study [42]; Cretaceous Middle Georgia Clay [3]; Share Clay [17], among others, which have been recommended as important feedstock for some industrial applications, such as brick making, ceramics, and cement production. The result of the scanning electron microscope is found to be in close resemblance with the XRD results, where the mean concentration of Al2O3 was found to be between 29.17%, while the SiO2 concentration had a mean value of 53.75%. Though there was a considerably low amount of Fe2O3 (11.53%), as well as other oxides such as TiO2 (4.44%), among others. The results of the major oxides were evidently similar to the mineral composition of the clay. The major oxide elements showed that SiO2 and Al2O3 make up over 80% of the bulk chemical composition of the clay. In contrast, the other oxide elements showed relatively low concentration, including TiO2, Fe2O3, CaO, MgO, NaO, K2O, and P2O5, accounting for less than 20% of the bulk amount. The relatively high amount of SiO2 and Al2O3 makes the clay kaolinite, hence making it suitable for industrial utilizations as compared to other recommendations of similar clays in the tropics of Nigeria. The considerably high mean amount of Fe2O3 in the clay (9.03%) suggests the influence of tropical weathering, which presents a horizon of the top layer profile that is rich in laterite layers overlying the clay deposits. The relatively low amount of K2O (0.46%) suggests that the clay has undergone severe weathering effects, which is evident in sedimentary environments [43, 44]. The results of the CIA and ICV show that the values of 88.5% to 98.5% suggest that the clay is apparently from felsic origin, that is, the parent rock, and are of great maturity of the clay sediments, which aligns with the works [43, 44]. The plots of the log of Fe2O3/K2O over log SiO2/Al2O3 in Figure 10, plots perfectly on the Fe-Shale region. This suggests an alignment with the geology of the study area, typical of sections of the Imo Shale formation [32], about the Iron-rich Shale in the area. The mean concentration of some selected elements as determined in the clay being studied was compared with the average shale concentration (ASC), North America shale concentration (NASC), post-archean average shale (PASS), and upper continental crust (UCC). From the results shown in Table 5, the Ba mean content in ppm (188.7) in the studied clay was found to be lower than the results of Ba in ASC (600), NASC (650), PASS (636), and UCC (555). The Co (4.5) content in ppm was also found to be lower than the average content of Co (ppm) in ASC (20) and NASC (50). Similar lower concentrations were observed in Sr, Zr, Cu, Pb, Zn, and Ni, compared to the mean concentration in the referenced reports of ASC, NASC, PASS, and UCC. This result aligns closely with the submissions of studies [49, 50]. The relatively lower concentration of these elements in this clay may have been because of intense weathering of this clay under study, before and during the process of sedimentation, as well as the effect of the high rate of rainfall, typical of the tropical environment in Nigeria. Similarly, it may have been as a result of the presence of a high concentration of quartz in the clay [51, 52]. As a result of selective leaching of the elements arising from variation in the sizes of their ions, even though it is common knowledge that elements are in great association with clay minerals. There were relatively high amounts of U, V, Zr, La, and Ce in the clay under study compared to the mean values of these elements in ASC, NASC, PASS, and UCC. This may have been because of the effect of high mobility of light ion elements during weathering and the high rate of hydration that is associated with the weathering processes, resulting in subsequent enrichment during sediment transportation and sedimentation. This phenomenon is in corroboration with the submission of a previous study [46]. The mineralogical and chemical results of Ugieghudu clay suggest that the clay is rich in kaolinite, as well as a considerable amount of quartz. It can be said that the clay is kaolinitic; hence, it fits in properly for various industrial feedstocks for which kaolin-rich clay can be used. The considerable amount of Fe2O3 and TiO2 also makes the clay effectively suitable for some industrial applications, where necessary [46-48, 53]. Such industrial uses that the Ugieghudu clay can effectively be used for include, as fillers and extenders in the production of papers, as a formula for paint production, and as inert extenders in fillers. Other possible industrial applications include feedstocks for pharmaceuticals, as adsorbents and diluents in tablet and capsule production, cosmetics, the production of fertilizers, ceramics, cements, and other uses.
The Ugieghudu clay has been studied. The clay occurs as layers of beds within the Imo Shale formation, which lies on the western flank of the Anambra basin, Southern Nigeria. The results of the XRDs, which measure the mineral distributions in the clay, showed that the Ugieghudu clay is essentially rich in kaolinite. There is a significant amount of quartz and anatase in the studied clay. In the same vein, there is a very low to no amount of muscovite and cristobalite in about 20% of the samples in the analysed clay. The results of the major oxide elements showed that the clay is rich in Al2O3, with an average amount of 27.14% as well as an average concentration of SiO2 of 55.72%. Other elemental oxides with considerable amounts include TiO2 (4.55%) and Fe2O3 (9.03%). Other oxides with very low to no concentration include CaO, MgO, Na2O, K2O, MnO, and P2O5. These results corroborate the results of the back-scattered images of the scanning electron microscope. The weathering effect evaluation of the nature of the clay suggests that the clay has undergone high weathering processing, as well as the fact that the clay has experienced a higher CIA, with significant maturity, hence plotting on the Fe-Shale-field portion of the geochemical log plots of SiO2/Al2O3 vs. Fe2O3/K2O table. Comparative assessment of the chemistry of the clay with other published submissions showed that the clay fits in very well with other clays that are significantly relevant for various industrial utilizations. Hence, the Ugieghudu clay deposits, with all these attributes, are beneficial in several industries, such as refractories, fertilizers, ceramics, and cement production, among others.
The authors are grateful to the community leaders who made it possible to access the sites, Mr Ighodaro O., Ogieva, C., Festus Agbonsalo, and Festus Iyonadioyi. The efforts of our project students during the research are highly appreciated. The efforts of the independent reviewers are also greatly appreciated.
[1] Nyassa Ohandja, H., Ntouala, R.F.D., Onana, V.L., Ngo’o Ze, A., Ndzié Mvindi, A.T., Ekodeck, G.E. (2020). Mineralogy, geochemistry and physico-mechanical characterization of clay mixtures from Sa’a (Center Cameroon): Possibly use as construction materials. SN Applied Sciences, 2(10): 1687. https://doi.org/10.1007/s42452-020-03365-y
[2] Olofinyo, O.O., Olabode, O.F., Fatoyinbo, I.O. (2019). Engineering properties of residual soils in part of Southwestern Nigeria: Implication for road foundation. SN Applied Science, 1: 507. https://doi.org/10.1007/s42452-019-0515-3
[3] Murray, H.H. (2006). Applied Clay Mineralogy: Occurrences, Processing and Applications of Kaolins, Bentonites, Palygorskitesepiolite, and Common Clays. Elsevier.
[4] Malepe, R.E. (2022). Geophagic materials and their potential impacts on human health in South Africa: A case study from Fetakgomo Tubatse Local Municipality (FTLM) area in Limpopo Province. Doctoral dissertation. University of Johannesburg. https://hdl.handle.net/10210/502183.
[5] Malepe, R.E., Candeias, C., Mouri, H. (2023). Geophagy and its potential human health implications–A review of some cases from South Africa. Journal of African Earth Sciences, 200: 104848. https://doi.org/10.1016/j.jafrearsci.2023.104848
[6] Arslan, C., Gencel, O., Borazan, I., Sutcu, M., Erdogmus, E. (2021). Effect of waste-based micro cellulose fiber as pore maker on characteristics of fired clay bricks. Construction and Building Materials, 300: 124298. https://doi.org/10.1016/j.conbuildmat.2021.124298
[7] Muñoz, P., Morales, M.P., Mendívil, M.A., Juárez, M.C., Muñoz, L. (2014). Using of waste pomace from winery industry to improve thermal insulation of fired clay bricks. Eco-friendly way of building construction. Construction and Building Materials, 71: 181-187. https://doi.org/10.1016/j.conbuildmat.2014.08.027
[8] Ozturk, S., Sutcu, M., Erdogmus, E., Gencel, O. (2019). Influence of tea waste concentration in the physical, mechanical and thermal properties of brick clay mixtures. Construction and Building Materials, 217: 592-599. https://doi.org/10.1016/j.conbuildmat.2019.05.114
[9] Kambunga, S.N., Candeias, C., Hasheela, I., Mouri, H. (2019). Review of the nature of some geophagic materials and their potential health effects on pregnant women: Some examples from Africa. Environmental Geochemistry and Health, 41(6): 2949-2975. https://doi.org/10.1007/s10653-019-00288-5
[10] Abdelmalek, B., Rekia, B., Youcef, B., Lakhdar, B., Nathalie, F. (2017). Mineralogical characterization of Neogene clay areas from the Jijel basin for ceramic purposes (NE Algeria-Africa). Applied Clay Science, 136: 176-183. https://doi.org/10.1016/j.clay.2016.11.025
[11] Alcântara, A.C.S., Beltrão, M.S.S., Oliveira, H.A., Gimenez, I.F., Barreto, L.S. (2008). Characterization of ceramic tiles prepared from two clays from Sergipe—Brazil. Applied Clay Science, 39(3-4): 160-165. https://doi.org/10.1016/j.clay.2007.05.004
[12] Bennour, A., Mahmoudi, S., Srasra, E., Hatira, N., Boussen, S., Ouaja, M., Zargouni, F. (2015). Identification and traditional ceramic application of clays from the Chouamekh region in south-eastern Tunisia. Applied Clay Science, 118: 212-220. https://doi.org/10.1016/j.clay.2015.09.018
[13] Bomeni, I.Y., Njoya, A., Ngapgue, F., Wouatong, A.S.L., Fouateu, R.Y., Kabeyene, V.K., Fagel, N. (2018). Ceramic with potential application of ngwenfon alluvial clays (noun, West Cameroon) in building construction: Mineralogy, physicochemical composition and thermal behaviour. Construction and Building Materials, 182: 493-503. https://doi.org/10.1016/j.conbuildmat.2018.06.135
[14] Akhirevbulu, O.E., Amadasun, C.V., Ogunbajo, M.I., Ujuanbi, O. (2010). The geology and mineralogy of clay occurrences around Kutigi central Bida Basin, Nigeria. Ethiopian Journal of Environmental Studies and Management, 3(3): 49-56. https://doi.org/10.4314/ejesm.v3i3.63965
[15] Ojo, O.J., Adepoju, S.A., Adewole, T.M., Abiola, A.O. (2011). Sedimentological and geochemical studies of Maastrichtian clays in Bida Basin, Nigeria: Implication for resource potential. Centrepoint Journal, 17(2): 71-88.
[16] Okoye, I.P., Obi, C. (2011). Synthesis and characterization of Al-pillared bentonite clay minerals. Research Journal of Applied Sciences, 6(7-12): 447-450.
[17] Aromolaran, O.K., Adebayo, A.B. (2022). Mineralogical, geochemical, and industrial appraisal of kaolinitic claystones in Share area, northcentral Nigeria. Arabian Journal of Geosciences, 15(8): 789. https://doi.org/10.1007/s12517-022-09825-6
[18] Alege, E.K., Alege, T.S., Barnabas, G.Y., Idakwo, S.O. (2015). Compositional characteristics and industrial assessment of the cretaceous clay deposits within Northern Anambra Basin, Nigeria. Journal of Environment and Earth Science, 5(6): 11-19.
[19] Elueze, A.A., Bakare, C.A., Bolarinwa, A.T. (2004). Mineralogical, chemical and industrial characteristics of residual clay occurrences in Iwo and Ijebu districts, southwestern Nigeria. Journal of Mining and Geology, 40(2): 119-126. https://doi.org/10.4314/jmg.v40i2.18817
[20] Alege, T.S., Idakwo, S.O., Alege, E.K., Gideon, Y.B. (2014). Geology, mineralogy and geochemistry of clay occurrences within the Northern Anambra Basin, Nigeria. British Journal of Applied Science and Technology, 4(5): 841-852.
[21] Adeola, A.J. (2015). Mineralogy and geochemistry of residual clay occurrences in Idi-Ayunre and Akure areas, southwestern Nigeria. Journal of Geography and Geology, 7(4): 23-32. http://doi.org/10.5539/jgg.v7n4p23
[22] Adeleye, A.M, Odurinde, O.O, Abdullahi, W.H. (2019). Molecular and trace element geochemistry of shales of Patti Formation, Southern Bida Basin, central Nigeria. Warta Geologi, 45(3): 269-271.
[23] Bolarinwa, A.T., Idakwo, S.O., Bish, D.L. (2021). Source area-weathering, provenance and tectonic setting of the Campanian-Maastrichtian clay sequences in the Lower Benue Trough of Nigeria. Journal of African Earth Sciences, 173: 104050. https://doi.org/10.1016/j.jafrearsci.2020.104050
[24] Meimaroglou, N., Mouzakis, C. (2019). Cation Exchange Capacity (CEC), texture, consistency and organic matter in soil assessment for earth construction: The case of earth mortars. Construction and Building Materials, 221: 27-39. https://doi.org/10.1016/j.conbuildmat.2019.06.036
[25] Perrot, A., Rangeard, D., Menasria, F., Guihéneuf, S. (2018). Strategies for optimizing the mechanical strengths of raw earth-based mortars. Construction and Building Materials, 167: 496-504. https://doi.org/10.1016/j.conbuildmat.2018.02.055
[26] Meimaroglou, N., Mouzakis, H. (2018). Mechanical properties of three-leaf masonry walls constructed with natural stones and mud mortar. Engineering Structures, 172: 869-876. https://doi.org/10.1016/j.engstruct.2018.06.015
[27] Van Damme, H., Houben, H. (2018). Earth concrete. Stabilization revisited. Cement and Concrete Research, 114: 90-102. https://doi.org/10.1016/j.cemconres.2017.02.035
[28] Oumla, K.O., François, N.N.G., Nathanael, T., Constantin, B.E., Bertrand, M.M., Simon, M.J., Jacques, E. (2022). Physicochemical and mineralogical characterization of clay materials in the Douala coastal sedimentary sub-basin (Cameroon, Central Africa). Journal of Geosciences and Geomatics, 10: 126-138. https://doi.org/10.12691/jgg-10-3-2
[29] Adamou, J.M.K., Ntouala, R.F.D., Effoudou, E.N., Bineli, M.T.N., Ze, A.N.O., Hamadjida, G., Onana, V.L. (2023). Mineralogical, geochemical, and geotechnical features of lateritic soils from termite mounds in two contrasting savannah areas (central Cameroon) as raw materials for brick making. Heliyon, 9(6): e17257. https://doi.org/10.1016/j.heliyon.2023.e17257
[30] Nwajide, C.S. (2013). Geology of Nigeria’s Sedimentary Basins. CSS Bookshop.
[31] Annor, A.E., Olasehinde, P.I., Pal, P.C., Mebradu, S., et al. (1990). Ichnofossils from the Imo formation and their paleoenvironmental significance NPC Anyanwu and Ingela Arua 1 2. Basement fracture patterns in the control of water channels. Journal of Mining and Geology, 26: 148.
[32] Nwajide, C.S., Reijers, T.J.A. (1996). Geology of the Southern Anambra Basin. In Selected Chapters on Geology, pp. 133-148.
[33] Nigeria Geological Survey Agency. (2006). Authority of the Federal Republic of Nigeria. https://ngsa.gov.ng/.
[34] Nesbitt, H.W., Young, G.M. (1982). Early Proterozoic climates and plate motions inferred from major element chemistry of lutites. Nature, 299(5885): 715-717. https://doi.org/10.1038/299715a0
[35] Fedo, C.M., Wayne Nesbitt, H., Young, G.M. (1995). Unraveling the effects of potassium metasomatism in sedimentary rocks and paleosols, with implications for paleoweathering conditions and provenance. Geology, 23(10): 921-924. https://doi.org/10.1130/0091-7613(1995)023%3C0921:UTEOPM%3E2.3.CO;2
[36] Cox, R., Lowe, D.R., Cullers, R.L. (1995). The influence of sediment recycling and basement composition on evolution of mudrock chemistry in the southwestern United States. Geochimica et Cosmochimica Acta, 59(14): 2919-2940. https://doi.org/10.1016/0016-7037(95)00185-9
[37] Long, X., Yuan, C., Sun, M., Safonova, I., Xiao, W., Wang, Y. (2012). Geochemistry and U–Pb detrital zircon dating of Paleozoic graywackes in East Junggar, NW China: Insights into subduction–accretion processes in the southern Central Asian Orogenic Belt. Gondwana Research, 21(2-3): 637-653. https://doi.org/10.1016/j.gr.2011.05.015
[38] McLennan, S.M., Nance, W.B., Taylor, S.R. (1980). Rare earth element-thorium correlations in sedimentary rocks, and the composition of the continental crust. Geochimica et Cosmochimica Acta, 44(11): 1833-1839. https://doi.org/10.1016/0016-7037(80)90232-X
[39] Herron, M.M. (1988). Geochemical classification of terrigenous sands and shales from core or log data. Journal of Sedimentary Research, 58(5): 820-829. https://doi.org/10.1306/212F8E77-2B24-11D7 8648000102C1865D
[40] Pettijohn, F.J. (1975). Sedimentary Rocks. New York: Harper & Row.
[41] Tender Document for the Supply of Kaolin from Nigerian Sources. (1985). National Fertilisers Company of Nigeria (NAFCON).
[42] Hubber, J. (1985). Kaolin Clays. Huber Corporation (Clay Division), Georgia, USA.
[43] Christidis, G.E. (2010). Industrial clays. In Advances in the Characterization of Industrial Minerals, pp. 341-414. https://doi.org/10.1180/EMU-notes.9.9
[44] Diko-Makia, L., Ligege, R. (2020). Composition and technological properties of clays for structural ceramics in Limpopo (South Africa). Minerals, 10(8): 700. https://doi.org/10.3390/min10080700
[45] Taylor, S.R., McLennan, S.M. (1985). Continental crust: its composition and evolution. In Their Composition, Origin and Evolution, pp. 301-324. http://doi.org/10.1017/CBO9780511575358.014
[46] Ntouala, R.F.D., Onana, V.L., Kamgang, V., Ekodeck, G.E. (2016). Mineralogical, geochemical and mechanical characterization of the Ayos (East-Cameroon) lateritic and alluvial clayey mixtures: Suitability for building application. Journal of Building Engineering, 5: 50-56. https://doi.org/10.1016/j.jobe.2015.11.007
[47] Dondi, M., Raimondo, M., Zanelli, C. (2014). Clays and bodies for ceramic tiles: Reappraisal and technological classification. Applied Clay Science, 96: 91-109. https://doi.org/10.1016/j.clay.2014.01.013
[48] Kogel, J.E. (2014). Mining and processing kaolin. Elements, 10(3): 189-193. https://doi.org/10.2113/gselements.10.3.189
[49] Adebowale, A.A., Anthony, B.T. (2022). Rare earth and trace elements composition of a residual clay from Sosan Akoko, Southwestern Nigeria: Implications for weathering and provenance. Environmental and Earth Sciences Research Journal, 9(2): 21. https://doi.org/10.18280/eesrj.090201
[50] Awwiller, D.N. (1994). Geochronology and mass transfer in Gulf Coast mudrocks (south-central Texas, USA): Rb, Sr, Sm, Nd and REE systematics. Chemical Geology, 116(1-2): 61-84. https://doi.org/10.1016/0009-2541(94)90158-9
[51] Compton, J.S., White, R.A., Smith, M. (2003). Rare earth element behavior in soils and salt pan sediments of a semi-arid granitic terrain in the Western Cape, South Africa. Chemical Geology, 201(3-4): 239-255. http://doi.org/10.1016/S0009-2541(03)00239-0
[52] Taylor, S.R., McLennan, S.M. (1981). The composition and evolution of the continental crust: Rare earth element evidence from sedimentary rocks. Philosophical Transactions of the Royal Society of London. Series A, Mathematical and Physical Sciences, 301(1461): 381-399. https://doi.org/10.1098/rsta.1981.0119
[53] Balan, E., Calas, G., Bish, D.L. (2014). Kaolin-group minerals: From hydrogen-bonded layers to environmental recorders. Elements, 10(3): 183-188. https://doi.org/10.2113/gselements.10.3.183