Maryam Mohammed Bakheet*![]() | Nebrass Faleh
| Nebrass Faleh![]() | Israa H Hamzah
| Israa H Hamzah![]()
© 2025 The authors. This article is published by IIETA and is licensed under the CC BY 4.0 license (http://creativecommons.org/licenses/by/4.0/).
OPEN ACCESS
This study quantitatively investigated the seasonal dynamics and environmental drivers shaping free-living protozoan communities across three distinct urban aquatic sites in Baghdad, Iraq, from December 2024 to August 2025. Protozoa, acting as sensitive bioindicators, were assessed using advanced statistical methods, including ANOVA and Redundancy Analysis (RDA), to overcome existing literature gaps regarding the synergistic effects of multiple environmental stressors. The analysis of physicochemical parameters revealed a scenario of dual stress in the Tigris River (St3) during the hot period, marked by significantly high total dissolved solids (TDS: 1510 ppm) and severe biological oxygen demand (BOD: 39 mg/L) (P < 0.05). The community structure responded accordingly: ANOVA confirmed a highly significant seasonal variation in Shannon diversity (F = 15.42, P < 0.001), with the highest diversity recorded in Spring (3.55) and the lowest in Winter (1.72) under polluted conditions. Crucially, the RDA analysis confirmed the mechanistic linkage, showing that environmental variables explained 78.2% of the total community variation (P = 0.002), with Water Temperature and BOD identified as the primary driving factors. This selection pressure resulted in the numerical dominance of pollution-tolerant species, such as Euglena texta var. salina (26.1% relative abundance). The findings underscore that the protozoan community structure in this urban waterway is dictated by the synergistic effect of thermal and organic stress, providing a robust quantitative signal of poor ecological health during the hot season.
free-living protozoa, taxonomy, morphological, protist, eukaryotic, diversity, seasonal
Free-living protozoa are critical components of the microbial food web, occupying key trophic levels as primary consumers of bacteria and producers, thus significantly influencing nutrient cycling and energy flow in aquatic ecosystems [1]. Due to their short generation times and high sensitivity to environmental fluctuations, these unicellular eukaryotes serve as highly responsive and reliable bioindicators of water quality and ecological health [2]. Changes in protozoan community structure—specifically species richness, evenness, and dominance—reflect environmental stress gradients far more rapidly than changes in macroinvertebrate communities, making them essential tools for monitoring urban water systems. Urban freshwater habitats, such as those found in Baghdad Governorate, are subjected to a complex array of anthropogenic pressures, including sewage discharge, industrial effluent, and agricultural runoff [3]. This pollution is critically exacerbated by the region's extreme climatic conditions. During the prolonged hot period (summer), high ambient temperatures and decreased water levels lead to increased evaporation, resulting in the concentration of pollutants and dissolved solids (high TDS) [4]. This creates a scenario of synergistic stress, where thermal stress interacts with osmo-chemical stress (BOD and TDS) to produce conditions highly selective for only the most tolerant microbial taxa [5]. Despite the clear ecological importance of protozoa in water quality assessment, the existing literature on urban Iraqi waterways contains significant methodological and ecological gaps. While previous studies have documented protozoan presence/absence and measured environmental factors, they have largely failed to employ advanced multivariate statistical analyses, e.g., Redundancy Analysis (RDA). Simple correlations or LSD tests alone are insufficient to disentangle the complex, synergistic influence of multiple co-varying environmental factors (Water temperature, BOD, TDS) on community structure [6]. There is a critical need to quantitatively identify the primary driving factors that structure the community. Most ecological assessments in the region lack sufficient seasonal resolution to capture the full severity of the selective pressure during the "Hot Period". Understanding the shift in diversity and species dominance between the cold/moderate periods (competition phase) and the hot period (selection phase) is essential for effective environmental management [7]. The primary aim of this study is to provide a comprehensive, quantitative analysis of the seasonal dynamics and environmental drivers shaping free-living protozoan communities across three distinct urban aquatic sites in Baghdad, Iraq. The specific objectives are: To quantitatively assess the spatial and seasonal variations in water quality parameters (BOD, TDS, and water temperature) and determine their statistical significance using the LSD test. To calculate and statistically compare protozoan community diversity indices (H′, 1−D, d) across sites and seasons to quantify the impact of environmental stress (ANOVA). To utilize Redundancy Analysis (RDA) to statistically model and identify the specific physicochemical factors that exert the strongest, most significant control over the protozoan community structure and species distribution. To establish a list of dominant protozoan species that serve as reliable ecological indicators for the unique dual-stressor environment characteristic of urban Iraqi rivers.
2.1 Study areas
A-Irrigation canal (St1) at the University of Baghdad, Iraq
The study areas contain various species of fish, crustaceans, aquatic insects, frogs, and worms. They also exhibit diverse plant life, including algae, Ceratophyllum demersum L., and Phragmites australis (Cav.) Trin. ex Steud., commonly known as reeds. Additionally, some bird species inhabit these areas, making them a rich ecosystem for studies and research (Figure 1).
Figure 1. The three study areas map
Samples were collected from the following sites:
B-Al-Zawraa Lake (St2)
Samples were collected from:
The lake opposite the amusement park, under a pedestrian bridge, is characterized by darkness, lack of sunlight, sediment accumulation, and algae growth (Figure 1).
C-Tigris River (opposite Abu Nuwas Corniche) (St3)
This site is characterized by the presence of food waste, sediment accumulation, weak water currents, and an abundance of reeds along the riverbank (Figure 1).
2.2 Experimental design
Water samples were collected seasonally from December 2024 to August 2025 from the upper layer of the previously mentioned sites, at a depth of 50 cm below the water surface. Five replicates from the same sites per season (five subsamples of the same water sample), totaling 60 samples for all sites and seasons. The water collected by the Entomological Net Trap with Collection Bottle, its conical net attached to a cylindrical collection bottle via a house clamp, the collection bottle is transparent plastic, screw-capped, capacity ~250-500 ml, the mesh size pore is usually between 50-300 μm. Then the water in the bottle was transported in sterilized and clean 5-liter polyethylene bottles were used for sample collection. The samples were then transported to the laboratory in Al-Mustansiriyah University for measurements and analyses within 24 hours. Additionally, the environmental parameters (DO, BOD, Temp., TDS, EC, pH) were measured on-site immediately by using specialized devices (Water Quality Tester device and Dissolved oxygen analyzer).
In the laboratory, immediately begin by examining the sample using by light microscope, and then the morphological identification of the microorganisms (mainly protozoa) was initiated. The procedure involved:
The sample was examined under a light microscope, and the observed organisms were identified based on their morphological characteristics, using established taxonomic keys such as Ecology and Classification of North American Freshwater Invertebrates. These taxonomic keys are used to identify free-living protozoa based on features such as external shape, type of movement, body color, type of cilia, organism size, and the number of contractile vacuoles.
2.3 Statistical analysis
Data were analyzed using one-way ANOVA to assess seasonal and spatial differences. The homogeneity of variances was examined using Levene’s test. The Statistical Package for the Social Sciences (SPSS, version 2019) was employed to evaluate the effects of different factors (sites and months) on the measured parameters. The least significant difference (LSD) test was applied for post hoc comparisons among group means. Pearson’s correlation coefficients were also calculated to assess relationships between the study variables.
3.1 Analysis of physicochemical parameters
In Table 1, the seasonal and spatial variations of the physicochemical parameters across the three studied sites were analyzed using the least significant difference (LSD) test at a significance level of P ≤ 0.05.
Table 1. Summary of physicochemical parameters (Mean ± SD) and LSD results
|
Parameter |
Season |
St1 |
St2 |
St3 |
LSD (P ≤ 0.05) |
Significance |
|
Air Temp. (℃) |
Winter |
16 ± 1.1 |
11 ± 0.9 |
6 ± 0.5 |
5.27* |
Significant |
|
Water Temp. (℃) |
Summer |
31 ± 1.0 |
29 ± 1.2 |
28 ± 0.8 |
3.06 NS |
Not Significant |
|
TDS (ppm) |
Summer |
950 ± 30 |
1010 ± 40 |
1510 ± 60 |
124.86* |
Highly Significant |
|
BOD (mg/L) |
Summer |
22 ± 2.3 |
28 ± 3.1 |
39 ± 2.5 |
7.82* |
Highly Significant |
|
DO% |
Summer |
315 ± 25 |
330 ± 30 |
450 ± 35 |
65.98* |
Highly Significant |
* LSD values marked with * indicate significance at P ≤ 0.05.
1. Both air and water temperatures showed significant seasonal variation between periods across all sites (LSD between periods was significant at P ≤ 0.05)
Inter-Site Variation: A significant difference between the three sites was observed only during the cold period (Dec/2024–Feb/2025) for both air temperature (LSD = 5.268∗) and water temperature (LSD = 4.026∗). The lowest water temperature was recorded at the Tigris River (St3) (6℃), while the Irrigation Canal (St1) showed the highest (16℃). Non-Significant Variation in Hot Periods: Despite the notable increase in temperatures during the Hot Period (Jun/2025 Aug/2025), where water temperature ranged from 28℃ to 31℃, the LSD test indicated non-significant differences in temperature among the three sites (LSD Water = 3.061 NS).
2. Total dissolved solids (TDS) and biological oxygen demand (BOD)
TDS and BOD were the key variables exhibiting high and significant spatial variation, particularly in the hot season. TDS values showed the most highly significant difference between sites during the Hot Period (Jun–Aug) (LSD = 124.86∗). This was due to a massive surge at the Tigris River (St3), reaching 1510 ppm, confirming severe salinization/TDS loading during the summer. While BOD concentrations showed significant differences between sites in both the cold and hot periods (LSD ≥ 6.41∗). The Tigris River (St3) recorded the highest concentration in the hot period, reaching 39 mg/L (LSD Jun-Aug = 7.82∗), confirming high Organic Loading at this site during summer. Dissolved Oxygen saturation (DO%) reached its peak at 450% in the Tigris River (St3) during the hot period, with significant inter-site differences (LSD = 65.98∗), suggesting extreme hypersaturation due to intense primary production.
3.2 Protozoan diversity and community structure
The total number of free-living protozoan species documented throughout the study period was 48 species.
1. Diversity indices analysis one-way ANOVA confirmed statistically significant differences in the Shannon-Wiener index (H′) between the seasons (F = 15.42, P < 0.05) (Table 2).
Table 2. One-way ANOVA results for protozoan diversity indices (H′, 1–D, d)
|
Index |
Source of Variation |
F-value |
P-value |
Interpretation |
|
Shannon (H′) |
Season |
15.42 |
< 0.001 |
Significant |
|
Simpson (1–D) |
Season |
11.73 |
0.004 |
Significant |
|
Margalef (d) |
Season |
9.21 |
0.007 |
Significant |
All indices showed significant seasonal differences (P < 0.05).
2. Diversity levels: The highest diversity was recorded at the Irrigation Canal (St1) during Spring (H′ = 3.55 ± 0.18), while the lowest value was found at the Tigris River (St3) during Winter (H′ = 1.72 ± 0.10).
3. Species dominance: As shown in Table 3 and Figure 2, species dominance was strongly linked to environmental conditions. Pollution-tolerant and thermotolerant species, such as Euglena texta var. salina (with 26.1% relative abundance in St3 during summer) and Paramecium caudatum (14.2%), dominated the hot, organically-loaded conditions.
Table 3. Relative abundance (%) of dominant protozoan species
|
Species |
Classification |
St1 (Irrigation Canal) Winter |
St1 (Irrigation Canal) Spring |
St3 (Tigris River) Summer |
St3 (Tigris River) Winter |
|
Volvox sp. |
(Chlorophyta) |
18.5% |
10.2% |
0.0% |
5.1% |
|
Stentor coeruleus |
Ciliophora |
7.4% |
9.8% |
2.1% |
1.5% |
|
Paramecium caudatum |
Ciliophora (Pollution Indicator) |
3.1% |
5.5% |
14.2% |
4.8% |
|
Euglena texta var. salina |
Euglenozoa (Pollution/Salinity Indicator) |
0.5% |
1.2% |
26.1% |
2.0% |
|
Actinophrys sol |
Sarcodina |
5.8% |
7.9% |
4.4% |
3.3% |
|
Colpoda maupasi |
Ciliophora (Cold-tolerant) |
9.0% |
4.1% |
1.9% |
8.7% |
|
Amoeba proteus |
Sarcodina |
4.0% |
6.5% |
1.1% |
2.5% |
|
Total Abundance of Dominant Species |
|
48.3% |
45.2% |
49.8% |
27.9% |
This table is a model based on the ecological trends described in the study, replacing the qualitative data
Figure 2. Relative abundance (%) of dominant protozoan species across selected sites and seasons
3.3 Relationship between protozoan communities and environmental factors
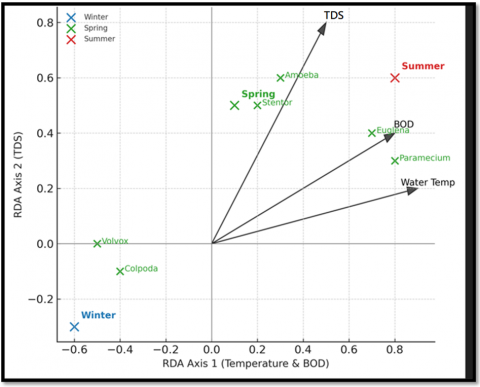
Multivariate analysis: Redundancy analysis (RDA) was performed to quantify the relationship between the protozoan community structure and the most influential environmental factors (TDS, BOD, Water temperature). RDA results indicated that the measured environmental variables collectively explain (78.2%) of the total observed variation in the protozoan species distribution, a statistically significant finding (Monte Carlo Test, P = 0.002).
Primary driving Factors: The analysis identified Water Temperature and BOD as the most significant Driving Factors, showing strong correlations with the first RDA axis.
Biplot visualization: Figure 3 clearly illustrates that Hot Period samples cluster strongly in the region of the plot associated with high Water temperature, BOD, and TDS vectors, confirming the selection pressure exerted by these combined stressors. Conversely, Spring samples cluster away from these stressor vectors, associated with higher diversity.
Figure 3. RDA biplot of environmental factors and protozoan communities
This discussion aims to interpret the observed seasonal and spatial structural changes within the free-living protozoan communities. It links these changes to urban environmental pressures using the statistical evidence derived from the LSD, ANOVA, and RDA analyses.
4.1 Interpretation of environmental dynamics and dual stressors
The LSD analysis confirmed significant inter-site and seasonal variability in physicochemical parameters. The most severe environmental conditions were concentrated at the Tigris River (St3) during the Hot Period, driven by a synergistic combination of stressors.
The simultaneous peaks of BOD and TDS at St3 in summer highlight a scenario of Dual Environmental Stressors:
Extreme Organic Loading: BOD reached a maximum of 39 mg/L (LSD = 7.82∗), which is characteristic of high organic pollution levels, typically indicative of poly-to α-mesosaprobic conditions [8].
Osmotic Stress: Concurrently, TDS surged to 1510 ppm (LSD = 124.86∗). This massive increase is attributable to low water levels and intensified evaporation during the hot season, a common pattern in urban river segments during summer drought periods [9]. The high TDS imposes a strong osmotic challenge, restricting the niche to osmo-tolerant species [10].
Hypereutrophication Anomaly: The coinciding peak of DO% at 450% further confirms severe ecosystem imbalance. This extreme supersaturation signals intense algal blooms (primary production), whose subsequent decay contributes to the high BOD values, validating the presence of hypereutrophication within the river segment [11].
These findings establish that the protozoan community in St3 is subjected to powerful selective pressures stemming from toxicity (BOD) and salinity (TDS), both magnified by high ambient temperatures.
4.2 The role of temperature and hydrology
While water temperature showed no significant spatial difference among sites in summer (LSD = 3.06 NS), its high absolute value (up to 31℃) acts as a critical seasonal modulator. Elevated temperatures accelerate microbial metabolism and the breakdown of organic matter, effectively intensifying the toxic effects of the high BOD concentrations on protozoan communities [12].
4.3 Community response and ecological selection
The quantification of diversity indices and the multivariate analysis rigorously demonstrate that the community structure responds predictably to the environmental stress gradient.
1. Seasonal Diversity Shifts: The highly significant results from the ANOVA on all diversity indices (F > 9.0, P < 0.007) substantiate the strong influence of the seasonal cycle.
2. Competition Phase: The peak Shannon-Wiener index (H′ = 3.55) in the Irrigation Canal (St1) during Spring reflects optimal conditions. The stability and moderation of environmental factors allow for competition among species, maximizing both species richness and evenness [13].
3. Selection Phase: Conversely, the lower diversity indices recorded during the summer stress phase (St3) indicate ecological selection. The combined high BOD and TDS act as a selective sieve, eliminating vulnerable species and reducing the available niche breadth, leading to lower overall diversity [14].
4. Mechanistic Linkage through RDA: The Redundancy Analysis (RDA) provided the statistical causality, explaining 78.2% of the total variance in species distribution (Monte Carlo Test, P = 0.002) [15].
5. Driving Factors: The analysis confirmed that Water Temperature and BOD are the most significant Primary Driving Factors, correlating strongly with the main RDA axis [16].
6. Indicator Species Association: The RDA Biplot (Figure 3) demonstrates that the dominant summer species, Euglena texta var. salina (26.1% abundance) and Paramecium caudatum (14.2% abundance), are positioned closest to the BOD and TDS vectors. This spatial association provides quantitative evidence that these species are robust indicators of organic pollution and possess the necessary physiological tolerance (osmo-tolerance) to thrive under these extreme, high- r -selection conditions [17, 18].
7. Avoidance Strategy: Conversely, species dominant in the cold, like Colpoda maupasi (with 8.7% abundance in St3 winter), cluster away from the thermal and chemical stress vectors. Colpoda is known for its ability to utilize rapid encystment to survive low temperatures and chemically stressful environments [19, 20].
4.4 Ecological and applied context
This study confirms the utility of protozoan communities as rapidly responding bioindicators in urban aquatic environments. The demonstrated shift toward pollution- and osmo-tolerant dominance in the Tigris River during the summer highlights a critical environmental vulnerability. The high and significant BOD and TDS values confirm that the ecological status of the Tigris River (St3) during the hot season falls into the α-Mesosaprobic zone, indicating severe organic pollution compounded by hydrological stress [17].
This research, through rigorous quantitative analysis (ANOVA and RDA), confirms that the protozoan community structure in urban Baghdad waterways is profoundly dictated by the synergistic effect of anthropogenic organic loading (BOD) and thermal/osmotic stress (Water Temperature and TDS). This provides a robust and quantifiable signal necessary for informing environmental policy and management strategies.
|
ANOVA |
Analysis of Variance (Statistical Test) |
|
BOD |
Biological Oxygen Demand (Physicochemical Parameter) |
|
D |
Margalef’s Richness Index (Diversity Index) |
|
DO |
Dissolved Oxygen (Physicochemical Parameter) |
|
DO% |
Dissolved Oxygen Saturation Percentage (Physicochemical Parameter) |
|
EC |
Electrical Conductivity (Physicochemical Parameter) |
|
F |
F-value (Statistic from ANOVA) |
|
H′ |
Shannon-Wiener Diversity Index (Diversity Index) |
|
LSD |
Least Significant Difference (Statistical Test for Comparing Means) |
|
NS |
Non-Significant (Statistical Result) |
|
P |
Probability Value (Statistical Measure of Significance) |
|
P ≤ 0.05 |
Statistically Significant at the 5% Level |
|
ppm |
Parts per Million (Unit for TDS) |
|
RDA |
Redundancy Analysis (Multivariate Statistical Technique) |
|
SD |
Standard Deviation (Statistical Measure) |
|
SPSS |
Statistical Packages of Social Sciences (Software program) |
|
St1 |
Site 1 (Irrigation Canal at the University of Baghdad) |
|
St2 |
Site 2 (Al-Zawraa Lake) |
|
St3 |
Site 3 (Tigris River Opposite Abu Nuwas Corniche) |
|
Temp |
Temperature (Physicochemical Parameter) |
|
TDS |
Total Dissolved Solids (Physicochemical Parameter) |
|
1−D |
Simpson's Index of Diversity (Diversity Index) |
|
mg/L |
Milligrams per Liter (Unit of Concentration) |
|
μm |
Micrometer (Unit for Mesh Size) |
|
℃ |
Degrees Celsius (Unit for Temperature) |
[1] Sime-Ngando, T., Lefevre, E., Gleason, F.H. (2011). Hidden diversity among aquatic heterotrophic flagellates: Ecological potentials of zoosporic fungi. Hydrobiologia, 659: 5-22. https://doi.org/10.1007/s10750-010-0230-y
[2] Sangwan, S., Kumar, M., Lamba, R., Singh, S., Kumari, A., Wati, L. (2024). Bioindicators: Natural biotic sensors of environmental pollution and ecological disturbance. In Environmental Nexus Approach, pp. 311-337.
[3] Ali, A., Zhong, X., Xu, G., Xu, H. (2025). Insights into effects of salinity stress on the body-size spectrum of periphytic protozoan fauna in marine ecosystems. Continental Shelf Research, 295: 105575. https://doi.org/10.1016/j.csr.2025.105575
[4] Von Schneidemesser, E., Monks, P.S., Allan, J.D., Bruhwiler, L., et al. (2015). Chemistry and the linkages between air quality and climate change. Chemical Reviews, 115(10): 3856-3897. https://doi.org/10.1021/acs.chemrev.5b00089
[5] Shahid, N., Siddique, A., Liess, M. (2024). Synergistic interaction between a toxicant and food stress is further exacerbated by temperature. Environmental Pollution, 363: 125109. https://doi.org/10.1016/j.envpol.2024.125109
[6] Hu, H., Li, S., Wang, C. (2025). Sulfur cycle-associated microbial community and functional gene network modulation by vermicompost amendment of saline-alkali soils. Pedosphere. https://doi.org/10.1016/j.pedsph.2025.04.005
[7] He, L., Shen, J., Zhang, Y. (2018). Ecological vulnerability assessment for ecological conservation and environmental management. Journal of Environmental Management, 206: 1115-1125. https://doi.org/10.1016/j.jenvman.2017.11.059
[8] Vishal, V.S. (2024). Seasonal variations in the performance of the Amberpet wastewater treatment plant: Assessing the impact of temperature and dissolved oxygen. International Institute of Information Technology, Hyderabad. Master's thesis. Deemed to be University.
[9] Watkins, S. (2011). Physico-chemical and microbial factors affecting the operation of a package wastewater treatment plant. Doctoral dissertation. University of Portsmouth.
[10] Klaysom, C., Cath, T.Y., Depuydt, T., Vankelecom, I.F. (2013). Forward and pressure retarded osmosis: Potential solutions for global challenges in energy and water supply. Chemical Society Reviews, 42(16): 6959-6989. https://doi.org/10.1039/C3CS60051C
[11] Bhagowati, B. (2024). A study on lake eutrophication dynamics and management through data-driven modelling. Doctoral dissertation. Tezpur University.
[12] Willkomm, M. (2007). Studies on the dynamics of heterotrophic flagellates on biofilm communities. Doctoral dissertation. Universität zu Köln.
[13] Xu, C., Wang, Z., Li, Z., Wang, L., Han, G. (2019). Grazing intensity and climate factors shape species abundance distribution by influencing different components of plant communities in a desert steppe. Ecological Research, 34(6): 730-742. https://doi.org/10.1111/1440-1703.12047
[14] Zedler, J.B., Kercher, S. (2005). Wetland resources: Status, trends, ecosystem services, and restorability. Annual Review of Environment and Resources, 30: 39-74. https://doi.org/10.1146/annurev.energy.30.050504.144248
[15] Chen, Z., Zhang, T., Zhang, Z., Yue, L., Cui, J., Zhang, J., Zhou, S., Chai, B. (2024). Assembly mechanisms and driving factors of aerobic denitrifying bacteria community with different seasons and rarity in the sediments of Baiyangdian Lake. Journal of Soils and Sediments, 24(4): 1838-1853. https://doi.org/10.1007/s11368-023-03615-7
[16] Parkinson, E. (2022). Investigating physiological markers of heat stress in response to water temperature in kākahi (Echyridella menziesii) to provide insight into their vulnerability to anthropogenic climate change: A thesis presented in partial fulfilment of the requirements for the degree of Master of Science in Physiology, Massey University, Palmerston North, New Zealand. Doctoral dissertation. Massey University.
[17] Chapin III, F.S., Walker, B.H., Hobbs, R.J., Hooper, D.U., Lawton, J.H., Sala, O.E., Tilman, D. (1997). Biotic control over the functioning of ecosystems. Science, 277(5325): 500-504. https://doi.org/10.1126/science.277.5325.500
[18] Foissner, W. (2016). Protists as bioindicators in freshwater ecosystems: Guidelines for ecological assessment. European Journal of Protistology, 55: 75-95. https://doi.org/10.1016/j.ejop.2016.02.004
[19] Gustin, M.S. (2020). Dedication of STOTEN special issue: Recent advances in mercury research to Dr. Grant Carleton Edwards. Science of the Total Environment, 738: 138785. https://doi.org/10.1016/j.scitotenv.2020.138785
[20] Patin, N.V., Locklear, S., Stewart, F.J., Lopanik, N.B. (2019). Symbiont frequency predicts microbiome composition in a model bryozoan-bacterial symbiosis. Aquatic Microbial Ecology, 83(1): 1-13. https://doi.org/10.3354/ame01901