Alyaa SH. Oleiwi*![]() | Ala Hassan Nama
| Ala Hassan Nama![]() | Mahmood Abdulameer Al-Saadi
| Mahmood Abdulameer Al-Saadi![]() | Rana Abdel Qader Saleh
| Rana Abdel Qader Saleh![]() | Mudhar A. Al-Obaidi
| Mudhar A. Al-Obaidi![]() | Alhassan H. Ismail
| Alhassan H. Ismail![]() | Ahmed M. D. Al Ketife
| Ahmed M. D. Al Ketife![]()
© 2025 The authors. This article is published by IIETA and is licensed under the CC BY 4.0 license (http://creativecommons.org/licenses/by/4.0/).
OPEN ACCESS
This study provides a comprehensive review of the temporal and spatial dynamics of water quality in the Euphrates River in Iraq. Rivers around the world suffer from massive changes in the quantity and quality of water. These changes are due to climate change, population increase, and the dumping of untreated waste into these rivers. In Iraq, the severe water quality change in the Euphrates River during the last 40 years intensified the need for this review. This review paper is conducted using a systematic search strategy covering research publications from 1983 to 2024 through major scientific databases. The Euphrates River's spatio-temporal dynamics are described by analysing results from over 50 high-impact studies in the final synthesis. The review highlights critical spatial patterns that show pronounced patterns of downstream increase in salinity, often rising from an average of 700 mg/L at the Iraqi entry point to over 1500 mg/L near the Samawah region in the southern part of Iraq. The main source of revenue is agricultural drainage return flows. Furthermore, intermediate cities are found to have significant pollution hotspots because of the high levels of nutrients and heavy metals. The study recommends that policy release actions be taken immediately to mandate closed-loop irrigation flow systems, which would regulate salinity, nutrients, and heavy metal loading due to the identified critical drivers.
Euphrates River, water quality assessment, spatiotemporal analysis, hydrochemistry, heavy metals, sustainable water management, Iraq
Quality of river water has a considerable role in aiding both natural ecosystems and human consumption. Rivers can supply water for different purposes including drinking, agriculture, and industry sectors. However, the quality of surface water can be directly affected by chemical, physical, and biological processes, that basically elucidated a vital environmental concern [1]. Particularly, controlling pollutant concentrations along rivers is a vital task to preserve the acceptable quality of surface water [2].
Since the early 21st century, the progress of hydrological research has been quite clear in covering the associated concerns of water scarcity [3, 4]. Notably, the research indicated both seasonal and spatial variations in ion concentrations. Accordingly, the quality of surface water was passively affected along over time as a result to various natural and anthropogenic parameters, principally uncontrolled releases of toxic and industrial wastewater [5-8].
The Euphrates River, one of Iraq’s main water sources, has been increasingly affected by natural and anthropogenic pollution, releasing ecological and public health hazards. Also, there is a clear reduction in the Euphrates River’s flow due to climate change, particularly characterized by increased water temperature. Also, the volume of water reaching Iraq has been drastically reduced as a result of dam construction in upstream countries, principally Turkey and Syria [6]. Thus, the deprivation of water quality has typically happened downstream, where toxic discharges accumulate over long distances. In other words, the complicated hydro geochemical processes such as the dissolution of salts from regional evaporate formations can drive the quality of river's water. Also, irrigation return flows and untreated sewage can negatively impact the alter the natural self-purification ability of the river, as a result to impacting pollutant immigration and transformed patterns that lead to remarkable ecological impacts in the downstream reaches [9].
Several colleagues focused on studying the subject of water quality in Iraqi rivers besides analysing the possible pollution of heavy metals. As an example, Al-Sarraj et al. [10] introduced a detailed review to analyse water quality, sediment, and fish tissues, in addition to specifying heavy metals like cadmium, mercury, lead, arsenic, and chromium. This review investigated the limited epidemiological research on human health effects, with a lack of thorough assessment of pollution sources, besides inadequate seasonal or spatial analysis of metal distributions. Muslim et al. [11] inspected the environmental geochemistry of the Euphrates River from Al-Qaim to Basrah, signifying variations in sediment quality and particularly ion composition. However, this review did not comprehensively address the seasonal and spatial variation analyses. To resolve this issue in the open literature, the current review aims to fill this gap by introducing a systematic review on the Euphrates River to explore spatial and temporal variations in a broad set of hydrochemical indicators throughout the tested period between 2000 to 2025.
Previous literature reviews often gave descriptive summaries that were limited to specific temporal or spatial areas, failing to capture the complete dynamics needed for effective management. The current study is designed as a systematic review to critically analyse and synthesize the associated results of fifty selected relevant studies that focused on spatiotemporal variations and gradients across the entire Iraqi stretch of the Euphrates River. In turn, this would deliver a quantitative description of the complicated interaction of hydrological, geological, and anthropogenic parameters. Furthermore, this review emphasizes presenting background knowledge of water quality dynamics in the Iraqi Euphrates River. In this regard, three objectives are systematically directed as follows: 1) To quantify the gradients of water quality parameters (salinity, nutrients, and heavy metals) across time and space across the stretch of the Euphrates River entire Iraqi; 2) To identify, characterize, and attribute the major pollution sources and evaluate their relative contributions across different river sections, such as the upstream, middle, and downstream reaches in Iraq; 3) To evaluate the methodological flaws and weaknesses of existing research and recommend high-priority research avenues for next projects in water quality modeling and management.
1.1 Regional analysis
Geographical variability- urban versus rural areas: Urban areas often face contamination as a result of industrial waste, untreated sewage, and overpopulation, while rural areas face issues related to agricultural runoff, lack of sanitation facilities, and poor water infrastructure. Regional Differences: Water quality varies across regions, such as it has been observed that there is a relative increase in the content of the cadmium, copper, and chromium in the sites located in the downstream at Al-Qaim, below Al-shallal area and the disposal of liquid industrial wastes from the phosphate chemical complex, relative to its concentration when entering the Euphrates River, the Iraqi-Syrian border at Rummana [12, 13].
1.2 Location of the study area
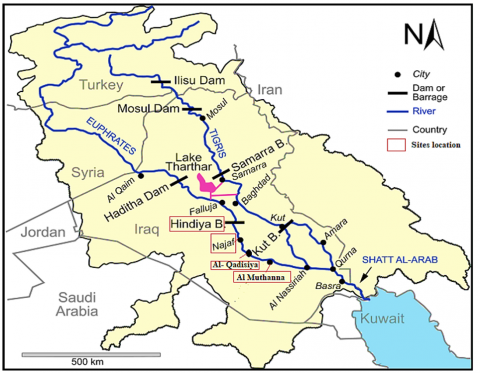
The Euphrates River originates from Turkish territory. It flows through Syria before entering Iraq at the Al-Qaim district. It has a total length of approximately 2,800 kilometers. The river basin spans multiple climatic zones, ranging from Mediterranean conditions in the upper basin to arid desert-like climates downstream. In the upper regions, rainfall and snowmelt contribute to high annual precipitation levels of up to 1,500 mm, while the lower parts receive as little as 60 mm per year [14]. After entering Iraq, the Euphrates flows southeastward through key cities and provinces, including Haditha, Hit, Ramadi (Anbar), Fallujah, Babylon, Karbala, Najaf, Diwaniyah, Samawah, and Nasiriyah, before joining the Tigris River at Al-Qurna in the Basrah Governorate, as shown in Figure 1.
Figure 1. Location of the Euphrates River
The discharge of the Euphrates River has experienced a substantial fluctuation throughout the past decades, which was compelled by both natural and anthropogenic parameters [15]. The average annual discharge of the Euphrates River varied between 30 and 40 billion m3 before the year 2000, which supports drinking water supply, agriculture, and industries [16]. However, a visible decrease in the average flow rate was observed between 2000 and 2010, where it reaches between 20–25 billion m3 per year. The rationale behind this deterioration of water flow rate can be ascribed to the upstream dam construction in Turkey and Syria, mainly the Atatürk and Tishrin Dams, besides the progressive consumption of water for different purposes, including drinking, irrigation, and industry [17, 18]. Furthermore, the assigned reduction of flow rate kept going during the period between 2010 to 2025, which reached annual volumes between 12 and 18 billion cubic meters as elucidated in Figure 2. The ongoing decline of water flow rate in the Euphrates River has been further worsened by prolonged droughts, decreased rainfall because of climate change, increased temperatures, and unregulated water withdrawals [12, 19].
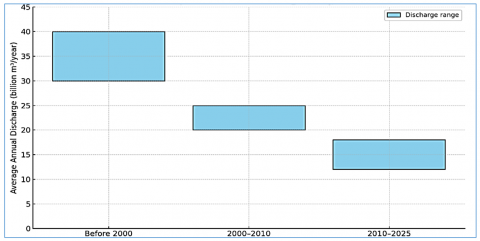
Figure 2. Temporal decline in the annual discharge of the Euphrates River in Iraq
1.3 Geological setting of the Euphrates River in the study area
Various geological formations are found along the Euphrates River in the current reach of the study, reflecting the river's passage through different sedimentary environments. In the Al-Qa’im region, geology is dominated by stable sedimentary rocks dating from the Cretaceous to the Tertiary periods, mainly comprising limestone, marl, and dolomite [15].
Downstream from Haditha to Al-Ramadi, the geological formations transition into younger sedimentary layers, primarily Miocene in age, which are interspersed with Quaternary alluvial deposits near the riverbanks. The river flows through a central alluvial plain between Ramadi and Fallujah, characterised by wide-ranging Quaternary deposits, comprising silts, clays, and sands. However, the Euphrates traverses the Mesopotamian Basin from Fallujah to Babil, where a foredeep basin is constituted by the collision between the Arabian and Eurasian tectonic plates.
The Euphrates River is covered by floodplain sediments in the Babylon area, with accumulative sandy deposits associated with the Al-Dibdiba formation in the Karbala region. The primary geological units consist of Quaternary deposits, limestone and dolomite of carbonate rocks, and finely cemented sandy layers. Towards the south from Samawah in Al-Muthanna Governorate to Basrah, just before the confluence with the Shatt al-Arab, the region’s geology entirely comprises sedimentary rocks from the Cenozoic Era, ranging from the Early Eocene to the Quaternary period [15].
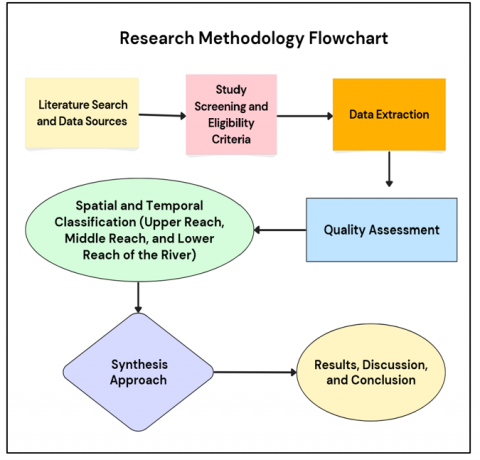
The current intention of this paper is to conduct a systematic review to appraise the spatial growth of water quality along the Euphrates River utilising a transparent, reproducible, and operational framework. Specifically, the used methodology consisted of the philosophies of PRISMA, to ensure precision in study documentation, screening, suitability evaluation, and final included studies. The workflow of the systematic review is shown in Figure 3.
Figure 3. The flow chart of the systematic review
2.1 Literature search and data sources
A comprehensive search was conducted across the main international databases: Scopus, Web of Science, ScienceDirect, and Google Scholar, supplemented by journals of Iraqi academic institutions, governmental reports, and postgraduate theses. The search covered the period 1983–2025, allowing the identification of long-term hydrochemical variation and shifting pollution drivers across the catchment area. Search terms contained combinations of “Euphrates River”, “water quality”, “salinity”, “nutrients”, “heavy metals”, and “hydrochemistry”.
2.2 Study screening and eligibility criteria
Studies were required to adhere to the following requirements in order to be included: 1. document quantitative water quality measurements; 2. be carried out within the Iraqi stretch of the Euphrates River; 3. be reviewed or provide validated institutional reports; and 4. focus on the hydrochemical, physical, or biological water quality indicator. Several exclusion criteria were rejected: non-peer-reviewed materials without data that can be verified, studies beyond the geographic area, and articles without quantitative measures. More than fifty studies met the eligibility criterion during the screening procedure.
2.3 Data extraction
To guarantee uniformity throughout all examined materials, a consistent data extraction form was created. The extracted variables included:
• Study sampling sites, coordinates, and time periods of evidence collection,
• Measurement and evaluation approaches,
• Hydrochemical parameters of nutrients, total dissolved solids (TDS), electrical conductivity (EC), key ions, and heavy metals,
• The availability varies season (high and low flow conditions),
• Recognized pollution reasons.
Accordingly, this systematic extraction would enable a consistent cross-sectional contrast.
2.4 Quality assessment
Each study experienced a quality evaluation based on the following aspects:
A number of studies were degraded due to insufficient sampling frequency or utilising a confused analytical approach.
2.5 Spatial and temporal classification
The Iraqi portion of the Euphrates River was divided into three hydrologically sections: 1. Central Reach: Babil to Najaf (agriculturally active and heavily populated corridor); 2. Lower Reach: Diwaniyah to Basrah (an increased salinity region that is impacted by drainage return flows); 3. Upper Reach: Al-Qaim to Fallujah (relatively low salinity and insignificant urban influence). To recognize long-term patterns, the temporal domain was split into four periods: before 2000, 2000–2010, 2010–2020, and 2020–2025. These five years received notable attention as a result of increased water quality monitoring research.
2.6 Synthesis approach
Because of the differences in measurement techniques, indicators, and temporal coverage, a narrative-based synthesis methodology was used in place of conventional meta-analysis. Through cross-comparison across river segments and time intervals, spatial and temporal patterns were assessed, allowing for an easy interpretation of pollution dynamics, salinity increase, enrichment in nutrients, and heavy metals accumulation.
The main chemical parameters are discussed in the following section with a complete analysis to identify key pollution sources along the river stretch within Iraqi territory. The spatial analysis covers the river from its entry point at Al-Qaim, continuing through central provinces including Al-Anbar, where major cities such as Haditha, Anah, Hit, Ramadi, and Fallujah are located, then through Babil (including Al-Hilla and Al-Hindiya), Karbala, Najaf, and Al-Diwaniya, before reaching the southern provinces around Al-Samawah, Al-Nasiriyah, and finally Al-Qurna and Basrah. The hydrochemical parameters of the Euphrates River of cations (Ca²+, Mg²+, Na+, K+), anions (SO4-2, Cl-, HCO3-, CO3-2, NO3-, PO4-3) are appraised during the period from 1983 to 2025. Also, the major physical parameters of EC, TDS, chemical oxygen demand (COD), biological oxygen demand (BOD5), dissolved oxygen (DO), temperature, turbidity, and pH are also thoroughly examined. Moreover, the indicators of bacterial contamination, boron, hydrogen sulfide, radioactivity isotopes, and heavy metals concentrations are assessed to deliver a detailed assessment of water quality across different segments of the river.
3.1 Upper reach of the Euphrates River
The hydrochemical features of the Euphrates River within Al-Anbar governorate have been extensively considered across multiple stations such as Al-Qaim, Anah, Haditha, Hit, Ramadi, and Fallujah. Few studies have assessed the effect of flow rate (Flow Rate). Study [20] focuses on the Euphrates River Salinity Concentrations in Al-Qaim governorate with 3 stations. Salinity increases in seasons when release from Turkey and Syria decreases, especially in summer periods or when dams are operating. The variables most sensitive to flow change were EC, TDS, and chloride ions (Table 1). Flow decreases below a certain level; salinity rises to values unsuitable for agricultural uses. The study confirms that the biggest cause of increased salinity is low water intake, not just pollution.
Table 1. Water quality parameters from Al-Qaim to Fallujah based on study [20]
|
Station |
EC (µS/cm) |
TDS (mg/L) |
Cl⁻ (mg/L) |
SO₄²⁻ (mg/L) |
Na⁺ (mg/L) |
|
ST.1 |
850 |
540 |
65 |
110 |
70 |
|
ST.2 |
1500 |
940 |
120 |
190 |
135 |
|
ST.3 |
2800 |
1750 |
240 |
330 |
260 |
Spatial and seasonal disparities were obvious, with a clear shift from specific elements of Na–Ca–Mg–Cl–SO₄ during high flow to prevailing specific elements of Na–Ca–Mg–HCO₃–SO₄–Cl during low flow, which indicates superior rock-water interactions and reduced dilution during drought [21]. The research delivers a detailed review of the environmental characteristics of the Euphrates River within Anbar Governorate. The study indicated that reduced river flow, especially during dry periods, has led to higher salinity, TDS, and concentrations of major ions such as Cl⁻, SO₄²⁻, Na⁺, Ca²⁺, and Mg²⁺. Human activities, including agricultural runoff, sewage discharge, and fertilizer use, further exacerbate degradation of water quality.
A gap in water quality studies along the Euphrates River within Al-Anbar Province for the period 1989-2002 was noticed. Then, research [22] measured physical and chemical parameters at various stations along the Euphrates River at Al-Haqlania (near Al-Qaim and 11 km downstream of Haditha Dam), Al-Baghdadi, Hit, and U/S Al-Ramadi Barrage. Table 2 shows the results of the measured parameters.
Table 2. Physical and chemical water quality parameters for Al-Haqlania, Al-Baghdadi, Hit, and U/S Al-Ramadi Barrage based on study [22]
|
Stations |
pH |
EC in µS/cm |
DO in mg/L |
Total Suspended Solids (TSS) in mg/L |
|
Al-Haqlania |
8.2 |
1,040 |
6.8 |
40 |
|
Al-Baghdadi |
8.1 |
1,090 |
6.4 |
42 |
|
Hit |
8.2 |
1,120 |
6.5 |
48 |
|
U/S Al-Ramadi Barrage |
7.8 |
1,015 |
6.5 |
56 |
|
Range |
7.8 to 8.2 |
1,015 to 1,120 |
6.4 and 6.8 |
40 to56 |
|
Average |
8.1 |
1,066 |
6.55 |
46.5 |
In the last twenty years, many studies have assessed the water quality and checked the suitability for drinking along the Euphrates River within Al-Anbar Province using field measurements and/ or water quality index (WQI). Al Bomola [23] monitored the river from 2006 to 2010 and measured the water quality parameters at four main monitoring stations in Anbar Al Qaim, Haditha, Ramadi, and Fallujah stations. Water quality parameters were measured in the same four stations, and the trend WQI was calculated for the Euphrates River stations in Al-Anbar Province by Alsaqqar [24]. Spatial and temporal variations in water quality of the Euphrates River for the period 2004-2010 were studied by Satam et al. [25]. The study focused on analysing the physical and chemical properties of the Euphrates River water at four main monitoring stations in Anbar. Al Bomola [23] monitored the river from 2006-2010 and observed pH ranging from 7.0 to 8.4, EC between 400 and 1200 µS/cm, TDS from 300 to 1100 mg/L, DO fluctuating 4.0 to 8.5 mg/L, calcium 30 to 110 mg/L, magnesium 10 to 60 mg/L, chloride 40 to 200 mg/L, sulfate 90 to 250 mg/L, nitrate 5 to 35 mg/L, and phosphate 0.3 to 2.5 mg/L. While PH values ranged from 6.8 at Al-Qaim to 8.2 at Fallujah [24].
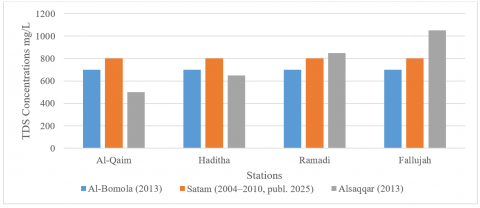
The range of pH values was extended between 6.5 and 8.5 by Satam et al. [25]. TDS was measured in four stations: Al Qaim, Haditha, Ramadi, and Fallujah stations by studies [23-25]. Variation in TDS along the Euphrates River within Al-Anbar Province (Figure 4).
Figure 4. Temporal variation of TDS concentration (mg/L) within Al-Anbar province based on studies [23-25]
The spatial and seasonal variation of EC was approved by Satam et al. [25] who indicated that its range between 566 µS/cm at Al-Qaim to 855 µS/cm at Fallujah. In this regard, a range between 700 and 1050 mg/L was elucidated for the TDS (Figure 4), with a clear rise near urban and agricultural regions. Also, the nitrate concentration was varied between 11 to 38 mg/L, where the greatest levels were registered at Ramadi, proposing the effects of agricultural runoff. In the same trend, the chloride and sulfate concentrations ranged between 109 and 271 mg/L and 52 to 190 mg/L, respectively, with a clear peaking point at the Fallujah region due to inflows from nearby reservoirs. Furthermore, the total hardness ranged between 200 and 600 mg/L, with the maximum values observed in regions with agricultural and industrial practices. The Al Ramadi region has experienced the greatest values of calcium and magnesium, which between from 40 to 120 mg/L and 15 to 60 mg/L, respectively. Lastly, Fallujah city registered the greatest phosphate concentrations, which range between 0.5 and 2.5 mg/L, probably as a result of extensive agricultural deposits.
Hasham and Ramal [26] focused on analyzing the concentrations of heavy metals at different stations along the Euphrates River within Fallujah city. The main focus was to elucidate the concentrations of mercury, lead, nickel, cadmium, and chromium, as they represented the main dangerous heavy metals. The findings elucidated a clear variation of heavy metals across stations. For instance, cadmium was varied between 0.002 and 0.01 mg/L, chromium was varied between 0.01 to 0.04 mg/L, lead was varied between 0.05 to 0.18 mg/L, and mercury was detected below 0.005 mg/L. Referring to these findings, it was stated that the progressive heavy metal concentrations can interpret the reason behind the deterioration of water quality. Indeed, the water quality was negatively affected by urban runoff, industrial wastewaters, and agricultural activities.
The impact of climate change on water quality factors of the Euphrates River during 2021 was investigated by Al-Ali and Al-Dabbas [27], who particularly emphasized on Haditha station to al-Handiya. The main focus was to determine the levels of both organic and inorganic contaminants. The results ascertained that water salinity ranged between 1.2 to 2.3 ppt, which indicated an increase in salt content linked to mitigated rainfall levels. In this regard, the TDS levels were specified to be between 1100 and 2100 mg/L, representing an increased dissolved mineral in the targeted water. The associated EC values were varied between 1800 and 3500 µS/cm, which definitely merge moderate to high-salinity concentrations. 15℃ and 30℃ was the detected range of water temperature due to variable seasons. Moreover, the phosphates and nitrates metals were augmented as a result of continuous drought periods, which implies dangerous pressure from climate change.
The assessment of the hydrochemical features of the Euphrates River water in the Haditha region was the intention of Al-Kubaisi and Al-Sumaidai [28]. The researchers analyzed a number of physical and chemical factors, such as the pH, TDS, EC, anions of sulfate and chloride, and associated cations of calcium, sodium, potassium, and magnesium. The results ascertained a range of pH between 7.4 to 8.1, which reflected an alkaline water property. TDS levels were varied between 250 and 420 mg/L, which mirrored the good quality of river water. EC varied between 400 and 650 µS/cm, which indicates low to moderate salinity levels. Magnesium was varied between 20 and 35 mg/L, calcium was varied between 40 to 65 mg/L, sodium was varied between 25 to 45 mg/L, chloride was varied between 50 and 90 mg/L, potassium was varied between 2.5 to 5 mg/L, and sulfate was varied between 70 to 110 mg/L. Following the obtained results, the researchers endorsed that the water quality in the Haditha section of the Euphrates River is commonly good and appropriate for agricultural and irrigation purposes.
Alrawi et al. [29] concentrated on evaluating the hydro-chemical quality of water in the Haditha Reservoir, which signifies an extraordinary part of the Euphrates River system. In this research, nine physical parameters of the pH, EC, total suspended solids (TSS), sodium, calcium, chloride, sulfate, potassium, and magnesium were tested during the period between 2023-2024. The results indicated a slightly to neutral alkaline water where pH ranges between 7.3 to 7.9. EC was estimated between 380 and 620 µS/cm, representing low to moderate salinity levels. This specifically reflects a TDS range of 15 to 45 mg/L, which suggests moderate matter content. Furthermore, the calcium concentration was varied between 38 to 60 mg/L, magnesium between 18 to 33 mg/L, sodium between 22 and 42 mg/L, potassium between 2.2 to 4.8 mg/L, chloride between 48 and 88 mg/L, and sulfate between 65 to 105 mg/L. These chemical measurements can be considered within allowable irrigation limits, notwithstanding the mid-range of pH values. Thus, it can be said that the Haditha Reservoir's water quality can fit the agricultural use. However, a consistent assessment is required to avoid potential future degradation. After 2020, most studies moved away from studying all stations within Al-Anbar Province and focused on one or more stations. In addition, studies were moved away from measurements at the Al-Qaim station (Table 3).
Table 3. TDS concentration (mg/L) within Al-Anbar Province based on several published studies
|
Station |
[26] |
[27] |
[28] |
[29] |
|
Al-Qaim |
||||
|
Haditha |
1600 |
335 |
990 |
|
|
Hit |
982 |
|||
|
Ramadi |
982 |
|||
|
Fallujah |
950 |
Apparently, calcium concentrations varied between 40–60 mg/L at Al-Qaim to 90–120 mg/L at Fallujah. An increase was shown in magnesium levels from 15–30 mg/L at Al-Qaim to 45–65 mg/L at Fallujah. Chloride concentrations rose from 50–90 mg/L at Al-Qaim to 150–190 mg/L at Fallujah. Sulfate levels ranged from 100–160 mg/L at Al-Qaim to 210–280 mg/L at Fallujah. Nitrate concentrations varied from 10–20 mg/L at Al-Qaim to 30–38 mg/L at Fallujah. Finally, phosphate concentrations range from 0.5–1.2 mg/L at Al-Qaim to 2.0–3.0 mg/L at Fallujah. The WQI values for the Euphrates River stations in Al-Anbar Province showed a clear spatial trend of declining water quality downstream. At Al-Qaim, the physical testes ascertained moderate to poor water quality, where WQI was varied between 80 to 95. However, the WQI increases from 90 to 105 while moving downstream to Haditha. This is considered poor to very poor water quality. Consequently, WQI changes between 100 and 110 further along at Ramadi, which signified poor to very poor water quality. The greatest WQI values were registered at Fallujah, where they varied between 110 to 120. This, in turn, determines very poor water quality for drinking purposes.
Close to Amiriyah, Fallujah, Salah et al. [30] reported a noticeable increase in heavy metals. Specifically, chromium was varied between 0.02–0.08 mg/L, iron was varied between 0.3–1.5 mg/L, cadmium was varied between 0.01–0.05 mg/L, lead was varied between 0.005–0.02 mg/L, and nickel was varied between 0.01–0.04 mg/L. Referring to these results, the researchers stated that the detected heavy metals exceeded the WHO constraints, which can be attributed to urban and industrial pollution.
Al-Heety et al. [31] focused on analysing the water quality of the Euphrates River at Ramadi station. To systematically attain this aim, the researchers conducted several chemical, physical, and microbiological measurements. The findings elucidated that turbidity varied between 4 to 25 NTU, which presented evidence of polluted water close to disposal points. pH values were varied between 7.2 and 8, while water temperature was varied between 14℃ to 32℃. Also, DO was varied between 4.5 and 7.5 mg/L, while phosphate and nitrate were detected between 0.2 and 2.9 mg/L and 0.8 to 5.0 mg/L, respectively. Referring to the measurements of heavy metals, permitted levels of cadmium and lead were registered at 0.2 to 1.3 µg/L and 3 to 10 µg/L, respectively. The researchers also detected that total coliform counts and fecal coliforms ranged between 1,200 to 15,000 MPN/100 ml, and 900 and 12,000 MPN/100 ml, respectively, via a specific microbiological test. Indeed, this elaborated primarily on pollution attributed to untreated sewage disposed of at Ramadi station.
Manea et al. [32] evaluated the water quality of the Euphrates River in the Al-Qaim area, focusing on conducting a set of physical, chemical, and microbiological tests, throughout the period between 2019-2020. The findings stated a pH range of 7.3 and 8.0, and 13℃ to 30℃ of water temperature. The researchers ascertained a lower pollution rate in the Al-Qaim region compared to urban centers due to low investigated turbidity values between 3 to 12 NTU. Furthermore, it was noted that DO levels ranged between 5.5 to 7.8 mg/L. Phosphate and nitrate levels ranged between 0.18 to 1.5 mg/L and 0.9 to 3.2 mg/L, respectively. The total coliform counts and fecal coliform counts ranged between 800 to 7,500 MPN/100 ml, and between 600 to 6,000 MPN/100 ml, respectively, which denoted moderate microbial pollution.
Few studies have assessed the level of water stress in the Tigris and Euphrates basin [33]. The researchers elucidated that a range of water temperatures focused on determining the extent of the influence of human factors. The study used spatial data and a statistical model called the Geographical Detector Model (GDM) to determine which of these factors most influence water stress. The study proved that human factors, not just climate, are the most important reason for the 66% increase in water stress in the Tigris and Euphrates, especially agricultural, economic, and urban expansion. suggests that water stress can be reduced by improving the management of these human activities.
Another investigation of the water quality of the Euphrates River in the city of Hit was conducted by Ahmed et al. [34] by measuring the WQI. During the period between 2020–2021, the water samples were gathered from five stations, besides analyzing the main physicochemical parameters of pH, turbidity, temperature, sodium, calcium, nitrate, sulfate, magnesium, EC, and TDS. The results indicated very poor water quality, as the average WQI value was 110.156. In this aspect, the seasonal variation of WQI indicated a range between 97.85 in June to 121.75 in November. The increased TDS and magnesium due to anthropogenic activities along the riverbanks can be attributed to the poor water quality of the Euphrates River in the city of Hit. Subsequently, the significance of using perfect water quality practice suggested the need to deploy an active control technique to improve water safety.
Al-Ali and Al-Dabbas [35] tested the physical, chemical, and microbiological indicators of the Euphrates River water around Ramadi. In this regard, the pH, COD, DO, biochemical oxygen demand (BOD5), total coliform bacteria, and heavy metals concentrations were under focus. The results ascertained neutral alkaline water where the pH ranged between 6.8 to 7.6. COD also ranged between 12 to 55 mg/L. DO ranged between 3.5 and 7.0 mg/L, and BOD ranged between 4 and 18 mg/L. Furthermore, the total coliform ranged between 1,000 to 800,000 CFU/100 ml. Referring to the heavy metals measurements, lead, nickel, and cadmium were detected over the allowed concentrations, which was ascribed to the disposal of domestic sewage and industrial wastewater. Therefore, a clear impact of microbial and chemical pollutants was demonstrated on water quality of the Euphrates River in the Ramadi area.
While considering the analysis of major cations and heavy metals, Al-Alawy et al. [36] conducted specific research to evaluate the water quality of the Euphrates River in the Anbar area. The concentrations of cations were found as follows: sodium ranged between 20 and 50 mg/L (average ~35 mg/L), potassium between 3 and 7 mg/L (~5 mg/L), calcium between 40 and 70 mg/L (~55 mg/L), and magnesium between 15 and 30 mg/L (~22 mg/L). Heavy metal concentrations were generally within permissible limits, with lead ranging from 0.01 to 0.04 mg/L (average 0.025 mg/L), cadmium from 0.001 to 0.01 mg/L (average 0.006 mg/L), chromium from 0.005 to 0.02 mg/L (average 0.013 mg/L), nickel from 0.01 to 0.03 mg/L (average 0.02 mg/L), and iron from 0.1 to 0.5 mg/L (average 0.3 mg/L).
Taha et al. [37] inspected the water quality of six stations between Al-Qaim and Fallujah (Iraq) to specifically inspect the bacterial pollution of the Euphrates River. The main aim was to allocate the actual concentrations of total coliforms (TC) and fecal coliforms (FC) as considerable metrics of microbial pollution. Bacterial counts surpassed the WHO and Iraqi criteria in the majority of test sites, particularly in the urban centers of Ramadi and Fallujah. The highest pollution level was observed at Fallujah, where untreated municipal and domestic wastewater was discharged directly into the river. The highest bacterial concentrations were also noted during summer, which can be attributed to lessened water levels at raised water temperatures.
Oleiwi and Al-Dabbas [38] conducted specific research to evaluate the water quality Euphrates River at five stations of Al-Anbar Governorate: Al-Qaim, a site south of Al-Qaim, Rutba, a site near Hit, and a location near the river’s downstream reach within Al-Anbar, while determining the hydro-chemical parameters of the water. The findings showed that the magnesium, calcium, and sodium concentrations were varied between 14.2 and 22.1 mg/L, 44.2 to 54.3 mg/L, and 27.5 to 37.1 mg/L, respectively. Also, the potassium varied between 3.3 to 4.5 mg/L. Regarding anions, chloride levels varied from 59.2 to 65.7 mg/L, with an average of 62.46 mg/L; sulfate ranged between 41.8 and 51.3 mg/L, averaging 46.6 mg/L; and bicarbonate concentrations fell between 142.3 and 162.5 mg/L, with a mean of 153.1 mg/L. The pH levels, which ranged from 7.3 to 7.4 with an average of 7.32, were continuously constant. Turbidity levels varied from 7.3 to 9.2 NTU, with an overall mean of 8.28 NTU, while EC values varied between 901 to 1040 µS/cm, with 982.2 µS/cm. The results obtained demonstrate that the water in most of those locations under investigation is saline and somewhat alkaline, with comparatively low turbidity.
3.2 Central reach of the Euphrates River
Throughout the previous three decades, several water quality investigations of the Euphrates River, predominantly its middle and southern reaches in Iraq, were published in the public domain. This review synthesizes available studies from the early 1990s to 2025, presenting a detailed comparison of hydrochemical parameters, seasonal variations, and anthropogenic impacts, with a focus on the river segments from Babil (Table 4 and Figure 5).
Table 4. A summary of water quality parameters at Babil Stations between 1996–2025
|
Research |
Study Period |
Parameters with Range |
|
[39] |
2010-2014 |
EC: 1160–1860 µS/cm; TDS: 730–1190 mg/L; Ca²⁺: 50–126 mg/L; Mg²⁺: 22–40 mg/L; Na⁺: 90–150 mg/L; Cl⁻: 95–150 mg/L; SO₄²⁻: 110–230 mg/L |
|
[40] |
2010–2020 |
pH: 7.2–8.1; EC: 500–1,200 µS/cm; Ca²⁺: 40–90 mg/L; Mg²⁺: 15–45 mg/L; Na⁺: 30–80 mg/L; Cl⁻: 50–150 mg/L; SO₄²⁻: 40–130 mg/L |
|
[41] |
2010–2020 |
Temp: 18–34℃; pH: 7.3–8.0; EC: 1,050–1,450 µS/cm; TDS: 700–1,100 mg/L; DO: 4.5–8.2 mg/L; BOD: 1.2–8.0 mg/L; NO₃⁻: 1.5–6.2 mg/L; PO₄³⁻: 0.05–0.4 mg/L |
|
[42] |
2020–2025 |
pH: 6.8–7.9; EC: 900–1,350 µS/cm; TDS: 550–980 mg/L; DO: 4.8–7.5 mg/L/, increasing in Cd, Pb, Zn, Cu |
|
[43] |
2020–2025 |
NO₃⁻: 4.0–15 mg/L; PO₄³⁻: 0.05–0.6 mg/L; Cd: 0.010 mg/L |
|
[44] |
2020–2025 |
pH: 7.1–8.4; EC: 900–1,500 µS/cm; TDS: 600–1,100 mg/L; DO: 4.8–8.3 mg/L; Pb: 0.006–0.042 mg/L; Cd: 0.014 mg/L; Hg: 0.007 mg/L |
|
[45] |
2020–2025 |
pH: 7.1–8.3; EC: 900–1,500 µS/cm; TDS: 600–1,050 mg/L; DO: 5.0–8.5 mg/L; BOD: 0.8–6.5 mg/L; NO₃⁻: 2.0–7.8 mg/L; PO₄³⁻: 0.04–0.5 mg/L |
Figure 5. Temporal variation of water quality parameters of the Euphrates River at Babil station
Salman et al. [5] focused on four stations along the Al-Musayyib River from spring to autumn 2022. The researchers measured water temperatures (16.5–29.8℃), pH (7.4–8.2), EC (450–1,050 µS/cm), TDS (280–710 mg/L), DO (4.5–7.6 mg/L), BOD (2.8–5.9 mg/L), total hardness (230–470 mg/L), and heavy metals including iron (0.28–1.15 mg/L), zinc (0.04–0.14 mg/L), manganese (0.02–0.09 mg/L), lead (0.01–0.035 mg/L), and cadmium (0.002–0.009 mg/L). All measured parameters were generally within Iraqi and WHO permissible limits, indicating that the water is suitable for agricultural and industrial purposes, while continuous monitoring is recommended to ensure long-term water quality.
Buhlool et al. [39] achieved a detailed evaluation of the water quality of the Euphrates River utilising the Canadian Council of Ministers of the Environment Water Quality Index (CCME WQI) to assess its appropriateness for irrigation purposes. The researchers selected six sampling stations distributed along the middle and lower reaches of the river, namely Al-Musayyib, Sadat Al-Hindiya, Kifl, Kufa, Manathira, and Abbasiya. The chief hydrochemical factors were measured at these stations, enlightening EC values ranging between 1160 to 1860 µS/cm and TDS concentrations between 730 and 1190 mg/L. Calcium concentrations varied between 50 to 126 mg/L, magnesium between 22 to 40 mg/L, and sodium between 90 to 150 mg/L. Chloride concentrations ranged between 95 and 150 mg/L, while sulfate levels were found between 110 and 230 mg/L. Referring to the CCME WQI cataloguing, poor water quality for irrigation use at several stations was stated, predominantly those located downstream of urban centers and agricultural discharge points. The researchers then stated that water quality increasingly worsens southward along the river, principally because of anthropogenic activities and weakened flow conditions.
The effect of industrial and agricultural activities on the water quality of the Euphrates River near Al-Musayyib, Iraq, was inspected by Ismael et al. [40]. The obtained results showed the variations of studied parameters including the pH (7.2–8.1), EC (500–1,200 µS/cm), Ca²+ (40–90 mg/L); Mg²+ (15–45 mg/L); Na1+ (30–80 mg/L); Cl1- (50–150 mg/L); SO4²- (40–130 mg/L), with increased nitrate and phosphate concentrations close to agriculture areas. Furthermore, the water samples close to industrial sites contained considerable concentrations of metals, which signified a substantial human effect.
Makki and Manii [41] inspected the area close to the Al-Musayyab Thermal Power Plant in Iraq. The discrepancies of water temperature (18–34℃), pH (7.3–8.0), TDS (700–1,100 mg/L), EC (1,050–1,450 µS/cm), BOD (1.2–8.0 mg/L), DO (4.5–8.2 mg/L), nitrate (1.5–6.2 mg/L), phosphate (0.05–0.4 mg/L), and heavy metals (Fe, Mn, Zn) were declared. Accordingly, the researchers demonstrated the fact of moderate pollution close to discharge points with gradual improvement downstream.
The levels of heavy metals in the Euphrates River near agricultural discharge areas in Babil Governorate, Iraq, were inspected by Salah et al. [42]. The water samples were collected from different sampling stations positioned upstream and downstream of key agricultural drainage outlets. The findings showed pH (6.8–7.9), EC (900–1,350 µS/cm), TDS (550–980 mg/L), and DO (4.8–7.5 mg/L), besides having high concentrations of Cd, Pb, Zn, and Cu, which represented a prominent agricultural runoff pollution.
Al-Dabbas et al. [43] conducted a particular research to measure the effects of agricultural drainage on water quality near Al-Hilla city along the Euphrates River. The main emphasis was on measuring the levels of nutrient and trace metal pollutants, principally phosphate, nitrate, and cadmium. Nitrate ranged between 4.0 to 15 mg/L, phosphate between 0.05 to 0.6 mg/L, and cadmium up to 0.010 mg/L. The progressive levels of the tested matters represented the actual effect of agricultural runoff, posing a serious threat of eutrophication and metal pollution in the study area.
Referring to the microbiological analysis, Al-Ghizzi [44] evaluated the water quality of Euphrates River using bioassays with the green microalga Chlorella vulgaris technique, which is a familiar biological metric. To systematically conduct this research, several samples were collected from various places along the Euphrates River that specifically covered industrial and agricultural discharge points across several Iraqi governorates, such as Babil, Najaf, and Karbala. The results of physico-chemical analysis ascertained the ranges of pH (7.1–8.4), EC (900–1500 µS/cm), DO (4.8–8.3 mg/L), and TDS (600–1100 mg/L). Also, the range between 0.006 to 0.042 mg/L was ascertained for lead, with detection of cadmium and mercury at 0.014 mg/L and 0.007 mg/L, respectively. Accordingly, the obtained results have assured a clear variation of toxic matters. However, there is no clear evidence of algal growth and photosynthetic activity in the tested sites.
Khlaif and Al-Hassany [45] evaluated water quality in Babil and Karbala in 2022, reporting pH (7.1–8.3), EC (900–1,500 µS/cm), TDS (600–1,050 mg/L), DO (5.0–8.5 mg/L), BOD (0.8–6.5 mg/L), nitrate (2.0–7.8 mg/L), phosphate (0.04–0.5 mg/L), and heavy metals (Fe, Mn, Zn) mostly within permissible limits. The researchers distinguished moderate pollution near discharge points.
As elucidated in Table 4 and Figure 5 and referring to Babil Province, it can be said that considerable temporal and procedural gaps in appraising water quality still existed, notwithstanding a number of studies conducted between 1995 and 2025. More specifically, not many studies were conducted before 1995, which suggests unexplored effects of industrial applications. During the period between 2007 and 2015, no consistent monitoring research was conducted, as most published investigations were dependent on traditional physicochemical analyses without utilising biological indicators or modelling approaches. In this aspect, most studies were focused on Al-Musayyib and Al-Hilla while concentrating on covering the upstream or peripheral zones. Thus, these profound gaps can highlight the necessity of a specific study to precisely conduct an ecologically integrated evaluation to comprehensively perceive the impacts of anthropogenic activities on the Euphrates River in this area.
3.3 Southern Euphrates River reach
3.3.1 Assessment in the Karbala and Najaf region
Early longitudinal environmental monitoring of the Euphrates River delivered life-threatening visions into the contamination of heavy metals and water quality. Referring to the area between Al-Hindia Barrage and Al-Kufa, Salman [46] conducted a specific study that documented a considerable variation of physicochemical parameters of EC, TDS, BOD5, and trace metals. Specifically, TDS exceeded 1500 mg/L in agricultural zones and BOD5 of greater than 5 mg/L. Indeed, these values indicated a notable organic pollution. DO was detected lesser than 3 mg/L in the summer with a range of pH between 7.2 and 8.3. This has proposed probable hypoxic conditions in stagnant stretches of the river.
Referring to Kamel et al. [47] and Alzurfi et al. [48], the water quality of the Euphrates River was the main focus. Utilising the Heavy Metal Pollution Index (HPI), Kamel et al. [47] evaluated the heavy metal pollution between Al-Kifl and Al-Kufa from July 2020 to January 2021. The researchers investigated cadmium concentration and revealed HPI values over 100 with a high cadmium level, proposing acute contamination. Alzurfi et al. [48] inspected the physicochemical features of pH, EC, TDS, DO, and BOD of the river from Hindiya Dam to Mishkab Regulator throughout January–June of 2016. The researchers stated that the water is not suitable for drinking purposes, as it is suitable for irrigation use. On top of this, it can be said that the aforementioned studies have demonstrated steady patterns of physicochemical variables, organic pollution, and accumulation of heavy metals via different sectors and time periods of the Euphrates River, proposing variable water quality due to ongoing environmental pressure.
Salman and Hussain [49] inspected both dissolved salts and heavy metals across three different stations in the Euphrates during a full hydrological cycle (2009–2010). Accordingly, they demonstrated different results of Fe (79.04 µg/L), Cu (7.78 µg/L), Co (4.29 µg/L), Mn (0.31 µg/L), Pb (0.13 µg/L), and Ni (0.021 µg/L) while utilising flame atomic absorption spectrophotometry. More importantly, the concentrations of Fe and Cu exceeded the allowed and standard levels.
Kamel et al. [50] assessed heavy metal contamination in the Euphrates River stretch between Al-Kifl and Kufa in 2021, detecting Pb (0.004–0.038 mg/L), Cd (below detection to 0.011 mg/L), Cr, Ni, and Cu, with moderate to high pollution linked to agriculture and industry.
Recently, Al Sharifi et al. [51] achieved a detailed evaluation in Al-Najaf Al-Ashraf in 2023. At Station 1 (upstream), parameters included DO (7.3–8.6 mg/L), TDS (604–690 mg/L), EC (1,340–1,440 µS/cm), turbidity (3.6–4.5 NTU), pH (7.7–8.9), and COD (12.1–14.7 mg/L). At Station 2 (downstream), water quality was poorer with DO (5.4–6.8 mg/L), TDS (864–952 mg/L), EC (1,480–1,560 µS/cm), turbidity (8.4–10.8 NTU), pH (6.0–7.1), and COD (15.0–17.2 mg/L). During this investigation, Station 1 and Station 2 were determined to be “good” and “poor to very poor” based on WQI. Specifically, agricultural runoff, untreated wastewater, and a lack of regulation were the reasons behind the level of “poor to very poor” for Station 2.
A critical judgement of the published studies on the Euphrates River water quality between 1993 to 2024 can reveal a clear scarcity of standard research data between 2000 and 2020. Thus, it is hard to accurately chase the variation of water quality throughout this period. Also, the use of unreliable sampling approaches, imperfect spatial coverage, and a primary focus on conservative pollutants have impeded detailed temporal analysis. This also reflected inconsistent coverage of seasonal and hydrological variables. Accordingly, resolving these concerns is imperative and necessitates continuous research to ensure wide-scale monitoring, besides comprising the most influential pollutants to comprehensively perceive and manage the river’s water quality.
3.3.2 Qadisiyah and Al-Diwaniyah region
Abbas and Hassan [52] directed an evaluation of the water quality of the Diwaniyah River in Qadisiyah Province from September 2015 to June 2016. Specifically, the measurements indicated pH (7.2–8.3), water temperature (18.5–32.0℃), turbidity 12–45 NTU, DO of 4.0–6.5 mg/L, TDS of 320–890 mg/L, total alkalinity 150–280 mg/L, nitrite 0.02–0.08 mg/L, nitrate 1.2–6.5 mg/L, and phosphate 0.15–0.7 mg/L. Indeed, these results can signify poor water quality, proposing the effects of urban pollution and cumulative agricultural runoff along the river, with obvious seasonal variations.
Al Mousawi et al. [53] assessed spatial and temporal changes of water quality in the Euphrates River within Qadisiyah Province. They stated that pH (7.0–8.2), BOD (1.0–6.5 mg/L), COD (8–22 mg/L), DO (5.0–8.4 mg/L), TDS (600–1,100 mg/L), nitrates (1.2–6.0 mg/L), Pb (0.003–0.04 mg/L), phosphates (0.04–0.5 mg/L), and Cd lesser than 0.01 mg/L. Precisely, the researchers determined pollution hotspots near agricultural and urban wastewater discharges while utilising GIS mapping.
A WQI model for the Euphrates River within Al-Diwaniyah City, Qadisiyah Province, was developed by Al-Khuzaie et al. [54]. The researchers ascertained pH (7.3–8.1), EC (950–1,450 µS/cm), TDS (680–980 mg/L), BOD (2.8–5.7 mg/L), DO (4.2–6.9 mg/L), nitrate (2–9 mg/L), and phosphate (0.05–0.25 mg/L). In turn, the researchers determined "medium to poor" water quality downstream of pollution sources, which stated the need for integrated management.
3.3.3 Samawah, Nasiriyah, and Basrah region
The hydrochemical properties and water quality indicators of the Euphrates River across different provinces in Iraq were investigated over the previous three decades. Al-Mutawqi and Al-Mayyahi [55] covered four stations along the Euphrates River between Al-Hindiya Barrage and Nasiriya City in 2024 to assess the hydrochemical and water quality. The results obtained pH (7.5–8.2), TDS (700–1,200 mg/L), EC (1,100–1,800 µS/cm), DO (3.5–6.5 mg/L), nitrate (1.5–9 mg/L), phosphate (0.05–0.28 mg/L), and chloride (120–300 mg/L). Thus, the researchers approved a gradual decline in water quality downstream, besides augmented salinity and nutrient concentrations. These results were ascribed to municipal discharges and agricultural return flows.
The examination of water salinity along the Euphrates River was conducted by Rahi and Halihan [56]. In this aspect, the researchers focused on determining TDS and sodium hazard for irrigation. The results introduced the fact that TDS can be varied between ~600 mg/L in upstream regions to 1,200–1,800 mg/L near Samawa, with the highest TDS attained near Al-Qurna. The researchers attributed the salinity buildup to agricultural return flows, decreased upstream flow from dam operations, and evaporation. Then, the researchers stated that the Euphrates River water becomes gradually inappropriate for drinking and even irrigation as it flows toward the southern governorates, particularly under arid seasonal conditions.
During the period 2015–2017, a comprehensive water quality measurement was conducted by Al-Silawy et al. [57] considering six stations distributed between Samawa and Al-Qurna. The results indicated variable indicators of TDS (1100–2000 mg/L), EC (1300–2200 µS/cm), pH (7.1–8.4), BOD5 (2.0–7.0 mg/L), COD (15–38 mg/L), sulfate (190–520 mg/L), and chloride (180–450 mg/L). The findings clarified seasonal variances with progressive pollution indicators throughout dry periods, representative that diminished river flow integrated with raised anthropogenic discharges can expressively degrade water quality downstream.
Mawat and Hamdan [58] focused on evaluating spatial and temporal variances of water quality in the Euphrates River within the Muthanna and Al-Qurna areas using multivariate statistical models and Geographic Information Systems (GIS). The obtained results showed that pH ranges between 7.0 to 8.3, EC ranges between 1200 to 2400 µS/cm, phosphates range between 0.03 to 0.4 mg/L, nitrates range between 1.5 to 6.5 mg/L, and heavy metals (Pb, Cd, Ni). The peak contamination levels were introduced in the summer and drought months, which mirrored the effect of low flow and raised pollutant loads.
Muhammed and Al-Dabbas [59] assessed water quality between Babil and Muthanna (2010–2020), with pH (7.1–8.3), EC (1,100–2,300 µS/cm), TDS (900–1,900 mg/L), DO (4.2–7.1 mg/L), BOD (2.5–7.5 mg/L), nitrates (1.8–6.2 mg/L), phosphates (0.04–0.38 mg/L), turbidity (5–25 NTU), chloride (140–370 mg/L), sulfate (190–480 mg/L), and heavy metals (Pb 0.02–0.12 mg/L, Cd 0.005–0.03 mg/L, Zn 0.1–0.35 mg/L). Importantly, the water quality deterioration was ascribed to the climate change-induced droughts and heat, to seasonal. In this aspect, Khalaf et al. [60] explored the seasonal variations in physicochemical water quality indexes of the Euphrates River at Al-Fadhlia, Nasiriyah, Iraq. The researchers conducted this investigation in 2021, collecting samples along different seasons to seize temporal variability. The findings concluded the following variations of: pH (7.0–8.5), Temperature (from 14 to 38℃), TDS (550–950 mg/L), EC (850–1400 µS/cm), BOD5 (0.9–6.8 mg/L), DO (4.5–9.2 mg/L), nitrate: 1.0–5.5 mg/L) and phosphate: 0.03–0.4 mg/L). The outcomes stated therefore noteworthy seasonal variations, with greater temperatures and nutrient concentrations in summer months relating to lower DO values.
Awed and Shihab [61] inspected the consequences of discharged wastewater into the Euphrates close to industrial zones in Thi Qar Province, Iraq. To systematically conduct this research, water samples were collected from numerous stations upstream and downstream of heavy water discharge points. This concluded that TDS (600–1100 mg/L), EC (950–1420 µS/cm), pH (7.2–8.1), and DO (5.1–8.7 mg/L). The results ascertained a considerable growth in heavy metals downstream of discharge points. Exactly, cadmium below detection limits to 0.012 mg/L, lead varied between 0.005 to 0.045 mg/L, and mercury of more than 0.006 mg/L. These results posed ecological and human health hazards.
Al-Kinani [62] concentrated on observing the heavy metals in the Euphrates River near Suq Al Shioukh in southern Iraq. The results elaborated various lead levels between 0.004 and 0.028 mg/L, while catching cadmium at 0.013 mg/L. Also, arsenic was noticed between 0.002 and 0.018 mg/L. pH and TDS were detected at (7.1–8.4) and (920–1450 µS/cm), respectively. Uncontrolled agricultural and industrial activities are the main reasons behind the aforementioned results.
A complete judgement of water quality along the Euphrates River from Samawah to Basra, including stations in Al-Qurna, was achieved by Oleiwi et al. [63]. The researchers analyzed hydrochemical and physical parameters: temperature (15–33℃), pH (7.1–8.4), EC (1200–2550 µS/cm), TDS (1100–2300 mg/L), turbidity (6–27 NTU), DO (3.0–7.5 mg/L), BOD₅ (3.0–8.3 mg/L), and COD (6.0–15.0 mg/L). Nutrients measured included nitrate (1.6–7.0 mg/L), nitrite (0.01–0.06 mg/L), ammonium (0.3–1.4 mg/L), and phosphate (0.05–0.4 mg/L). Heavy metals measured included lead (0.02–0.12 mg/L), cadmium (0.005–0.03 mg/L), zinc (0.1–0.45 mg/L), nickel (0.015–0.06 mg/L), and chromium (0.01–0.04 mg/L).
The biological indices were investigated to assign the levels of organic and bacterial pollution. Mostly, the results ascertained downstream deterioration in water quality, which is affected by agricultural runoff and industrial pollution with reduced river flow. Thus, most colleagues emphasized the inevitability of constant monitoring and multisectoral cooperation for sustainable water resource management. Table 5 introduces the utilized categories of the original methodologies. The first category deliberates wider temporal evaluations, which represented long-term seasonal worsening and downstream rises in salinity and TDS. The second category stresses heavy metals and industrial pollution, emphasizing considerable concentrations of cadmium, lead, chromium, and others. The third category involves combined evaluations using GIS tools, which predominantly mapped pollution hotspots and depicted the outcome of agricultural and municipal discharge. The fourth category includes the most recent and comprehensive evaluations, which focused on hydrochemical, biological, and spatial analysis across southern Iraq. Finally, spatial monitoring investigations conveyed wide-ranging comparisons across multiple stations, representing advanced downstream degradation. Cooperatively, these investigations emphasize dependable results: a southward decline in water quality, obvious seasonal variations, and anthropogenic drivers such as agricultural runoff, industrial effluents, and wastewater discharge.
Table 5. A summary of associated investigations of the water quality of the Euphrates River within Samawah, Nasiriyah, and Basrah Region
|
Categories |
Included Studies |
|
Integrated Assessments and GIS Applications (Spatial modeling and multi-indicator approaches) |
[58, 63] |
|
Latest Comprehensive Evaluations (2020–2025) |
[59-63] |
|
Spatially Detailed Monitoring Programs |
[57, 58, 63] |
3.4 Studies along the Euphrates Reach in Iraq
Banat and Al-Rawi [64] analyzed hydrochemical factors along the Euphrates, reporting sodium levels between 40 to 180 mg/L, magnesium from 15 to 60 mg/L, and calcium between 30 and 90 mg/L. Furthermore, bicarbonate and sulfate were detected at 50 to 200 mg/L and 200 and 450 mg/L upstream, respectively, with a noticeable increase of chloride downstream from 30 mg/L to 400 mg/L. A range between 499 ppm upstream to 1,549 ppm downstream was assured for TDS, demonstrating the natural and anthropogenic impacts.
Several investigations were conducted to analyze the hydrochemical features of the Euphrates River along various spatial and temporal scales, signifying the effect of anthropogenic activities on water quality. Noori [65] conducted a detailed investigation to analyse water quality at twenty-two stations from upstream to downstream over a prolonged period between 2014 to 2019. To systematically categorize pollution hotspots and quantify the spatial distribution of water pollution, the GIS spatial modeling and the WQI were specifically used. The attained findings showed 1000 mg/L of TDS, 2500 µS/cm of EC, pH 7.1–8.0, sulfate (313.7–398.1 mg/L), which surpasses the Iraqi limits at Manathira and Kufa stations. However, nitrate was detected at lower than 50 mg/L, DO close to 5 mg/L near pollution sources, turbidity of less than 6 NTU, and BOD5 of less than the WHO limits.
During 2023, Abdulrazzak [66] appraised five stations, including Al-Qaim, Haditha, and Al-Kut. Parameter ranges were TDS (600–2800 mg/L), EC (1.0–4.5 mS/cm), pH (7.2–8.0), calcium (55–210 mg/L), sodium (150–400 mg/L), total hardness (300–900 mg/L), sulfate (200–900 mg/L), and nitrate (1.5–6.0 mg/L). The findings were close to Kadhim’s spatial trends with a moderate nitrate level, reflecting various localized pollution metrics.
Accordingly, it can be said that there is a rise in numerous water quality metrics (TDS, EC, total hardness, sulfate, and nitrate levels), underlining the rising impacts of agricultural runoff, industrial effluents, and untreated wastewater. However, pH is still within a stable and slightly alkaline range across all datasets. Furthermore, the increased salinity levels can be ascribed to a certain hydrochemical process. Banat and Al-Rawi [64] and Noori [65] underlined a rise in salinity in the middle and lower reaches as a result of water evaporation and concentration, as a response to reduced flow and high-water temperatures.
Despite the existence of several studies that investigated the water quality of the Euphrates River across various regions and time frames, there is still a necessity to conduct further investigations. Specifically, the common existing investigations have mainly focused on basic physico-chemical measurements like pH, EC, TDS, and major ions (e.g., Ca²+, Na+1, SO-², NO2-) while delivering imperfect visions into biological and micro-biological metrics. Coliform bacteria, protozoa, and viruses are the common public health indicators that should be expressively covered as they were mostly discarded despite their significance to effectually assess water safety for domestic use. Furthermore, arsenic (As), mercury (Hg), and antimony (Sb) were detected as their long-term ecological and health hazards have infrequently been controlled. The shortage of seasonal sampling demonstrates another considerable gap in the open literature, as several investigations were designed based on one-time data collection, obstructing the capability to detect temporal inconsistency driven by climatic parameters. Furthermore, organic pollutants like herbicides, pesticides, and pharmaceutical residues have received negligible consideration, even with their growing presence in both agricultural and urban landscapes along the river. Only some investigations have deployed improved evaluation techniques like the WQI or geospatial procedures such as GIS-based pollution mapping, which are important for integrated water resource planning and spatial analysis of pollution hotspots.
Although substantial research has been conducted in central and southern stretches of the Euphrates, upper basin areas with potential industrial threats persist unrevealed. A case in point is the phosphate fertilizer complex in Al-Qaim, western Anbar. Despite its proximity to the river and the likelihood of discharging phosphate-rich wastewater and heavy metals into adjacent ecosystems, no peer-reviewed studies have investigated its direct impact on river water quality. This is particularly concerning given the findings of Rasul and Al-Jaleel [12], who reported elevated levels of cadmium, copper, and chromium in downstream areas near Al-Shallal, suggesting possible links to industrial discharge. The absence of systematic monitoring in such critical zones hinders a full understanding of cumulative pollution pressures.
The studies collectively emphasize ongoing water quality degradation downstream as a result of human activities. The application of advanced spatial tools (GIS, WQI), as in Noori’s study [65], is recommended for future monitoring programs to better target pollution control measures. However, gaps remain, particularly regarding the inclusion of biological indicators and trace contaminants.
Resolving the aforementioned research gaps is crucial to developing a detailed and evidence-based framework to protect, monitor, and sustainably manage the Euphrates River. A multidisciplinary technique that integrates temporal dynamics, improved analytical methodologies, and evaluation of emergent pollutants would be indispensable to safeguard this vital water resource in the face of rising anthropogenic and climatic stressors.
Table 6 introduces a summary of the relevant investigations published between 1995 and 2025 that go into detail and discrete trends in the spatial and temporal dynamics of water quality in the Euphrates River, Iraq.
Table 6. A contrast of relevant water quality studies of the Euphrates River in Iraq
|
Aspect |
[66] |
[65] |
Results |
Key Differences |
Gaps |
|
Spatial Coverage |
5 stations |
22 stations (full river reach) |
Increase in salinity, hardness, and nitrates downstream |
Noori [65] provides the most comprehensive spatial coverage |
Limited spatial data in some industrial zones |
|
Temporal Resolution |
Multi-year data (2023) |
6 years (2014–2019) |
Stable, slightly alkaline pH |
Noori [65] gives the strongest temporal trend; others are limited temporally |
Lack of continuous real-time monitoring |
|
Parameters Measured |
pH, EC, TDS, Na+, K+, Cl-1, SO₄²⁻, NO₃⁻, DO, BOD₅ |
pH, TDS, EC, Turbidity, DO, BOD5, SO4²-, NO2-1, TSS |
Similar increasing trends in TDS, EC, and ions |
Abbas and Hassan [52] focus on heavy metals; others focus on broader hydrochemistry and oxygen indicators |
Lack of trace metal and organic pollutant data |
|
Main Pollution Sources |
Agriculture, industrial, and wastewater |
Agricultural runoff, sewage discharges, and industrial inputs |
Anthropogenic activities as key drivers of degradation |
Noori [65] highlights the spatial spread of pollution zones |
Limited data on upstream or hidden sources |
|
Focus on Industrial Zones |
General mention of pollution sources |
Identifies key hotspots along the river (e.g., Kufa, Manathira) |
Downstream degradation is a common finding |
Only Noori [65] maps pollution zones spatially |
Lack of detailed analysis near phosphate and petrochemical zones |
5.1 Spatial variation of water quality along the Euphrates River
The spatial assessment of water quality along the Euphrates River from the upper reach, the middle reach, and further downstream to the southern governorates reveals a clear and progressive deterioration in physicochemical and ecological conditions toward the south (Table 7). This spatial gradient is consistently reflected across major water quality indicators, including salinity (EC and TDS), major ions, nutrient loading, and heavy metals.
Table 7. Spatial variation of the water quality parameters along the Euphrates River (upper – middle – southern reaches, Iraq) over 1983-2025
|
Parameter |
Upper Reach (Anbar) |
Middle Reach (Babil) |
Southern Reach (Karbala–Najaf–Qadisiyah–Muthanna–Dhi Qar–Basrah) |
Unit |
|
Temperature |
22 |
24.6 |
26 |
℃ |
|
pH |
7.75 |
7.66 |
7.7 |
– |
|
EC |
980 |
1130 |
1500 |
µS/cm |
|
TDS |
780 |
880 |
1100 |
mg/L |
|
DO |
6.3 |
6.45 |
6 |
mg/L |
|
BOD₅ |
5.4 |
4 |
5 |
mg/L |
|
COD |
34 |
– |
17 |
mg/L |
|
Ca²⁺ |
82 |
74 |
75 |
mg/L |
|
Mg²⁺ |
33 |
28 |
40 |
mg/L |
|
Na⁺ |
95 |
88 |
160 |
mg/L |
|
Cl⁻ |
120 |
117 |
210 |
mg/L |
|
SO₄²⁻ |
185 |
146 |
355 |
mg/L |
|
HCO₃⁻ |
150 |
– |
260 |
mg/L |
|
NO₃⁻ |
18 |
5.7 |
5 |
mg/L |
|
PO₄³⁻ |
1.1 |
0.32 |
0.2 |
mg/L |
|
Pb |
0.035 |
0.021 |
0.05 |
mg/L |
|
Cd |
0.008 |
0.011 |
0.017 |
mg/L |
|
Ni |
0.02 |
– |
0.048 |
mg/L |
|
Cr |
0.025 |
– |
0.027 |
mg/L |
|
Fe |
0.95 |
0.57 |
0.08 |
mg/L |
The upper reach exhibits comparatively better water quality conditions, supported by higher flow velocities, lower cumulative pollutant loads, and limited anthropogenic pressure. Salinity levels remain relatively low, and major ion concentrations fall within typical natural hydrochemical ranges.
The middle reach, particularly the stretch between Al-Musayyib and Al-Hilla, shows transitional characteristics, where agricultural return flows and mixed domestic discharges begin to elevate salinity, nutrient concentrations, and BOD5 values. While the water quality in this segment remains within acceptable ranges for some uses, early signs of ecological stress are evident.
The southern reach experiences the most pronounced water quality degradation. EC commonly exceeds 1500 µS/cm and TDS surpasses 1100 mg/L, indicating cumulative salinity enrichment driven by extensive irrigation withdrawals, diminished upstream inflow, prolonged drought, and high evaporation rates. Correspondingly, sulfate and chloride concentrations increase sharply downstream, reflecting intensified geochemical weathering and anthropogenic inputs. Dissolved oxygen concentrations decline slightly toward the south, whereas BOD5 and COD increase, signifying higher organic loads from untreated or partially treated wastewater and reduced flow conditions.
Nutrient dynamics further reinforce this gradient. Nitrate concentrations remain moderate in the middle and southern reaches, while phosphate exhibits episodic increases during low-flow periods, suggesting an increasing eutrophication potential in the southern sectors. Heavy metals, particularly Pb, Cd, Ni, and Cr, reach their highest averages in the southern governorates due to industrial activities, urban effluents, and sediment re-mobilization.
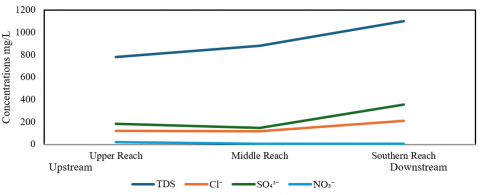
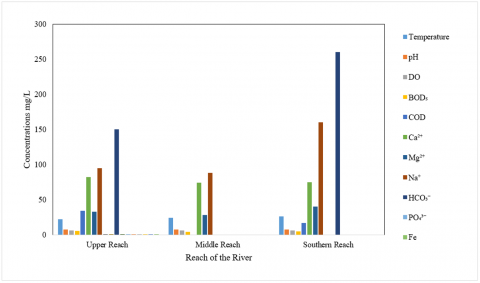
The pronounced water quality degradation in the southern reach, including the marked increase in salinity and nutrient loads (as shown in Table 7 and Figures 6 and 7), results from a complex interplay of hydrological, geochemical, and anthropogenic processes rather than a mere cumulative effect. Reduced river discharge, combined with high temperatures in arid regions, enhances evaporation and concentration, increasing the proportion of dissolved salts. Irrigation backflow contributes substantial amounts of salts, particularly chloride and sulfate, and nutrients, as water leaches salts from soils before returning to the river. Additionally, interaction with saline groundwater aquifers along the middle and southern course introduces natural salts from evaporite-rich formations. These spatial patterns align with previous basin-wide assessments, which confirm that agricultural drainage, industrial discharges, inadequate wastewater treatment, and climate-induced reductions in flow collectively intensify pollution downstream. Figures 6 and 7 clearly illustrate these trends, showing the downstream increase in TDS, Cl⁻, SO₄²⁻, NO₃⁻, major ions, nutrients, and organic pollution indicators along the Euphrates River.
Figure 6. Comparative line chart of key pollution indicators signifying downstream degradation along the Euphrates River reaches
Figure 7. Spatial variation of water quality parameters along the Euphrates River
5.2 Temporal variation of water quality along the Euphrates River
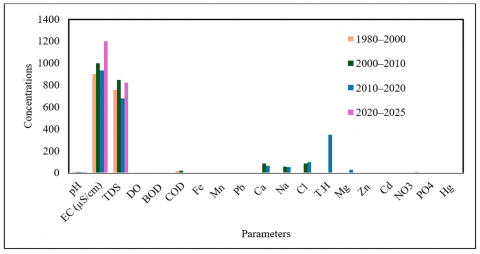
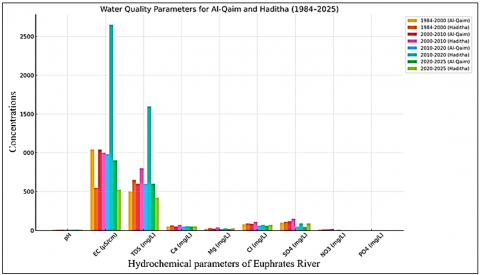
Long-term assessments of water quality in the upper Euphrates reach at Al-Qaim and Haditha (1983–2025) reveal significant temporal shifts across four chronological intervals (1984–2000, 2000–2010, 2010–2020, and 2020–2025) (Figures 8 and 9). Across all periods, pH remained within neutral to slightly alkaline conditions (7.3–8.2), reflecting a stable carbonate buffering system with minor seasonal fluctuations associated with biological activity and surface runoff.
Figure 8. Temporal variation of water quality parameters of the Euphrates River between Qaim and Haditha stations
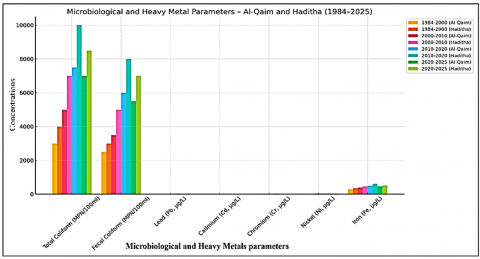
Figure 9. Temporal variation of water quality parameters (Microbiological and heavy metals) of the Euphrates River between Qaim and Haditha stations
In contrast, salinity indicators displayed a pronounced upward trend. EC increased from approximately 1,040 µS/cm in the 1980s to nearly 2,650 µS/cm at Haditha during 2010–2025, accompanied by a rise in TDS from ~500 mg/L to more than 1,600 mg/L (Figure 8). Major cations (Ca²+, Mg²+, Na+, K+) also increased notably after 2010, while chloride and sulfate concentrations exhibited parallel upward trajectories, exceeding 100 mg/L and 150 mg/L, respectively. These increases reflect cumulative effects of reduced river discharge, intensified agricultural activity, and higher evaporation rates.
Nutrient enrichment similarly intensified over time. Nitrate increased from ~10 mg/L in the 1984 to 2000 interval to more than 30 mg/L during 2010–2025, while phosphate rose from ~0.5 mg/L to >2.0 mg/L, particularly at Haditha, indicating increased agricultural inputs and sewage discharge, alongside a growing risk of eutrophication.
Microbial and heavy metal datasets also demonstrate clear deterioration over time. Total and fecal coliform counts surged sharply between 2010–2025, aligning with increased untreated wastewater discharge and urban expansion. Heavy metals, including Pb, Cd, Cr, Ni, and Fe, which are displayed progressive increases, surpassing permissible limits during several intervals, confirming intensifying anthropogenic loading and sediment remobilization (Figure 9).
For stations without long-term datasets, the available evidence suggests similar deteriorating patterns. No analytical records were available for Hit, Ramadi, or Fallujah before 2000. However, between 2000 to 2010, these locations exhibited increasing salinity and nutrient concentrations downstream, driven by agricultural return flows and expanding domestic discharges. The 2010–2020 interval shows a pronounced spike in microbial and chemical pollution at Ramadi and Fallujah, while a complete data gap persists for Hit. By 2020–2025, all three stations exhibited poor to very poor water quality, with Fallujah representing the most critical condition due to rapid population growth, untreated wastewater, and climate-related declines in river discharge.
A prolonged evaluation of WQI in the middle Euphrates reach (Babil, Karbala, Najaf) explored distinct temporal and spatial differences subject to agricultural, industrial, and municipal activities. Referring to the collected data from a number of investigations conducted between 1995 to 2025, pH exists in a stable level range between marginally acidic to somewhat alkaline conditions (6.8–8.4), implying persistent carbonate buffering with slight seasonal fluctuations as depicted in Figure 10.
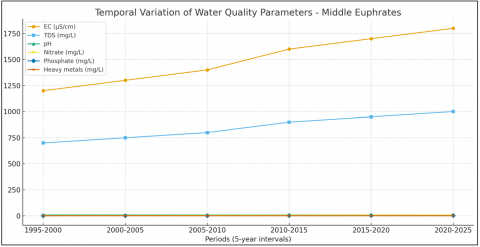
Figure 10. Temporal variation of water quality parameters of the Euphrates River (Middle reach)
TDS and EC indicators showed an increase in trend downstream. TDS was increased from 280–710 mg/L to 1,190 mg/L while EC ranged between 450 µS/cm in upstream areas near Al-Musayyib to 1,860 µS/cm near downstream stations. The other associated cations of Ca²⁺, Mg²⁺, Na⁺, and anions, including Cl⁻, SO₄²⁻, were detected at an identical trajectory, often beyond allowable concentrations in zones affected by exhaustive irrigation return flows and urban discharge. Seasonal spikes in EC and TDS were detected during low-flow periods, chiefly in summer months.
Nutrient levels were indicated in an upward temporal trend. Nitrate concentrations increased from 4 mg/L to 15 mg/L in 2000, while an increase in phosphate was indicated from 0.05 mg/L to 0.6 mg/L, which reflects progressive agricultural runoff. Accomplished investigations near Al-Musayyib and Al-Hilla elucidated moderate pollution at discharge points, with localized eutrophication risks associated with nutrient accumulation.
Heavy metals and microbial indices establish a strong anthropogenic effect. Specifically, Fe, Mn, Zn, Pb, and Cd were regularly identified, with raised concentrations downstream of industrial sites and agricultural drainage outlets. Bioassays using Chlorella vulgaris indicated inhibitory effects on algal growth in zones with higher metal loads, corroborating chemical analyses. Microbial counts, although less extensively reported, suggest rising contamination in proximity to urban centers.
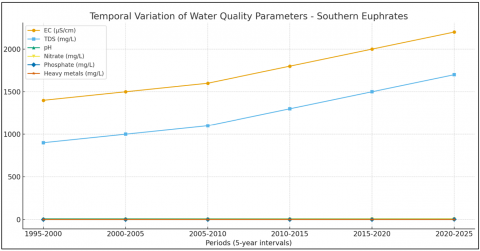
Moving further south along the Euphrates (Qadisiyah, Muthanna, Basrah), the deterioration of water quality becomes more pronounced. EC values reached up to 2,550 µS/cm near Al-Qurna, and TDS exceeded 2,000 mg/L in several southern stations (Figure 11). DO often fell below 3 mg/L in summer, indicating potential hypoxic conditions. BOD5 and COD increased downstream, emphasizing organic pollution, while nitrate, phosphate, and ammonium matters strengthened as a result of cumulative municipal and agricultural effects.
Figure 11. Temporal variation of water quality parameters of the Euphrates River (Southern reach)
Heavy metals, including Pb, Cd, Zn, Ni, and Cr detected beyond the allowed concentrations in multiple southern stations. GIS-based assessments and WQI analyses steadily reported a southward deterioration in water quality, with urban and industrial hotspots contributing disproportionately to river pollution. Seasonal variations were notable, with dry periods exacerbating salinity, nutrient concentrations, and metal accumulation. Indeed, these results would ascertain a gradual but steady worsening of water quality of the Euphrates River from the upper reach in Anbar through the middle and southern reaches, principally driven by anthropogenic pressures, flow reductions, and climatic stressors.
5.3 Integrated spatio-temporal variation based on heatmap analysis
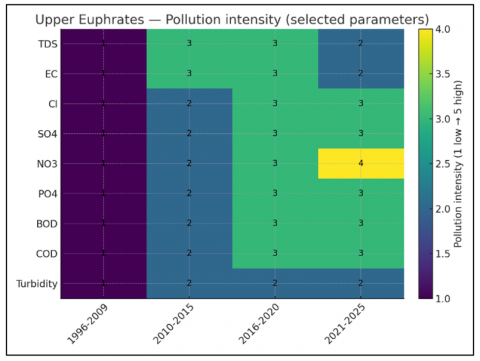
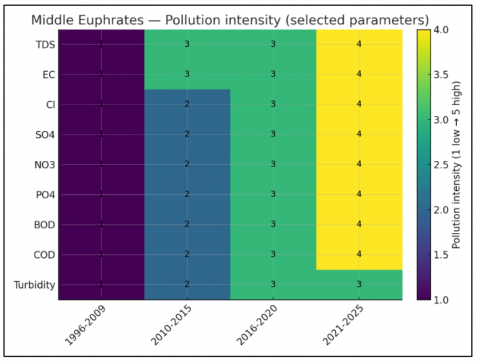
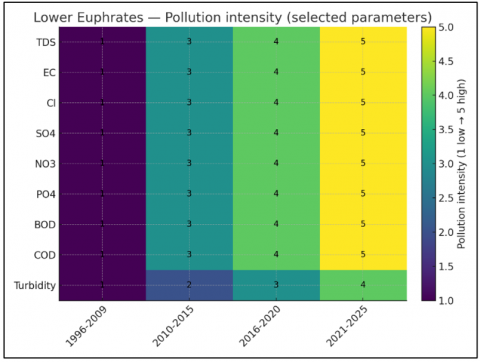
A detailed spatio-temporal viewpoint can be provided by Figures 12, 13, and 14 that ascertain the heatmap visualizations for the upper, middle, and southern reaches of the Euphrates River. This result accompanies the patterns defined earlier in Sections 5.1 and 5.2. Figures 12, 13, and 14 obviously demonstrate how key physicochemical factors which identified longitudinally along the river and increasingly over time. In turn, this would reflect the growing impacts of hydrological stress, climatic pressures, and anthropogenic activities.
Figure 12. Spatio-temporal intensification of WQI in the upper part of the Euphrates River: A heatmap visualization
Figure 13. Spatio-temporal intensification of WQI in the middle part of the Euphrates River: A heatmap visualization
Figure 14. Spatio-temporal intensification of WQI in the lower part of the Euphrates River: A heatmap visualization
In the upper reach, the heatmaps indicate moderate yet noticeable increases in salinity (TDS and EC), major ions (Cl⁻ and SO₄²⁻), and nutrient concentrations (NO₃⁻ and PO₄³⁻), particularly after 2010. This temporal escalation aligns with the findings of Section 5.2, where long-term assessments showed rising salinity and nutrient levels due to reduced river discharge, enhanced evaporation rates, and expanding agricultural activities. Despite these increases, the upper reach still maintains comparatively better water quality than downstream segments, consistent with the spatial gradient described in Section 5.1.
The middle reach displays a more marked and reliable rise across most factors, as shown in the heatmaps. This supports its representation as a transitional zone where agricultural return flows, domestic wastewater inputs, and industrial effluents begin to accumulate. The increased nutrient concentrations of NO₃⁻ and PO₄³⁻ assigned in Figure 13 agree well with the early signs of eutrophication previously discussed, particularly during low-flow periods. These patterns verify the spatial evaluation demonstrated in Section 5.1, which recognized the middle Euphrates as an area of evolving ecological stress.
In the southern reach, the heatmaps display the most substantial spatio-temporal intensification of pollution. The sharp increases in TDS, EC, sulfate, chloride, BOD₅, COD, and nutrient concentrations illustrate the cumulative impact of diminished upstream inflows, extensive irrigation withdrawals, recurrent droughts, and the discharge of untreated or partially treated wastewater. These trends validate the deterioration described in Sections 5.1 and 5.2, highlighting the southern segment as the most environmentally stressed and polluted part of the river system.
Collectively, the heatmaps confirm that water quality degradation along the Euphrates follows both a downstream longitudinal gradient and a time-dependent intensification. The visual patterns reinforce the conclusion that pollution accumulates progressively from the upper reach toward the southern governorates, driven by intersecting climatic, hydrological, and anthropogenic pressures. These insights underscore the urgent need for targeted water management interventions, particularly in the middle and southern reaches where the rate and magnitude of deterioration are most pronounced.
To synthesize the findings regarding pollution drivers, a qualitative assessment of the major pollution sources reported in the literature was conducted. Figure 15 illustrates the estimated contribution of these sources. Based on the consensus from the reviewed studies, agricultural runoff, including irrigation backflows and fertilizer use, is identified as the primary contributor, accounting for approximately 60% of the total pollution. This source largely drives the observed increases in salinity and nutrient loads. Untreated municipal wastewater represents the second-largest source, contributing about 30% and is mainly responsible for microbial contamination and high biochemical oxygen demand. Industrial effluents and other sources, such as natural geological interactions, account for the remaining 10%.
Figure 15. Estimated contribution rates of major pollution sources affecting the Euphrates River, based on qualitative synthesis of reviewed literature
5.4 Limitations and impact of methodological heterogeneity
It is essential to mention that the findings of the current research are based on a synthesis of research with noteworthy methodological variation. Referring to Section 2 (Materials and Methods) and Figure 3, this review integrates the results of fifty discrete investigations. This variation has a direct effect on the conclusions and has raised various concerns. First of all, the sampling frequency varied greatly: some research relied on one-time observations or seasonal snapshots, while others used monthly monitoring. This volatility makes it harder to discriminate between true long-term trends and short-term seasonal shifts. Second, inconsistencies in analytical methodologies were utilized to compute the WQI, precluding direct quantitative comparisons, rendering a formal meta-analysis inappropriate. Third, referring to the heatmaps elucidated in Figures 12, 13, and 14, it can be said that several investigations were focused on TDS and heavy metals, while signifying variables chloride and sulfate levels. Accordingly, a story synthesis methodology was used (as declared in Section 2.6). Precisely, the discrepancies noted across the revised investigations are significant proof that powerfully aids the principal recommendation: a common monitoring program to ensure consistent, comprehensive, and comparable water quality data along the Euphrates River.
This review ascertained the alarming and progressive decline in the water quality of the Euphrates River in Iraq, clearly demonstrating severe spatio-temporal degradation from Al-Qaim to Al-Qurna in Basrah, as visualized in the newly added composite line charts and heatmaps. The pronounced increase in Total Dissolved Solids, chloride, and sulfate is not merely a cumulative effect, but the outcome of a complex interplay of reduced river discharge (driven by climate change and upstream damming), intensified evaporation and concentration processes, extensive irrigation backflow, and interactions with saline groundwater. Referring to the essential results, agricultural runoff is the primary source of salinity, followed by untreated municipal wastewater, which causes organic and microbial contamination, and industrial effluents.
This continuous degradation is making the river increasingly unsuitable for drinking and irrigation, with the southern portions experiencing the most severe conditions. Despite the thoroughness of this review, some limitations should be acknowledged: the studies included exhibit variability in sampling frequency, analytical methods, and temporal coverage, and data gaps exist for some pollutants and time periods, particularly in the middle and southern reaches. These limitations restrict the ability to conduct formal meta-analyses but highlight the urgent need for standardized monitoring.
In light of these findings and the substantial data gaps identified, future research must advance beyond broad basin-level assessments. Thus, it is recommended to establish high-frequency, targeted monitoring programs at industrial hotspots (such as the Al-Qaim phosphate production area), with a focus on toxic metals including cadmium, chromium, and arsenic. Also, the application of advanced geochemical tools such as lead-210 dating to reconstruct historical pollution trends is essential. Finally, developing a standardized national monitoring framework is crucial to ensure consistent long-term data collection and to address the evident spatial and temporal gaps along the river’s course.
[1] Ansari, N. (2019). Hydro geopolitics of the Tigris and Euphrates. In Recent Researches in Earth and Environmental Sciences, pp. 35-70. https://doi.org/10.1007/978-3-030-18641-8_4
[2] Chabuk, A., Al-Madhlom, Q., Al-Maliki, A., Al-Ansari, N., Hussain, H.M., Laue, J. (2020). Water quality assessment along Tigris River (Iraq) using water quality index (WQI) and GIS software. Arabian Journal of Geosciences, 13: 654. https://doi.org/10.1007/s12517-020-05575-5
[3] Tememi, M.K., Hussein, M.A., Khaleefa, U.Q., Ghalib, H.B., Al-Mayah, A.M., Ruhmah, A.J. (2015). The Salts diffusion between East Hammar marsh area and Shatt Al-Arab River Northern Basra City. Marsh Bull, 10(1): 36-45.
[4] Al-Asadi, S.A., Al Hawash, A.B., Alkhlifa, N.H.A., Ghalib, H.B. (2019). Factors affecting the levels of toxic metals in the Shatt Al-Arab River, Southern Iraq. Earth Systems and Environment, 3(2): 313-325. https://doi.org/10.1007/s41748-019-00096-y
[5] Salman, J.M., Kaizal, A.F., Kot, P. (2023). Evaluation of some heavy metals, their fate and transportation in water, sediment, and some biota within AL-Musayyib River, Babylon Governorate, Iraq. Baghdad Science Journal, 20(2): 25. https://doi.org/10.21123/bsj.2022.7599
[6] Al-Asadi, S.A. (2016). A study of pH values in the Shatt Al-Arab River (southern Iraq). International Journal of Marine Science, 6.
[7] Al-Obaidi, M.A., Kara-Zaitri, C., Mujtaba, I.M. (2017). Removal of phenol from wastewater using spiral-wound reverse osmosis process: Model development based on experiment and simulation. Journal of Water Process Engineering, 18: 20-28. https://doi.org/10.1016/j.jwpe.2017.05.005
[8] Al-Obaidi, M.A., Li, J.P., Alsadaie, S., Kara-Zaïtri, C., Mujtaba, I.M. (2018). Modelling and optimization of a multistage reverse osmosis processes with permeate reprocessing and recycling for the removal of N-nitrosodimethylamine from wastewater using species conserving genetic algorithms. Chemical Engineering Journal, 350: 824-834. https://doi.org/10.1016/j.cej.2018.06.022
[9] Mason, M. (2022). Infrastructure under pressure: Water management and state-making in southern Iraq. Geoforum, 132: 52-61. https://doi.org/10.1016/j.geoforum.2022.04.006
[10] Al-Sarraj, E.S., Eskandera, M.Z., Al-Taee, S.K. (2022). Heavy metal pollution in Iraqi rivers and impact on human and fish health: A review. Biological and Applied Environmental Research, 6(2): 95-112. https://doi.org/10.51304/baer.2022.6.2.95
[11] Muslim, R.I., Al-Owaidi, M., Al-Ghasham, N.A. (2022). Environmental geochemistry of the Euphrates River from Al-Qaim to Basrah Governate, Iraq: Articles review. Iraqi National Journal of Earth Science, 22(2): 32-46. https://doi.org/10.33899/earth.2022.134663.1019
[12] Rasul, A., Al-Jaleel, H. (2021). Assessment of heavy metal pollution in clay fraction of the Euphrates River Sediments, AlQaim, Haditha Area, Western Desert Iraq. Iraqi Geological Journal, 55(1A): 139-157. https://doi.org/10.46717/igj.55.1A.11Ms-2022-01-30
[13] Al-Juhaishi, M.R., Oleiwi, A.S.H., Abed, B.S.H. (2024). Modeling surface runoff in Al-Mohammadi Valley: Influence of climate and soil parameters. International Journal of Design & Nature and Ecodynamics, 19(3): 1043-1049. https://doi.org/10.18280/ijdne.190333
[14] Daggupati, P., Deb, D., Srinivasan, R., Yeganantham, D., Mehta, V.M., Rosenberg, N.J. (2017). Large-scale fine-resolution hydrological modeling using parameter regionalization in the Missouri River basin. JAWRA Journal of the American Water Resources Association, 52(3): 648-666. https://doi.org/10.1111/1752-1688.12413
[15] Jassim, S.Z., Goff, J.C. (2006). Geology of Iraq. Dolin, Prague and Moravian Museum, Brno.
[16] Al-Omari, Z.Y., Al-Taani, A.T. (2017). Secure LSB steganography for colored images using character-color mapping. In 2017 8th International Conference on Information and Communication Systems (ICICS), Irbid, Jordan, pp. 104-110. https://doi.org/10.1109/IACS.2017.7921954
[17] Khawaji, A.D., Kutubkhanah, I.K., Wie, J.M. (2006). A 13.3 MGD seawater RO desalination plant for Yanbu Industrial City. Desalination, 203(1-3): 176-188. https://doi.org/10.1016/j.desal.2006.02.018
[18] Saleh R.A.Q., Oleiwi A.S., Lateef Z.Q. (2024). The impact of climate change on water quality and consumption in the Tigris River Basin (Mosul-Baghdad). IOP Conference Series: Earth and Environmental Science, 1374: 012048. https://doi.org/10.1088/1755-1315/1374/1/012048
[19] Al-Ansari, N. (2025). Water resources in Iraq: Perspectives and prognosis. Journal of Water Resources and Geosciences, 4(1): 249-266. https://jwrg.gov.iq/index.php/jwrg/article/view/136.
[20] Khaleefa, E.O., Kamel, A.H. (2021). Effects of flow rate in Euphrates River on salinity concentrations. SSRG International Journal of Civil Engineering, 8(6): 1-7. https://doi.org/10.14445/23488352/IJCE-V8I6P101
[21] Mahmood, B.A. (2021). Environmental properties and analysis of the Euphrates River within Anbar Governorate in Iraq: A review. Iraqi Journal of Desert Studies, 11(2): 58-71. https://doi.org/10.36531/desert.2022.172742
[22] Khouri, J. (2003). Sustainable development and management of water resources in the Arab region. Developments in Water Science, 50: 199-220. https://doi.org/10.1016/S0167-5648(03)80018-7
[23] Al Bomola, A. (2011). Temporal and spatial changes in water quality of the Euphrates River—Iraq. Master’s Thesis, Lund University, Lund. https://www.lunduniversity.lu.se/lup/publication/2341931.
[24] Alsaqqar, A.S., Khudair, B.H., Hasan, A.A. (2013). Application of water quality index and water suitability for drinking of the Euphrates River within Al-Anbar Province, Iraq. Journal of Engineering, 19(12): 1619-1633. https://doi.org/10.31026/j.eng.2013.12.08
[25] Satam, A.T.M., Mukhlef, W.H., Razzaq, A.S.A.A., Mushref, Z.J., Sulaiman, S.O. (2025). Spatial and temporal variations in water quality of the Euphrates River: A sustainable water management approach for Anbar Governorate, Iraq. International Journal of Design and Nature and Ecodynamics, 20(1): 99-106. https://doi.org/10.18280/ijdne.200111
[26] Hasham, G.J., Ramal, M.M. (2022). Water quality assessment of Euphrates River within Fallujah city using water quality indices technique. International Journal of Design & Nature and Ecodynamics, 17(4): 563-570. https://doi.org/10.18280/ijdne.170410
[27] Al-Ali, I.A., Al-Dabbas, M.A. (2022). Assessment of some organic and inorganic pollution indices, Euphrates River, Iraq. International Journal of Health Sciences, 6(S3): 12395-12417. https://doi.org/10.53730/ijhs.v6nS3.9484
[28] Al-Kubaisi, M.H.D., Al-Sumaidai, S.K. (2023). Evaluation of the suitability of the Euphrates River water for drinking and irrigation purposes in Haditha City, Western Iraq. Tikrit Journal of Pure Science, 27(6): 51-57. https://doi.org/10.25130/tjps.v27i6.758
[29] Alrawi, S.A., Jalal, A.D., Abdulhameed, U.H. (2025). Assessment of water quality in Euphrates River: Haditha Dam Reservoir as a case study, Anbar Province, Iraq. An-Najah University Journal for Research - A (Natural Sciences), 40(1). https://doi.org/10.35552/anujr.a.40.1.2426
[30] Salah, E.A.M., Al-Hiti, I.K., Alessawi, K.A. (2015). Assessment of heavy metals pollution in Euphrates River water, Amiriyah Fallujah, Iraq. Journal of Environment and Earth Science, 5(1): 87-95. https://www.iiste.org/Journals/index.php/JEES/article/view/25184.
[31] Al-Heety, E.A., Turky, A.M., Al-Othman, E.M. (2011). Physico-chemical assessment of Euphrates River between Heet and Ramadi cities, Iraq. Journal of Water Resource and Protection, 3(11): 812-823. http://doi.org/10.4236/jwarp.2011.311091
[32] Manea, M.H., Al-Tawash, B.S., Al-Saady, Y.I. (2019). Hydrochemical characteristics and evaluation of surface water of Shatt Al-Hilla, Babil Governorate, Central Iraq. Iraqi Journal of Science, 60(3): 583-600. https://ijs.uobaghdad.edu.iq/index.php/eijs/article/view/660.
[33] Luan, W., Li, X., Kuang, W., Su, J., Xue, H., Zhang, K., Zhu, J., Li, G. (2025). Quantitative assessment of the water stress in the Tigris–Euphrates River Basin driven by anthropogenic impacts. Remote Sensing, 17(4): 662. https://doi.org/10.3390/rs17040662
[34] Ahmed, Q.A., Al-Khafaji, M.S., Al-Jumeily, D. (2025). Application of artificial intelligence in sustainable management of rivers flow. Water Conservation & Management, 9(2): 233-248. http://doi.org/10.26480/wcm.02.2025.233.248
[35] Al-Ali, I.A., Al-Dabbas, M.A. (2022). The effect of variance discharge on the dissolved salts concentration in the Euphrates River upper reach, Iraq. Iraqi Journal of Science, 63(9): 3842-3853. https://doi.org/10.24996/ijs.2022.63.9.16
[36] Al-Alawy, I.T., Hasan, A.A., Daway, H.G. (2023). Measurement of natural radioactivity, cations, and heavy metals in Euphrates River at Elanbar Governorate, Iraq. Radiochemistry, 65: 387-396. https://doi.org/10.1134/S1066362223030153
[37] Taha, A.M.A., Shratooh, S.M., Jasim, A.H. (2023). Determination of bacterial pollution level in Euphrates River within Al-Anbar Province, Iraq. Iraqi Journal of Agricultural Research, 27(1): 74-88. https://ijarmoa.gov.iq/index.php/ijar/article/view/70.
[38] Oleiwi, A.S., Al-Dabbas, M. (2022). Assessment of contamination along the Tigris River from Tharthar–Tigris Canal to Azizziyah, middle of Iraq. Water, 14(8): 1194. https://doi.org/10.3390/w14081194
[39] Buhlool, M.A., Al-Rekabi, H.Y., Al-khafaji, B.Y. (2014). Applied of CCME Water quality index for evaluation of water quality of Euphrates River for irrigation purposes in Al-Nassiryia city. Thi-Qar Journal of Science, 4(3): 37-43. https://doi.org/10.32792/utq/utjsci/v4i3.629
[40] Ismael, S.A., Majeed, O.A., Akram, E., Aqeel, A., Mohammed, S. (2024). Study of the impact of high temperature of cooling water and hydrocarbon waste discharged from Musayyib thermal station to the Euphrates River using remote sensing stations. Al-Nahrain Journal of Science, 27(2): 20-27. fhttps://doi.org/10.22401/5nrk1s28
[41] Makki, I.M., Manii, J.K. (2020). Water quality index of Euphrates River near Al-Musayyab power plant. Iraqi Journal of Science, 61(11): 3002-3008. https://doi.org/10.24996/ijs.2020.61.11.21
[42] Salah, E.A.M., Zaidan, T.A., Al-Rawi, A.S. (2012). Assessment of heavy metals pollution in the sediments of Euphrates River, Iraq. Journal of Water Resource and Protection, 4(12): 1009-1023. https://doi.org/10.4236/jwarp.2012.412117
[43] Al-Dabbas, M.A., Al-Ali, I.A., Husain, M.M. (2024). Water quality assessment of the Euphrates River from Haditha to Al-Nasiriyah, Iraq. Iraqi Geological Journal, 57(2B). https://doi.org/10.46717/igj.57.2B.18ms-2024-8-28
[44] Al-Ghizzi, M.A.B. (2024). Euphrates River pollution: Acute and chronic toxicity revealed by bioassays. Central Asian Journal of Theoretical and Applied Sciences, 5(3): 126-131.
[45] Khlaif, B.M., Al-Hassany, J.S. (2024). Water quality assessment using a novel Iraqi water quality index for Euphrates River between Karbala and Babylon provinces as a case study. Baghdad Science Journal, 22(3): 15. https://doi.org/10.21123/bsj.2024.10179
[46] Salman, J.M. (2006). Environmental study of some possible pollutants in Euphrates River between Al-Hindia barrage and Al-Kufa. PhD thesis, College of Science, University of Babylon, Iraq.
[47] Kamel, L.H., Al-Zurfi, S.K.L., Mahmood, M.B. (2022). Investigation of heavy metals pollution in Euphrates River (Iraq) by using heavy metal pollution index model. IOP Conference Series: Earth and Environmental Science, 1029(1): 012034. https://doi.org/10.1088/1755-1315/1029/1/012034
[48] Alzurfi, S.K., Alasadi, K., Alausawi, S.A. (2018). Assessment of water quality status of Euphrates from Hindiya dam to Mishkab regulator – Iraq. Research Journal of Pharmacy and Technology, 11(1), 9–16. https://doi.org/10.5958/0974-360X.2018.00002.1
[49] Salman, J.M., Hussain, H.A. (2012). Water quality and some heavy metals in water and sediments of Euphrates River, Iraq. Journal of Environmental Science and Engineering, 1(9): 1088-1095.
[50] Kamel, A.H., Mahmood, M.B., Al-Zurfi, S.K. (2022). Assessment of heavy metal concentrations and pollution index in the Euphrates River between Al-Kifl and Kufa, Iraq. Mesopotamia Environmental Journal, 64(3): 1093-1108. https://doi.org/10.24996/ijs.2023.64.3.6
[51] Al Sharifi, S.R., Zwain, H.H., Hasan, Z.K. (2024). Evaluating surface water quality of Euphrates River in Al-Najaf Al-Ashraf, Iraq with Water Quality Index (WQI). Engineering, Technology & Applied Science Research, 14(4): 15022-15026. https://doi.org/10.48084/etasr.7681
[52] Abbas, A.A., Hassan, F.M. (2017). Water quality assessment of Euphrates River in Qadisiyah Province (Diwaniyah River), Iraq. Iraqi Journal of Agricultural Sciences, 49(2): 251-261. https://doi.org/10.26542/ijas.1028.49.2.152-162
[53] Al Mousawi, E., Jahad, U.A., Chabuk, A., Al Ansari, N., Majdi, A., Laue, J. (2023). Applying different water quality indices and GIS to assess the water quality: Case study—Euphrates River in Qadisiyah Province. Polish Journal of Environmental Studies, 32(5): 4201-4217. https://doi.org/10.15244/pjoes/163505
[54] Al-Khuzaie, M.M., Abdul Maulud, K.N., Wan Mohtar, W.H.M., Yaseen, Z.M. (2025). Modelling Euphrates River water quality index based on field measured data in Al-Diwaniyah City, Iraq. Scientific Reports, 15(1): 51. https://doi.org/10.1038/s41598-024-84072-1
[55] Al-Mutawqi, K.G., Al-Mayyahi, S.O.M. (2025). Hydrochemical and quality assessment of Euphrates River water between Al-Hindiya Barrage and Nasiriya City, Iraq. Iraqi National Journal of Earth Science, 25(2): 241-252. https://doi.org/10.33899/earth.2024.145159.1187
[56] Rahi, K.A., Halihan, T. (2010) Changes in the salinity of the Euphrates River System in Iraq. Regional Environment Change, 10: 27-35. https://doi.org/10.1007/s10113-009-0083-y
[57] Al-Silawy, Z.H., Al-Abbawy, D.A., Al-Mahmood, H.K.H. (2025). Assessment of Seasonal and Spatial Variation of Heavy Metals Concentrations in Shatt Al-Arab River, Basrah, Iraq. EnvironmentAsia, 18(2): 131-143. https://doi.org/10.14456/ea.2025.43
[58] Mawat, M., Hamdan, A.N. (2023). Review of mathematical surface water hydrodynamic/water quality models with their application on the Shatt Al Arab River, southern Iraq. European Journal of Engineering Science and Technology, 6(1): 30-49. https://doi.org/10.33422/ejest.v6i1.1057
[59] Muhammed, M., Al-Dabbas, M. (2022). Impact of climatic change and shortage of water flow on the Euphrates River water salinity between Al-Hindyia and Al-Nasiriya, Southern Iraq. The Iraqi Geological Journal, 139-152. https://doi.org/10.46717/igj.55.2A.10Ms-2022-07-26
[60] Khalaf, S.J., Musleh Sharqi, M., Almehemdi, A.F. (2025). Seasonal variations in the chemical and physical properties of the Euphrates River in Saqlawiya. Samarra Journal of Pure and Applied Science, 7(1): 157-168. https://doi.org/10.54153/sjpas.2025.v7i1.899
[61] Awed, S.T., Shihab, A.F. (2024). The effect of heavy water waste on the Euphrates River in increasing the concentration of some heavy metals. Procedia of Engineering and Life Science, 7(5): 745-754. https://doi.org/10.21070/pels.v7i0.1709
[62] Al-Kinani, H.A. (2024). Investigation of possible pollution by some trace elements and some environmental factors in water of the Euphrates River in Suq Al Shioukh Southern Iraq. Central Asian Journal of Medical and Natural Science, 5(4): 12-23. https://doi.org/10.51699/cajmns.v5i4.2509
[63] Oleiwi, A.S., Ismail, A.H., Saleh, R.A.Q., Al-Kubaisi, Q.Y., Al-Zuhairy, M.S. (2025). Integrated multivariate statistical and GIS analysis for water quality assessment of the Euphrates River between Samawah and Basra, Iraq. Environmental Science and Pollution Research, 32(3): 1545-1563. https://doi.org/10.1088/1755-1315/1507/1/012041
[64] Banat, K.M., Al-Rawi, Y.T. (1986). Hydrochemistry, clay minerals and carbonate of the Euphrates River in Iraq. Iraqi Journal of Science, 2: 18-28.
[65] Noori, M.M. (2020). Assessment of Euphrates River water quality and modeling spatial distribution of pollution zones. International Journal of Latest Engineering and Management Research, 5(10): 24-39.
[66] Abdulrazzak, I.A. (2025). Studying and assessment of water quality of Euphrates River in Iraq. Al-Iraqia Journal for Scientific Engineering Research, 4(1): 39-45. https://doi.org/10.58564/IJSER.4.1.2025.292