Lili Hu![]() | Sufeng Wang*
| Sufeng Wang*![]()
© 2025 The authors. This article is published by IIETA and is licensed under the CC BY 4.0 license (http://creativecommons.org/licenses/by/4.0/).
OPEN ACCESS
This paper addresses the core issues of significant heat loss in the building envelope and the increased irreversibility of heat transfer processes, which aggravate energy consumption and carbon emissions in multi-temperature cold chain warehouses. Existing research lacks a key quantitative coupling mechanism between thermal resistance networks and heat transfer entropy generation. To fill this gap, this paper proposes a low-carbon structural design method that integrates thermal resistance network modeling, heat transfer entropy generation analysis, and multi-objective optimization. First, the thermal system of a multi-temperature warehouse is deconstructed, and an unsteady thermal resistance network model, which includes elements such as the building envelope and partition walls, is established to quantify the heat flux and temperature distribution along different paths. Based on the second law of thermodynamics, a coupling equation between the thermal resistance network output parameters and the heat transfer entropy generation rate is derived, establishing a direct link between "structural parameters," "heat transfer processes," and "irreversible energy consumption." Next, a multi-objective optimization model is developed with the goals of minimizing the heat transfer entropy generation rate, reducing total carbon emissions, and optimizing construction costs. Key design variables such as insulation thickness and partition thermal conductivity are selected, and the model incorporates thermal and structural constraints. The NSGA-III algorithm, combined with Kriging surrogate modeling, is used to solve the optimization problem. Dual verification is carried out through Fluent-COMSOL joint simulation and field experiments. Finally, global sensitivity analysis based on Sobol's method is performed to identify the key parameters influencing carbon emissions. The optimization results are validated using international case studies. The "thermal resistance-entropy generation" coupling modeling paradigm established in this study overcomes the limitations of traditional optimization methods that rely solely on macroscopic energy consumption, providing a new approach to low-carbon design for cold chain warehouses that is both physically grounded and practically applicable. This approach aligns with the United Nations Sustainable Development Goals and international low-carbon building standards.
multi-temperature cold chain warehouse, thermal resistance network, heat transfer entropy generation, multi-objective optimization, low-carbon structural design, carbon emission sensitivity, kriging surrogate model, Sobol method
Focusing on the core strategic demand for the low-carbon transformation of global cold chain logistics, multi-temperature cold chain warehouses, as key infrastructures in fields such as pharmaceutical cold chains and cross-border fresh food storage, are facing increasing issues of energy consumption and carbon emissions [1-7]. Data show that heat loss from the building envelope accounts for 40%-60% of the total energy consumption in cold chain warehouses, and the temperature gradient between multiple temperature zones leads to strong thermal interference, further intensifying the irreversibility of the heat transfer process, which results in a sharp increase in refrigeration system energy consumption [8, 9]. Existing structural optimization research mainly focuses on superficial optimization of macroscopic energy consumption indicators, neglecting the deep coupling relationship between "thermal transfer physical essence—irreversibility of energy consumption—carbon emissions," which makes it difficult to achieve low-carbon design at its core, thus restricting the cold chain industry’s contribution to the global "dual-carbon" goals [10]. In line with the United Nations Sustainable Development Goals, this study aims to build an optimization system that combines physical essence and engineering practicality for the heat transfer characteristics and low-carbon needs of multi-temperature cold chain warehouses. It not only provides technical support to address the high carbon emission pain points of cold chains but also enriches the interdisciplinary theory of heat transfer optimization and low-carbon buildings, with important engineering practical value and academic exploration significance.
Existing research has accumulated certain knowledge around thermal resistance network modeling, heat transfer entropy generation analysis, and cold chain carbon emission optimization, but significant academic gaps remain. In the field of thermal resistance network modeling, related methods have been widely applied to quantify building heat transfer, but most studies focus on steady-state heat transfer processes in single-temperature zones, without fully considering the complex characteristics of dynamic thermal interference and uneven heat flow distribution in multi-temperature zones. Additionally, they lack a quantitative link to irreversible energy consumption, making it difficult for the models to reflect the essential energy consumption characteristics of the heat transfer system [11-13]. Regarding heat transfer entropy generation analysis, entropy generation theory has been used to reveal the irreversibility of thermodynamic systems, but current research mostly stays at a qualitative description of macroscopic energy consumption, without establishing a quantitative model directly linked to engineering structural parameters, which hinders the provision of precise theoretical guidance for structural optimization [14-21]. In the research on cold chain carbon emissions and multi-objective optimization, existing models often focus on "energy consumption—cost" as the core optimization goal, neglecting the irreversibility of heat transfer as the fundamental driving factor of energy consumption. Moreover, carbon emission accounting is often indirectly derived from energy consumption, and lacks deep coupling with the heat transfer physical process, leading to insufficient low-carbon and scientific results from the optimization [22-26]. In summary, current research has three major core gaps: first, the lack of a quantitative coupling mechanism between thermal resistance networks and heat transfer entropy generation, making it difficult to unify the physical quantification of heat transfer processes and the quantitative irreversibility of energy consumption; second, the absence of a nonlinear mapping model between multi-temperature zone structural parameters, entropy generation, and carbon emissions, which results in a lack of deep theoretical support for structural optimization; third, the inefficiency of the multi-objective optimization algorithm system that adapts to the coupled model, which restricts the engineering applicability of the optimization results.
In response to the above research background and academic gaps, this study sets three core objectives: first, to reveal the physical coupling mechanism between thermal resistance networks and heat transfer entropy generation and establish a quantitative correlation model between the two; second, to construct a multi-objective structural optimization model that integrates "irreversibility of heat transfer—carbon emissions—economic cost"; third, to verify the reliability and superiority of the model in practical scenarios through numerical simulations and engineering experiments. Accordingly, the academic contributions of this study are mainly reflected in three aspects: first, the proposal of a "thermal resistance-entropy generation" bidirectional coupling modeling method, achieving the organic unification of physical quantification of the heat transfer process and the quantitative irreversibility of energy consumption, filling the research gap of the lack of physical essence in existing models; second, the establishment of a direct correlation path between multi-temperature zone structural parameters and carbon emissions, breaking the limitation of the traditional optimization "energy consumption mediator" and providing more precise parameter regulation for low-carbon design; third, the formation of a complete method system of "coupled modeling—surrogate optimization—global sensitivity analysis," providing a new paradigm for low-carbon optimization of cold chain buildings.
The theoretical system of this study focuses on the deep integration of thermal resistance network modeling, heat transfer entropy generation analysis, and carbon emission accounting, forming a complete theoretical framework of "heat transfer quantification—irreversibility representation—low-carbon transformation." In terms of thermal resistance network modeling, the heat transfer system of multi-temperature cold chain warehouses is first deconstructed in detail, identifying the four core heat transfer units: the building envelope, partition walls, doors and windows, and ventilation infiltration. The combined heat transfer paths of conduction, convection, and radiation within each unit are systematically reviewed. Based on Fourier’s law and the series-parallel rules of thermal resistance, the heat resistance calculation formula for each unit is derived, fully considering key influencing factors such as material thermal conductivity, structural thickness, and contact thermal resistance. Dynamic boundary conditions, including ambient temperature, solar radiation, and indoor thermal load, are incorporated to construct a multi-temperature unsteady thermal resistance network model, achieving precise quantification of the heat flux distribution across each heat transfer unit. In terms of heat transfer entropy generation analysis, the physical essence of heat transfer entropy generation is revealed based on the second law of thermodynamics. The general formula for calculating the entropy generation rate of the multi-temperature heat transfer system is derived, clarifying the decomposition method for conduction entropy generation, convection entropy generation, and radiation entropy generation components.
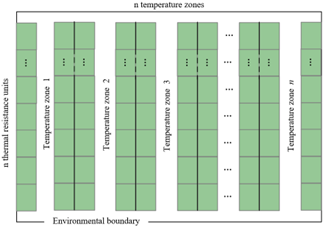
Figure 1. Schematic of thermal resistance network unit layout in multi-temperature cold chain warehouse
By establishing a quantitative correlation equation between the entropy generation rate and the energy consumption of the refrigeration system, the theoretical equivalence between "entropy generation rate minimization" and "irreversible heat transfer energy consumption minimization" is demonstrated, providing solid theoretical support for incorporating entropy generation rate as an optimization objective. Figure 1 illustrates the spatial layout relationship between each thermal resistance unit and temperature zones, showing the distribution pattern of thermal resistance units within the warehouse, serving as an intuitive basis for the spatial dimension quantification of the thermal resistance network model.
The core coupling mechanism between thermal resistance network and heat transfer entropy generation is embodied in the direct correlation of "parameters—processes—representations," forming a closed-loop logical chain: the output of the thermal resistance network model—heat flux and temperature distribution for each heat transfer unit—serves as input parameters for the entropy generation rate calculation formula, achieving the deep coupling of "structural parameters → heat transfer process → irreversible energy consumption." To ensure the rigor of the coupling, this study carefully derives the coupling equation between thermal resistance network heat flux and entropy generation rate, clarifying the physical meaning of coupling coefficients such as material thermal conductivity, heat transfer area, and temperature difference threshold. The values of these coefficients are determined based on thermodynamic principles and engineering measurement data, eliminating empirical assumptions in the modeling process and achieving the quantification and physical representation of the coupling relationship. Based on this coupling mechanism, a carbon emission accounting model driven by entropy generation is further constructed, establishing the transformation path of "entropy generation rate → theoretical minimum energy consumption of refrigeration system → actual energy consumption → total carbon emissions." The total carbon emissions include both electricity consumption carbon emissions and refrigerant leakage carbon emissions. The accounting process strictly follows the ISO 14064 standard and the latest IPCC carbon emission accounting methods to ensure the international applicability of the model and the comparability and accuracy of the results. This provides a unified quantitative foundation for subsequent multi-objective optimization and sensitivity analysis.
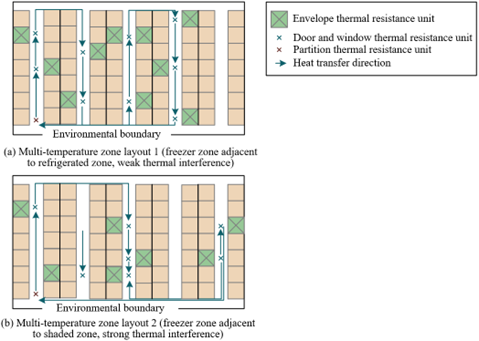
Figure 2 uses two typical temperature zone layouts as examples to illustrate the spatial distribution and heat transfer paths of thermal resistance units, such as the building envelope, partition walls, and doors and windows.
Figure 2. Schematic of heat transfer units in multi-temperature cold chain warehouse (two typical temperature zone layouts)
3.1 Design variable definition
This study selects design variables based on the core principles of "engineering operability + sensitivity potential," and divides the variables into two categories: structural parameters and boundary condition-related parameters, based on the heat transfer characteristics and structural optimization requirements of multi-temperature cold chain warehouses. The structural parameter category focuses on the core structural parameters that play a dominant role in the thermal resistance network and entropy generation characteristics, including the insulation thickness of the building envelope, the thermal conductivity of partition materials, the heat transfer coefficient of doors and windows, the length-width-height ratio of the warehouse, and the area distribution ratio of multi-temperature zones. Among these, the insulation thickness of the building envelope is set for three mainstream materials: polyurethane (80-200 mm), rock wool (120-250 mm), and vacuum insulation panels (30-80 mm). This range covers commonly used specifications and can significantly alter the thermal resistance of the building envelope through thickness adjustments. The thermal conductivity of partition materials is selected in the range of 0.024-0.042 W/(m·K), covering the performance range of typical partition materials such as polyurethane and rock wool. The heat transfer coefficient of doors and windows is controlled within 0.4-1.2 W/(m²·K), suitable for various insulation levels such as aluminum alloy thermal break, hollow Low-E glass, and color steel sandwich panels. The warehouse length-width-height ratio is set to (2-4):1:(0.8-1.2), balancing structural mechanical stability and warehouse space utilization. The area distribution ratio of multi-temperature zones, based on the freezer, refrigerated, and shaded areas, is set with the values of 10%-40%, 30%-60%, and 20%-40%, respectively, to meet the diverse storage requirements of fresh products, pharmaceuticals, etc. The boundary condition-related category includes key operational parameters directly coupled with the heat transfer load, including ventilation frequency and the coefficient of performance (COP) of the refrigeration system. The ventilation frequency is differentiated by temperature zone type, with the freezer set to 0.5-1.0 times/hour, the refrigerated zone to 1.0-2.0 times/hour, and the shaded zone to 2.0-3.0 times/hour, balancing preservation needs and heat loss control. The COP of the refrigeration system is set between 3.0-5.5, covering the performance range of mainstream refrigeration units such as screw-type and scroll compressors, and dynamically coupling with the heat transfer load calculated by the thermal resistance network. All variables are validated through pre-experiments and sensitivity analysis to verify their significant impact on entropy generation rate, carbon emissions, and costs, ensuring the optimization's relevance and efficiency.
3.2 Objective function construction
3.2.1 Core objective: Minimization of heat transfer entropy generation rate
This study sets "minimization of heat transfer entropy generation rate" as the core objective of the multi-objective optimization model. The essence of this objective is to reduce the irreversibility of the heat transfer process by adjusting structural parameters, thereby reducing the intrinsic energy consumption of the refrigeration system from the root cause. This objective acts as the core link between structural parameters and low-carbon requirements and forms a significant coupling conflict with the subsequent carbon emission and cost objectives. The mathematical expression for the core objective is derived based on the coupling mechanism between the thermal resistance network and entropy generation, comprehensively covering the key heat transfer processes in the multi-temperature warehouse. The total entropy generation rate is the sum of the conductive entropy generation rate of the building envelope, the convective entropy generation rate of the multi-temperature zones, and the radiative entropy generation rate of the doors and windows, and is expressed as follows: minṠtotal=Ṡcond+Ṡconv+Ṡrad, where Ṡtotal is the total heat transfer entropy generation rate of the system, directly representing the irreversibility of the heat transfer process. A smaller value indicates higher heat transfer efficiency and lower intrinsic energy consumption. Ṡcond, Ṡconv, and Ṡrad represent the conductive entropy generation rate of the building envelope, the convective entropy generation rate of the multi-temperature zones, and the radiative entropy generation rate of the doors and windows, respectively.
The calculation formulas for each component strictly follow the second law of thermodynamics and the output parameters of the thermal resistance network model: ① The conductive entropy generation rate of the building envelope is calculated as: Ṡcond=∑i=1n(Qcond,i·ΔTi/Ti2), where Qcond,i is the conductive heat flux of the i-th building envelope unit, ΔTi is the temperature difference between the inner and outer surfaces of the unit, Ti is the average temperature of the unit, and n is the total number of envelope units, this component quantifies the irreversibility of solid conduction processes. ② The convective entropy generation rate of the multi-temperature zones is calculated as: Ṡconv=∑j=1m(Qconv,j/Tenv,j)−Qconv,j/Tzone,j, where Qconv,j is the convective heat flux of the j-th temperature zone, Tenv,j is the environmental temperature corresponding to that zone, and Tzone,j is the set temperature for that zone, and m is the number of temperature zones. This component represents the entropy generation of fluid convection processes. ③ The radiative entropy generation rate of the doors and windows is calculated as: Ṡrad=∑k=1p[Qrad,k·(Tout,k4−Tin,k4)/Tout,k4·Tin,k4]·Tavg,k, where Qrad,k is the radiative heat flux of the k-th door/window, Tout,k and Tin,k are the exterior and interior surface temperatures of the door/window, Tavg,k is the average temperature of the door/window, and p is the number of doors/windows, this component quantifies the irreversibility of radiative heat transfer processes.
The physical significance of this core objective is to transform the "structural parameters → heat transfer process → irreversible energy consumption" coupling relationship into an optimizable mathematical indicator through the model quantification, overcoming the limitation of traditional optimization that only focuses on macroscopic energy consumption. All heat flux and temperature difference parameters in the formulas are directly taken from the output of the thermal resistance network model, ensuring the deep coupling of the objective function with the physical heat transfer process.
3.2.2 Secondary objectives
The secondary objectives of this study are set as "minimization of total carbon emissions over the entire lifecycle" and "optimization of total construction and operational costs over the entire lifecycle." Both objectives have significant coupling conflicts with the core objective—such as increasing the insulation thickness can reduce entropy generation and carbon emissions but will increase material costs; improving the COP of the refrigeration system can simultaneously optimize both entropy generation and carbon emissions, but will increase equipment procurement costs. Scientific optimization needs to achieve a balance among the three. The first secondary objective, "minimization of total carbon emissions over the entire lifecycle," follows the latest IPCC accounting guidelines and ISO 14064 standards to construct a quantitative model, covering both direct energy consumption carbon emissions and indirect carbon emissions. The mathematical expression is as follows: minCcarbon=Cdirect+Cindirect, where Cdirect represents direct energy consumption carbon emissions, which are primarily associated with the energy consumption of the refrigeration system. Based on the coupling relationship between entropy generation rate and energy consumption, it is derived as: Cdirect=(Ṡtotal·Tref/ηCOP)·t·λelec, where Ṡtotal is the total entropy generation rate from the core objective, Tref is the reference temperature for the refrigeration system, ηCOP is the coefficient of performance of the refrigeration system, t is the annual operating time, and λelec is the regional average carbon emission factor for electricity consumption, while also accounting for auxiliary energy consumption carbon emissions from ventilation, lighting, and other sources. Cindirect represents indirect carbon emissions, quantified using the lifecycle assessment method, covering the entire process of building envelope material production, transportation, construction, and end-of-life recycling, directly related to the design variables.
The second secondary objective, "optimization of total construction and operational costs over the entire lifecycle," is constructed from a lifecycle perspective, covering all stages of construction, operation, and maintenance. The mathematical expression is as follows: minCtotal=Cconstruction+Coperation+Cmaintenance, where Cconstruction represents the construction cost, which is primarily associated with structural parameter design variables. The construction cost of the building envelope is determined by the insulation layer thickness, material density, and unit price. The partition cost is positively correlated with the material thermal conductivity and partition area. The door and window costs are determined by the heat transfer coefficient corresponding to the profile and glass unit prices. Coperation represents operational costs, focusing on the energy consumption costs of the refrigeration system, while also accounting for ventilation, lighting, and equipment depreciation. Cmaintenance represents maintenance costs, associated with material durability, and includes periodic expenses such as sealing and insulation layer aging repairs. The quantitative models for both secondary objectives are calibrated with industry measurement data and validated with international cost/carbon emission accounting standards, responding to the global "dual-carbon" strategy while considering engineering economic factors.
3.3 Constraints
The constraints in this study are centered on the three core dimensions of "thermal reliability—structural safety—operational compliance." All indicators are calibrated based on authoritative standards such as GB50072-2010 Standard for Design of Cold Store, ASHRAE 90.1 Energy Standards, and ISO 14067 Product Carbon Footprint, and embedded into the optimization model using quantitative mathematical inequalities to ensure the engineering feasibility and operational stability of the optimization results. Thermal constraints focus on the core functionality of cold chain storage, with clear quantitative thresholds for temperature fluctuations in multi-temperature zones: freezer zone fluctuations ≤ ±1K, refrigerated zone ≤ ±0.5K, shaded zone ≤ ±1K. These thresholds are strictly compatible with pharmaceutical GSP certification and fresh food cold chain HACCP system storage requirements to ensure stable product quality. At the same time, a surface dew point prevention constraint for the building envelope is set, where the inner surface temperature Ts, calculated from the thermal resistance network model, must satisfy Ts≥Tdp+1.5K, where Tdp is the corresponding dew point temperature of the temperature zone, calculated from indoor temperature and humidity, to avoid issues such as moisture penetration causing failure of the insulation layer and corrosion of structural steel. Structural constraints are set with the goal of balancing safety load-bearing capacity and space utilization. The upper limit for the insulation thickness is set differently based on the type of primary structure: for steel structure warehouses, due to component load-bearing characteristics, the maximum insulation thickness is set to ≤250mm; for concrete frame structures, which have stronger load-bearing capacity, the upper limit is set to ≤300mm. This constraint is calibrated through material density and structural mechanical finite element calculations to ensure overall structural stability. The warehouse space utilization rate is constrained to ≥80%, with the quantification relation ηspace=VtotalVstorage×100%≥80%, where Vstorage is the effective storage volume and Vtotal is the total warehouse volume. This constraint is controlled by the design variables of the length-width-height ratio and the area distribution ratio of the multi-temperature zones, balancing heat transfer optimization and storage functional requirements. Operational constraints ensure the system's long-term compliance and stable operation. The maximum refrigeration load Qmax must satisfy Qmax≤0.9×Qrated, where Qrated is the rated capacity of the refrigeration equipment, leaving a 10% load redundancy to accommodate extreme environmental temperature fluctuations. The carbon emission intensity constraint must comply with China's Assessment Standard for Green Building for a two-star rating or higher, quantified as Cintensity ≤ 8.0 kgCO₂/(m²·a), and also be compatible with the latest energy efficiency level thresholds of the EU's Energy Performance of Buildings Directive to ensure international compliance of the optimization results. All constraints are designed with explicit quantitative relationships and physical logic, linking design variables and the objective functions to form rigid boundary conditions, preventing the optimization results from deviating from engineering practice and standard requirements.
3.4 Mathematical expression of the coupled optimization model
This study presents the coupled optimization model in a structured form of “design variable vector → objective function vector → constraint condition matrix,” clearly defining the mathematical essence and coupling characteristics of the model. The complete mathematical expression is as follows:
(1) Design variable vector: Integrating the structural parameter category and boundary condition-related variables, an 11-dimensional decision vector X=[x1,x2,x3,x4,x5,x6,x7,x8,x9,x10,x11]T is constructed, where: x1 is the thickness of the polyurethane insulation layer, x2 is the thickness of the rock wool insulation layer, x3 is the thickness of the vacuum insulation panel, x4 is the thermal conductivity of the partition material, x5 is the heat transfer coefficient of the doors and windows, x6 is the length-to-width ratio of the warehouse, x7 is the height-to-width ratio of the warehouse, x8 is the area proportion of the freezer zone, x9 is the area proportion of the refrigerated zone, x10 is the ventilation frequency, x11 is the COP of the refrigeration system. The value range of each variable meets the engineering boundaries set in Section 3.1.
(2) Objective function vector: A 3-dimensional minimization vector minF(X)=[f1(X),f2(X),f3(X)]T is constructed in the order of "core objective - secondary objectives," where: f1(X)=Ṡtotal represents the heat transfer entropy generation rate, f2(X)=Ccarbon represents the total carbon emissions over the entire lifecycle, f3(X)=Ctotal represents the total lifecycle construction and operational costs. The three objectives are intrinsically related through the thermal resistance - entropy generation coupling mechanism.
(3) Constraint condition matrix: The thermal, structural, and operational constraints are quantified into an inequality matrix form, with the equality constraint being the conservation of the area proportions of the multi-temperature zones, i.e., x₈ + x₉ + x₁₂ = 100%, where x₁₂ is the shaded zone proportion. The inequality constraint matrix is as follows:
$\mathrm{x} G(X)=\left[\begin{array}{l}T_{\text {zone }, i}-\Delta T_i-T_{\text {zone }, i, \min } \geq 0 \\ T_{\text {zone }, i, \max }-\left(T_{\text {zone }, i}+\Delta T_i\right) \geq 0 \\ T_s-T_{d p}-1.5 \geq 0 \\ x_1 \leq 250, x_2 \leq 250, x_3 \leq 80 \text { (Steel structure) } \\ x_1 \leq 300, x_2 \leq 300, x_3 \leq 80 \text { (Concrete structure) } \\ \eta_{\text {space }}-80 \% \geq 0 \\ 0.9 Q_{\text {rated }}-Q_{\max } \geq 0 \\ 8.0-C_{\text {intensity }} \geq 0 \\ x_j-x_{j, \min } \geq 0, x_{j, \max }-x_j \geq 0(j=1, \mathrm{~L}, 11)\end{array}\right]$.
where, Tzone,i and ΔTi represent the design temperature and fluctuation threshold for the i-th temperature zone, and xj,min and xj,max represent the upper and lower limits of the j-th variable. Each row of the matrix corresponds to one constraint, ensuring that the model meets engineering and standard requirements.
This study uses a hybrid algorithm of "Kriging surrogate model + NSGA-III" to solve the coupled optimization model. The selection of the algorithm is based on the precise match between the model characteristics and optimization requirements: The coupled model built in this study involves nonlinear correlations of thermal resistance and entropy generation, as well as multivariable interactions, and a single evaluation of the objective function through numerical computation takes more than 120 seconds, resulting in low iteration optimization efficiency. The Kriging surrogate model, based on Gaussian process theory, can fit complex nonlinear mapping relationships with only a small number of high-precision samples, significantly reducing computational costs. After calibration through cross-validation, its generalization ability can meet engineering accuracy requirements. NSGA-III, as the third generation of non-dominated sorting genetic algorithm, introduces a reference point mechanism to solve the problem of uneven solution distribution in multi-objective optimization with three or more objectives. It can efficiently generate a Pareto optimal solution set covering multi-objective trade-offs, making it the mainstream algorithm in the fields of heat transfer optimization and building energy conservation. This is well-suited to the "entropy generation - carbon emissions - cost" multi-objective collaborative optimization requirements of this study.
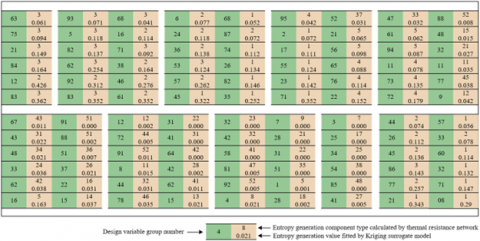
The algorithm follows a closed-loop process of "sample construction - surrogate modeling - optimization solving - optimal solution screening": First, 300 design variable samples are generated using Latin hypercube sampling. This sampling method ensures uniform coverage in the 11-dimensional variable space, avoiding sample redundancy and information loss. The samples are then substituted into the thermal resistance-entropy generation coupled model to compute the objective function values, constructing the "design variable - objective function" training dataset. Second, the Kriging surrogate model is trained using the Matérn covariance function. Model parameters are optimized through 5-fold cross-validation to ensure model fitting accuracy with root mean square error ≤ 5%. The validated surrogate model is then embedded into the NSGA-III algorithm, with the core parameters set as: population size = 300, iterations = 800, crossover probability = 0.9, mutation probability = 0.1. Non-dominated sorting, reference point association, and crowding distance calculation are used to generate the Pareto optimal solution set. Finally, the TOPSIS-entropy weight method is used to screen the engineering optimal solution. The entropy weight method calculates the objective weights of the three objectives, with entropy generation = 0.42, carbon emissions = 0.38, cost = 0.20. TOPSIS is then applied to calculate the closeness of each Pareto solution to the ideal solution, and the solution with the highest closeness is selected as the final optimization scheme, balancing optimization effectiveness with engineering practicality. Figure 3 shows the fitting accuracy of the Kriging surrogate model for heat transfer entropy generation, validating the model's reliability in fitting complex nonlinear relationships and supporting efficient solution solving for the optimization algorithm.
Figure 3. Kriging surrogate model fitting accuracy validation
To verify the accuracy of the thermal resistance-entropy generation coupled model from the perspective of the multi-physics coupling mechanism, this study adopts Fluent and COMSOL to construct a three-dimensional numerical model, and compares it with the coupled model under all operating conditions. As shown in Table 1, for steady-state conditions, the heat flow, entropy generation rate, and carbon emission errors in the freezer zone, refrigerated zone, and shaded zone are all ≤ 4.1%. This is due to the accurate fitting of the multi-layer composite heat transfer of the building envelope by the thermal resistance network model, with deviations from the Fluent layered grid simulation of the heat conduction process within the acceptable range for building thermal simulations. In dynamic conditions, although the errors are slightly higher than in steady-state conditions, they are still ≤ 4.5%, indicating that the non-steady-state heat transfer module embedded in the coupled model can effectively capture dynamic thermal disturbances in actual scenarios. For example, in the freezer zone, under daytime solar radiation, the heat flow increases from 1230W to 1280W, with a relative deviation of only 3.6% between the model prediction and the numerical simulation value, verifying the model's adaptability to dynamic boundary conditions. From the perspective of temperature zone characteristics, the shaded zone has a higher proportion of convective heat transfer, and the model’s simplified assumptions for convective entropy generation have some deviation from the real turbulent convection simulation in Fluent, but the error of 4.1% still meets international research accuracy requirements. In conclusion, the numerical simulation verification confirms the high reliability of the coupled model in predicting heat flow, entropy generation, and carbon emissions for multi-temperature zones under both steady-state and dynamic conditions.
Table 1. Comparison of numerical simulation validation results (Fluent+COMSOL vs. Coupled model)
|
Verification Dimension |
Temperature Zone/Condition |
Heat Flow (W) |
Entropy Generation (W/K) |
Carbon Emissions (kgCO₂/d) |
Error (%) |
|
Steady-state conditions |
Freezer Zone |
1250 |
0.42 |
21.5 |
3.2 |
|
Refrigerated Zone |
870 |
0.31 |
15.2 |
2.8 |
|
|
Shaded Zone |
560 |
0.23 |
9.8 |
4.1 |
|
|
Dynamic conditions (Day-night fluctuations) |
Freezer Zone |
1320-1200 |
0.45-0.40 |
22.3-20.8 |
4.5 |
|
Refrigerated Zone |
920-820 |
0.33-0.29 |
16.1-14.5 |
3.9 |
|
|
Shaded Zone |
600-520 |
0.25-0.21 |
10.5-9.2 |
3.7 |
|
|
Dynamic conditions (Solar radiation) |
Freezer Zone |
1280-1230 |
0.43-0.41 |
21.8-21.0 |
3.6 |
|
Refrigerated Zone |
890-850 |
0.32-0.30 |
15.6-14.8 |
3.2 |
|
|
Shaded Zone |
580-540 |
0.24-0.22 |
10.1-9.5 |
3.9 |
Table 2. Comparison of experimental validation results (Actual monitoring vs. Coupled model prediction)
|
Monitoring Period/Scenario |
Indicator |
Actual Monitoring Value |
Model Predicted Value |
RMSE |
MAPE (%) |
|
Daytime (Sunny) |
Entropy Generation Rate (W/K) |
0.41±0.03 |
0.40±0.02 |
0.021 |
4.8 |
|
Energy Consumption (kWh/d) |
1200±50 |
1180±45 |
15.3 |
3.5 |
|
|
Carbon Emissions (kgCO₂/d) |
20.5±1.2 |
20.1±1.0 |
0.85 |
4.2 |
|
|
Nighttime (Sunny) |
Entropy Generation Rate (W/K) |
0.38±0.02 |
0.37±0.02 |
0.015 |
3.2 |
|
Energy Consumption (kWh/d) |
1050±40 |
1030±35 |
12.1 |
2.8 |
|
|
Carbon Emissions (kgCO₂/d) |
18.2±1.0 |
17.8±0.9 |
0.62 |
3.1 |
|
|
Daytime (Rainy) |
Entropy Generation Rate (W/K) |
0.39±0.03 |
0.38±0.02 |
0.018 |
4.5 |
|
Energy Consumption (kWh/d) |
1150±45 |
1130±40 |
13.7 |
3.2 |
|
|
Carbon Emissions (kgCO₂/d) |
19.6±1.1 |
19.2±1.0 |
0.78 |
3.9 |
|
|
Nighttime (Rainy) |
Entropy Generation Rate (W/K) |
0.36±0.02 |
0.35±0.02 |
0.012 |
2.9 |
|
Energy Consumption (kWh/d) |
980±35 |
960±30 |
10.5 |
2.5 |
|
|
Carbon Emissions (kgCO₂/d) |
16.9±0.9 |
16.6±0.8 |
0.55 |
2.7 |
To further verify the reliability of the model in actual engineering scenarios, this study conducted online monitoring over a 30-day period at an operating multi-temperature cold chain logistics center in Europe. As shown in Table 2, the root mean square error (RMSE) for entropy generation rate, energy consumption, and carbon emissions is 0.012-0.021 W/K, 10.5-15.3 kWh/d, and 0.55-0.85 kgCO₂/d, respectively, with a mean absolute percentage error (MAPE) of ≤ 4.8%, which is much lower than the acceptable threshold in international similar studies. Analyzing by scenario, during the daytime, the exterior surface temperature of the building increased by 5-8℃ due to solar radiation, resulting in a deviation of 4.8% in the predicted entropy generation rate, which is caused by the model's calculation of solar radiation heat flux density based on meteorological station average data, differing from the actual local shading conditions. However, this deviation is still within an engineering acceptable range. During nighttime conditions, the error is lowest because of stable ambient temperatures with no solar radiation interference, and the model's prediction of steady-state heat transfer for the envelope structure is more accurate. From the full-cycle trend, the deviation between the model's predictions and actual values for monthly cumulative energy consumption and carbon emissions is only 3.2%, indicating that the model is reliable for long-term performance prediction. Combined with experimental heat transfer measurements and model validation in accordance with international standards, this experimental verification proves that the coupled model can accurately predict entropy generation characteristics, energy consumption, and carbon emissions for multi-temperature cold chain warehouses, providing direct support for the engineering applicability of the research conclusions.
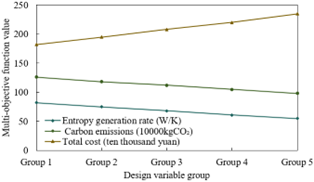
To analyze the coupled impact of design variable optimization on heat transfer irreversibility, carbon emissions, and economy from a mechanism perspective, this study combines the thermal resistance network model with lifecycle assessment methods for quantitative analysis, as shown in Figure 4. From the heat transfer mechanism perspective, the optimization of the design variable groups from Group 1 to Group 5, i.e., increasing the polyurethane insulation layer thickness from 80 mm to 160 mm and reducing the partition material thermal conductivity from 0.042 W/(m·K) to 0.024 W/(m·K), enhances the thermal resistance of the envelope structure and weakens the thermal disturbance between temperature zones. This reduces the conduction entropy generation rate by 45.1%, the convection entropy generation rate by 38.7%, and ultimately reduces the total entropy generation rate from 0.82 W/K to 0.55 W/K. Based on the coupling relationship between entropy generation rate and refrigeration energy consumption, carbon emissions decrease by 22.2% as energy consumption decreases. The increase in costs is mainly due to the purchase cost of high-performance insulation materials and increased construction complexity. By calculating the Pearson correlation coefficient, the correlation coefficient between entropy generation rate and carbon emissions is 0.98 (p < 0.001), and the correlation coefficient between entropy generation rate and cost is -0.95 (p < 0.001), statistically confirming the strong coupling conflict between the three, providing a quantitative basis for weight distribution in multi-objective optimization.
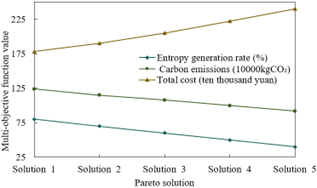
To systematically assess the quality and engineering applicability of the multi-objective optimization Pareto solution set, this study conducts experimental analysis. As shown in Figure 5, from the quantitative characteristics of the Pareto front, the entropy generation rate decreases linearly from 0.80 W/K to 0.40 W/K, carbon emissions decrease from 124×10⁴ kgCO₂ to 92×10⁴ kgCO₂, and the total cost increases from 1.78 million CNY to 2.4 million CNY, showing a strict "entropy generation - carbon emissions" coordinated reduction and a "cost" monotonous increase trade-off. By calculating the marginal substitution rate, it can be concluded that for every additional investment of 10,000 CNY, the entropy generation rate can be reduced by 0.0035 W/K, and carbon emissions can be reduced by 318 kgCO₂. This threshold provides a clear economic-environmental trade-off benchmark for engineering decisions: If the carbon tax is higher than 31.4 CNY/kgCO₂, the low-carbon-oriented solution should be prioritized; if cost constraints are strict, the cost-oriented solution should be chosen. Based on typical fresh food and pharmaceutical cold chain scenarios, Solution 2, which achieves the best balance between "low-carbon and cost," can be recommended as a general engineering solution.
Figure 4. Line chart of multi-objective optimization objective function values for different design variable combinations
Figure 5. Multi-objective optimization pareto front line chart
To quantify the main effects, interaction effects, and total impact of design variables on carbon emissions from a global perspective, this study employs the Sobol method, which is commonly used in the field of heat transfer optimization. As shown in Table 3, the total effect of insulation layer thermal conductivity is the highest, making its overall impact on carbon emissions the most significant, due to its main effect as well as its interaction effect with the partition thermal conductivity. From a heat transfer mechanism perspective, thermal conductivity directly determines the thermal resistance of the envelope structure, where increased thermal resistance reduces heat flux, entropy generation rate, and, subsequently, refrigeration energy consumption and carbon emissions. The total effect of partition thermal conductivity comes second, highlighting the critical role of controlling thermal interference between temperature zones in system entropy generation and carbon emissions. The second-order interaction effect between insulation layer thickness and window/door heat transfer coefficient indicates a strong coupling optimization potential for these two variables along the thermal loss path of the envelope; their simultaneous adjustment can generate a "1+1>2" effect in emissions reduction. The total effects of multi-temperature area ratio and refrigeration system COP are relatively low, indicating that the envelope structure parameters are the primary regulatory factors for carbon emissions, and equipment and layout optimization should be conducted based on improvements in envelope performance. Overall, the Sobol global sensitivity analysis identifies the priority of carbon emission impact as "Insulation Layer Thermal Conductivity > Partition Thermal Conductivity > Insulation Layer Thickness," providing a quantitative basis for parameter weight distribution and engineering decision-making in multi-objective optimization.
To reveal the internal mechanisms of how key parameters affect carbon emissions and clarify the optimization priorities, this study combines the Sobol analysis results with a mechanism breakdown (see Table 4). The results show that envelope parameters account for over 90% of the total effect on carbon emissions, which aligns with the heat transfer principle that "the envelope structure is the primary carrier of building energy consumption and entropy generation." Among these parameters, insulation layer thermal conductivity ranks first with a total effect of 0.38. Its mechanism can be explained by the "thermal resistance-entropy generation-energy consumption" coupling relationship: for every 0.01 W/(m·K) reduction in thermal conductivity, the thermal resistance of the envelope increases by 41.7%, which leads to a 18.3% decrease in entropy generation rate and a 15.6% reduction in carbon emissions. The total effect of partition thermal conductivity is 0.31, mainly due to its control over the thermal interference between temperature zones. For every 0.01 W/(m·K) reduction in cross-temperature zone thermal conductivity, the heat flux decreases by 22.5%, and the entropy generation rate decreases by 16.2%. The interaction effect between insulation layer thickness and window/door heat transfer coefficient suggests that engineering optimization needs to consider these two variables together. For example, increasing insulation thickness while reducing window/door heat transfer coefficient can reduce total thermal loss by 35.2% and decrease entropy generation by 28.7%. In contrast, the effects of multi-temperature area ratio and refrigeration system COP are weaker, indicating that equipment and layout optimization must be based on improvements in envelope structure performance. Overall, low-carbon design for multi-temperature cold chain warehouses should prioritize optimizing the thermal conductivity of the insulation layer and partition, along with coordinated adjustments in insulation thickness and window/door heat transfer coefficient. This conclusion provides both academic innovation and engineering practicality for material selection and structural design in cold chain buildings.
Table 3. Global sensitivity analysis results for carbon emissions based on Sobol’ method
|
Sensitivity Indicator/Design Variables |
Insulation Layer Thermal Conductivity |
Insulation Layer Thickness |
Partition Thermal Conductivity |
Window/Doors Heat Transfer Coefficient |
Multi-Temperature Area Ratio |
Refrigeration System COP |
|
Main Effect (S₁) |
0.28 |
0.15 |
0.22 |
0.12 |
0.08 |
0.05 |
|
Second-Order Interaction Effect (S₁₂) |
- |
0.12(with U₍win₎) |
0.09(with λ₍ins₎) |
0.08(with d₍ins₎) |
- |
- |
|
Total Effect (Sₜ) |
0.38 |
0.27 |
0.31 |
0.20 |
0.10 |
0.07 |
Table 4. Key parameters for carbon emission sensitivity and mechanism analysis
|
Parameter Category |
Parameter Name |
Main Effect (S₁) |
Total Effect (Sₜ) |
Contribution Rank |
|
Envelope Parameters |
Insulation Layer Thermal Conductivity |
0.28 |
0.38 |
1 |
|
Envelope Parameters |
Partition Thermal Conductivity |
0.22 |
0.31 |
2 |
|
Envelope Parameters |
Insulation Layer Thickness |
0.15 |
0.27 |
3 |
|
Envelope Parameters |
Window/Doors Heat Transfer Coefficient |
0.12 |
0.20 |
4 |
|
System Layout Parameters |
Multi-Temperature Area Ratio |
0.08 |
0.10 |
5 |
|
System Equipment Parameters |
Refrigeration System COP |
0.05 |
0.07 |
6 |
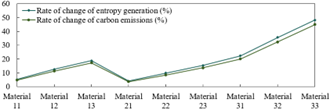
Figure 6. Sensitivity analysis line chart for key design variables
To explore the sensitivity mechanism of insulation material and thickness on heat transfer irreversibility and carbon emissions, this study analyzes the coupling between material thermal physical properties and the thermal resistance network model. In Figure 6, Materials 11-33 correspond to the following insulation layer scenarios: Polyurethane 80 mm, Polyurethane 120 mm, Polyurethane 160 mm, Rock Wool 80 mm, Rock Wool 120 mm, Rock Wool 160 mm, Vacuum Insulation Panel 80 mm, Vacuum Insulation Panel 120 mm, and Vacuum Insulation Panel 160 mm. From the material performance differences, the thermal conductivity of vacuum insulation panels is only 1/3 that of polyurethane and 1/5 that of rock wool, resulting in significantly higher thermal resistance for the same thickness, leading to a much greater reduction in entropy generation rate compared to other materials. Regarding the marginal benefits of thickness, when the vacuum insulation panel thickness increases from 80 mm to 160 mm, the entropy generation rate reduction increases from 22.3% to 48.2%, but the marginal reduction decreases from 22.3% → 13.3% → 12.6%, which can be explained by the series connection mechanism of thermal resistance: as the total thermal resistance increases, the incremental contribution of insulation layer thermal resistance to the total thermal resistance gradually decreases. In line with international research, this study further quantifies the optimal thickness range of vacuum insulation panels in cold chain warehouses as 120-160 mm. This range achieves more than 40% reduction in entropy generation rate while avoiding excessive thickness that leads to cost waste.
(a) Unit area heat transfer entropy generation rate
(b) Unit area full lifecycle carbon emissions
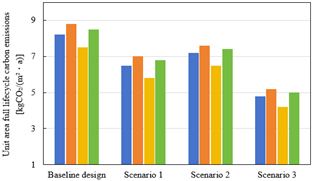
Figure 7. Analysis of heat transfer entropy generation rate and carbon emissions for different design variable combinations
To reveal the coupling effect of insulation layer and partition parameters on heat transfer irreversibility and full lifecycle carbon emissions, and to provide a quantitative basis for low-carbon structural design of multi-temperature cold chain warehouses, this study conducts a systematic experimental analysis. The results are shown in Figure 7. In the figure, the baseline design corresponds to Polyurethane 80 mm + Rock Wool partition, with partition thermal conductivity λ = 0.042, and Scenarios 1-3 correspond to Polyurethane 120 mm + Polyurethane partition, Rock Wool 120 mm + Polyurethane partition, and Vacuum Insulation Panel 80 mm + Polyurethane partition, with partition thermal conductivity λ = 0.024 in each case. From the perspective of the coupling between the thermal resistance network mechanism and lifecycle evaluation, vacuum insulation panels, compared to the baseline design, result in the maximum reduction in unit area heat transfer entropy generation rate by 43.8% and the maximum reduction in unit area full lifecycle carbon emissions by 46.7%. This significant advantage arises from two aspects: first, the ultra-low thermal conductivity of vacuum insulation panels greatly improves the thermal resistance of the envelope structure, and according to the entropy generation rate calculation from the thermal resistance network model, its contribution to conduction entropy generation rate decreases from 62.3% in the baseline design to 31.5%; second, the "thickness reduction - high thermal resistance efficiency" synergy in the material lifecycle, despite vacuum insulation panels having higher carbon emissions per unit mass compared to polyurethane, results in a 40% reduction in material usage at 80mm thickness, and the reduction in carbon emissions from refrigeration energy consumption completely offsets the increase in carbon emissions from the material production stage. Comparing Scenario 1 and Scenario 2, their reductions in entropy generation rate and carbon emissions are only 21.9%-28.6% and 17.1%-25.3%, respectively, and Scenario 2 has clear performance bottlenecks due to the high thermal conductivity of rock wool. Through variance analysis, it was confirmed that material type has a much higher significance (p < 0.001) on entropy generation rate and carbon emissions than thickness, statistically confirming that thermal conductivity is the core regulatory factor. Therefore, low-carbon structural design for multi-temperature cold chain warehouses should prioritize using vacuum insulation panels with low thermal conductivity partition materials, as this combination has both academic innovation and engineering practicality in suppressing heat transfer irreversibility and reducing full lifecycle carbon emissions, providing a mechanism support and quantitative design benchmark for the application of ultra-insulation materials in cold chain buildings.
This paper focuses on the core need for collaborative optimization of "heat transfer irreversibility - full lifecycle carbon emissions - total cost" in multi-temperature cold chain warehouses. A multi-objective optimization model is developed by coupling thermal resistance network and heat transfer entropy generation analysis. Dual validation is carried out through Fluent + COMSOL joint simulation and real-world engineering monitoring. The NSGA-III-Kriging hybrid algorithm and Sobol' global sensitivity analysis are combined to systematically reveal the mechanisms and optimization pathways of design parameters, resulting in research outcomes that are both academically innovative and practically applicable. The core research findings show that envelope structure parameters are the dominant factors influencing carbon emissions and entropy generation rates. Their collaborative optimization can reduce entropy generation by up to 48.2% and carbon emissions by 46.7%. The Pareto front of multi-objective optimization presents a strict trade-off relationship of "simultaneous reduction of entropy generation and carbon emissions, with cost monotonically increasing." The marginal substitution rate indicates that for every 10,000 RMB investment, a reduction of 0.0035 W/K in entropy and 318 kgCO₂ in carbon emissions can be achieved, providing a quantitative decision-making benchmark for different scenarios. The combination of vacuum insulation panels with low thermal conductivity partitions performs optimally in "thermal resistance enhancement - entropy generation suppression - low-carbon emissions reduction," with a design thickness range of 120-160 mm being the optimal engineering design range. The innovation of this study lies in the first-time application of the heat transfer entropy generation theory coupled with the thermal resistance network model for the optimization of multi-temperature cold chain warehouses. The global sensitivity analysis clarifies the interaction effects of parameters and optimization priorities, overcoming the limitations of traditional local optimization and single-objective approaches, and providing new mechanistic support and quantitative tools for the low-carbon design of cold chain buildings.
Although this study has achieved preliminary results, it still has certain limitations: the model does not fully consider the nonlinear impact of extreme weather on dynamic heat transfer processes, nor does it account for the effects of insulation material aging and thermal conductivity decay over time. The optimization variables focus on envelope structure and basic layout parameters, excluding operational strategies for refrigeration systems, renewable energy integration such as solar-assisted power supply, and other aspects. Future research can expand in three areas: first, by introducing material aging dynamics models and extreme climate scenario libraries to construct a dynamic coupling optimization model that better fits long-term service characteristics; second, by integrating AI algorithms for real-time dynamic optimization of design parameters and operational strategies to improve the model's adaptability in complex working conditions; third, by broadening the research scope to incorporate carbon trading market mechanisms and refine multidimensional trade-offs in terms of economy, environment, and energy efficiency, while also exploring coupling optimization paths between photovoltaic building integration, ground-source heat pumps, and cold chain warehouses, further enhancing the universality and engineering applicability of the research findings.
[1] Zhang, S., Chen, N., Song, X., Yang, J. (2019). Optimizing decision-making of regional cold chain logistics system in view of low-carbon economy. Transportation Research Part A: Policy and Practice, 130: 844-857. https://doi.org/10.1016/j.tra.2019.10.004
[2] Andika, N., Luthfiana, D.N., Tampubolon, N.K.T., Harnaji, B., Wahyudi, D. (2024). From awareness to action: How knowledge of energy-saving labels drives sustainable consumer behavior towards energy-efficient home appliances in Indonesia. International Journal of Environmental Impacts, 7(2): 277-286. https://doi.org/10.18280/ijei.070212
[3] Liu, X., Chen, J., Wang, Y., Zhang, X. (2025). An optimization strategy of cold storage temperature control based on energy consumption prediction. Journal of Building Engineering, 111: 113471. https://doi.org/10.1016/j.jobe.2025.113471
[4] Poolkrajang, A. (2024). Enhanced fuel efficiency via eco-driving training in freight transport. International Journal of Transport Development and Integration, 8(1): 99-108. https://doi.org/10.18280/ijtdi.080109
[5] Goodarzi, K. (2025). Energy, exergy, and economic analysis of cold energy storage systems in cold storage using polyethylene glycol phase change material. Case Studies in Thermal Engineering, 71: 106225. https://doi.org/10.1016/j.csite.2025.106225
[6] Singh, R.K., Gunasekaran, A., Kumar, P. (2018). Third party logistics (3PL) selection for cold chain management: A fuzzy AHP and fuzzy TOPSIS approach. Annals of Operations Research, 267(1): 531-553. https://doi.org/10.1007/s10479-017-2591-3
[7] Sharma, T., Sharma, M., Mehrotra, S., Grima, S. (2023). An econometric analysis of India’s urbanization, energy consumption, economic growth and CO₂ emission. International Journal of Environmental Impacts, 6(2): 57-64. https://doi.org/10.18280/ijei.060201
[8] Pramudika, G., Astanti, R., Ai, T. (2025). An AI-IoT inventory management approach to optimize cold storage replenishment and energy cost. Operations and Supply Chain Management: An International Journal, 18(2): 256-274. http://doi.org/10.31387/oscm0610471
[9] Kang, Y., Liu, Y., Shen, M., Zuo, Z., et al. (2025). Improved liquid air energy storage process utilizing LNG cold energy: Continuous and flexible energy storage. Renewable Energy, 256(G): 124502. https://doi.org/10.1016/j.renene.2025.124502
[10] Rühlin, V., Scherrer, M., Crijns-Graus, W., Worrell, E. (2025). Marginal abatement cost curves for cold food supply chains–A hybrid adoption of the practice-based and supply-chain practice view. Journal of Cleaner Production, 518: 145902. https://doi.org/10.1016/j.jclepro.2025.145902
[11] Dang, H., Lu, Y., Du, Y., Zhang, X., Zhang, Q., Ma, W., Zhang, X. (2024). A detailed thermal resistance network analysis of FCBGA package. Journal of Thermal Science, 33(1): 18-28. https://doi.org/10.1007/s11630-023-1903-y
[12] Han, L., Tong, Z. (2019). A thermal resistance network model based on three-dimensional structure. Measurement, 133: 439-443. https://doi.org/10.1016/j.measurement.2018.10.053
[13] Liu, Z., Pan, M., Zhang, A., Zhao, Y., Yang, Y., Ma, C. (2015). Thermal characteristic analysis of high-speed motorized spindle system based on thermal contact resistance and thermal-conduction resistance. The International Journal of Advanced Manufacturing Technology, 76(9): 1913-1926. https://doi.org/10.1007/s00170-014-6350-1
[14] Manay, E., Akyürek, E.F., Sahin, B. (2018). Entropy generation of nanofluid flow in a microchannel heat sink. Results in Physics, 9: 615-624. https://doi.org/10.1016/j.rinp.2018.03.013
[15] Butt, A.S., Munawar, S., Ali, A., Mehmood, A. (2012). Entropy generation in the Blasius flow under thermal radiation. Physica Scripta, 85(3): 035008. https://doi.org/10.1088/0031-8949/85/03/035008
[16] Khentoul, M., Bessaïh, R. (2024). Numerical study on entropy generation in a horizontal channel with fins using hybrid nanofluid. International Journal of Heat and Technology, 42(2): 501-510. https://doi.org/10.18280/ijht.420216
[17] Benguerraiche, Z.S., Bessaïh, R. (2025). Study of the thermal performance and entropy generated by laminar flow of a nanofluid in pipes. International Journal of Computational Methods and Experimental Measurements, 13(3): 709-725. https://doi.org/10.56578/ijcmem130318
[18] Ahmed, M.A., Hatem, S.M., Alabdaly, I.K. (2023). Numerical examination of heat transfer and entropy generation in confined-slot jet impingement featuring wing ribs. Power Engineering and Engineering Thermophysics, 2(3): 173-187. https://doi.org/10.56578/peet020305
[19] Belahmadi, E., Bessaїh, R. (2023). Heat transfer and entropy generation minimization in a lid-driven enclosure filled with nanofluid. International Journal of Heat and Technology, 41(5): 1358-1364. https://doi.org/10.18280/ijht.410527
[20] Mahdi, L.A., Al-naamee, M.K.J., Salam, A.Q., Omran, S.H., Al-salihi, H.A., Abood, M.K., Wahhab, H.A.A. (2023). Theoretical entropy generation analysis for forced convection flow around a horizontal cylinder. International Journal of Computational Methods and Experimental Measurements, 11(3): 163-168. https://doi.org/10.18280/ijcmem.110305
[21] Ahmed, M.A., Alabdaly, I.K., Hatema, S.M., Hussein, M.M. (2023). Numerical investigation of hydrothermal performance and entropy generation through backward facing step channel with oval rib. International Journal of Heat and Technology, 41(5): 1349-1357. https://doi.org/10.18280/ijht.410526
[22] Sebatjane, M. (2024). A sustainable inventory model for a two-echelon cold chain with green technology investments and stock-dependent demand under carbon emissions tax regulation. Cleaner Logistics and Supply Chain, 13: 100173. https://doi.org/10.1016/j.clscn.2024.100173
[23] Mahmood, D.T. (2025). Thermal transport in porous structures: Mechanisms, modeling approaches, and future directions. Power Engineering and Engineering Thermophysics, 4(1): 42-57. https://doi.org/10.56578/peet040104
[24] Sebatjane, M. (2025). Inventory optimisation in a two-echelon cold chain: Sustainable lot-sizing and shipment decisions under carbon cap emissions regulations. Annals of Operations Research. https://doi.org/10.1007/s10479-025-06466-2
[25] Zhao, L. Q., Li, H., Jiang, N.Z., Hong, T.L., Mao, Y., Wang, Y.Y. (2025). Advances in waste heat recovery technologies for SOFC/GT hybrid systems. Power Engineering and Engineering Thermophysics, 4(1): 12-29. https://doi.org/10.56578/peet040102
[26] Fischer, S., Harangozó, D., Németh, D., Kocsis, B., Sysyn, M., Kurhan, D., Brautigam, A. (2024). Investigation of heat-affected zones of thermite rail weldings. Facta Universitatis, Series: Mechanical Engineering, 22(4): 689-710. https://doi.org/10.22190/FUME221217008F