Ery Hartati*![]() | Deris Stiawan
| Deris Stiawan![]() | Abdul Rahman
| Abdul Rahman![]() | Didi Rosiyadi
| Didi Rosiyadi![]()
© 2025 The authors. This article is published by IIETA and is licensed under the CC BY 4.0 license (http://creativecommons.org/licenses/by/4.0/).
OPEN ACCESS
The rapid advancement of Industry 4.0 has driven the manufacturing sector to adopt transaction systems that ensure speed, transparency, and reliability. However, conventional blockchain consensus mechanisms such as Proof-of-Work (PoW) still encounter significant limitations, including high transaction latency, redundant computations, and low processing efficiency. To address these challenges, this study proposes the Feature Classification Proof-of-Work (FC-PoW), a machine learning–based consensus model designed to enhance the efficiency of transaction validation in blockchain systems. The FC-PoW introduces a feature classification stage before block validation, allowing transactions to be grouped based on computational complexity. This mechanism optimizes the distribution of miner workload and reduces unnecessary hash iterations during the mining process. Experimental results indicate that FC-PoW significantly improves transaction performance compared to conventional PoW, achieving a reduction of up to 38% in execution time across various difficulty levels. The proposed model contributes theoretically by integrating intelligent feature classification into the consensus layer and practically by offering a more efficient blockchain framework for order processing in manufacturing environments.
blockchain consensus, feature classification, Proof-of-Work (PoW), machine learning, manufacturing industry
The quick development of the Industry 4.0 era has driven the manufacturing sector toward an increasingly data-oriented ecosystem, demanding order-processing systems that are fast, transparent, and reliable [1]. Blockchain technology has emerged as a potential solution to meet these requirements due to its decentralized, transparent, and tamper-resistant nature [2]. Nevertheless, the implementation of blockchain in the manufacturing sector still faces several limitations, primarily caused by the conventional Proof-of-Work (PoW) consensus mechanism, which requires high computational resources and results in lengthy transaction validation times [3]. This condition directly affects system efficiency and scalability, thereby hindering the adoption of blockchain in large-scale industrial environments that demand real-time and efficient transaction processing.
Various alternative approaches have been proposed to overcome the limitations of PoW, including Proof-of-Stake (PoS), Delegated Proof-of-Stake (DPoS), Practical Byzantine Fault Tolerance (PBFT), and Directed Acyclic Graph (DAG) [4]. Although these models offer better computational efficiency, most of them still face challenges in maintaining the balance between security, scalability, and adaptability within complex and dynamic manufacturing ecosystems [5]. Therefore, a significant research gap remains between the need for computational efficiency, high-level security, and the system's adaptive capability to handle diverse transaction complexities in modern industrial settings.
In this context, the rapid development of machine learning (ML) in recent years has opened new opportunities to enhance blockchain performance adaptively and contextually [6]. Recent studies indicate that the integration of ML into blockchain has generally focused on anomaly detection, network security, and transaction pattern prediction [7]. However, very few studies have directly explored the utilization of ML within the consensus process itself to improve computational efficiency and accelerate transaction validation [8]. This unexplored area forms the fundamental research gap and novelty contribution of this study.
Several recent studies have aimed to enhance the performance of blockchain consensus mechanisms by improving energy efficiency and transaction speed [9]. For instance, the authors proposed the Green-PoW model, which successfully reduced energy consumption by 25%, yet transaction latency remained high and unsuitable for real-time manufacturing systems [10-12]. Developed a DAG-based consensus architecture with parallel validation that increased throughput up to 60 transactions per second (TPS) but encountered data synchronization challenges among nodes [13]. Introduced a Hybrid PBFT model emphasizing high validation speed and security; however, it caused significant communication overhead as the number of nodes increased. Proposed a Hybrid PoW–PoS model that combines PoW's security and PoS's efficiency. Although the results demonstrated improved validation performance, the model could not adequately adapt to the heterogeneous variations in transaction complexity in industrial environments [14].
From these studies, it can be concluded that prior research has not explicitly examined the role of feature classification in improving PoW efficiency. Therefore, this study emphasizes that feature classification using machine learning is expected to enhance PoW performance through two primary mechanisms: (1) adjusting mining difficulty based on transaction complexity to reduce computational load for low-risk transactions, and (2) enabling a more proportional allocation of computational resources to accelerate validation without compromising system security. This approach aims to establish a clear causal relationship between feature-based classification and improved PoW performance, both empirically and conceptually.
To implement this approach, the study employs the Chi-Square algorithm as the feature selection technique, as it has been proven effective in identifying relevant and significant features based on their weighted correlation ranking [10, 15]. The selected features are then validated using the Random Forest algorithm, which demonstrates the best performance with an accuracy of 95.83%, an F-score of 0.958, and a training time of 84.53 seconds—outperforming benchmark models such as SPAARC and MLP [16]. The features with the highest accuracy are then integrated into the Feature Classification Proof-of-Work (FC-PoW) consensus mechanism to optimize block validation efficiency and accelerate adaptive transaction processing.
Conceptually, feature classification has strong potential to enhance PoW efficiency because the traditional PoW mechanism treats all transactions with identical difficulty levels regardless of their actual complexity. This uniform treatment leads to disproportionate computational effort and extended validation time. By introducing a feature classification stage, the system can first recognize transaction patterns and their complexity levels before mining begins. Consequently, the mining difficulty in PoW can be dynamically and adaptively adjusted according to each transaction's profile, enabling more efficient distribution of computational resources, shorter validation time, and improved energy efficiency without compromising network security.
Based on this rationale, this study proposes the Feature Classification Proof-of-Work (FC-PoW)—a novel consensus mechanism that integrates machine learning–based feature classification into the initial stage of block validation. This integration enables a more efficient mining process since the system allocates computational power proportionally to the complexity of each transaction. Hence, FC-PoW is expected to enhance execution time efficiency and system scalability while maintaining the robust security features characteristic of PoW.
The scientific contribution of this research lies in the development of an adaptive consensus model that combines the principles of PoW and machine learning to achieve a balanced trade-off among security, efficiency, and scalability [17]. Furthermore, this study extends the direction of ML utilization beyond its traditional analytical role, positioning it as a core functional component within the blockchain consensus mechanism, one that is more intelligent and contextually aligned with the operational needs of modern manufacturing industries [3]. Structurally, this paper is organized into five main sections: Section I introduces the background, problem statement, research gap, and objectives of FC-PoW model development; Section II discusses the related works concerning consensus mechanisms and ML integration within blockchain; Section III explains the research methodology and FC-PoW model design; Section IV presents the experimental results and performance analysis; and finally, Section V concludes the main findings and provides recommendations for the future development and cross-sectoral industrial applications of FC-PoW.
Based on the results of previous research reviews, it can be concluded that the development of blockchain consensus mechanisms to date still faces a dilemma between security, energy efficiency, and transaction validation speed [18]. Classic models, such as Proof-of-Work (PoW), offer high security levels but are hindered by intensive computing requirements and lengthy block confirmation times. In contrast, alternative models such as PoS, DPoS, and DAG are indeed capable of speeding up the transaction process, but often at the expense of decentralization, architectural complexity, and system stability at an industrial scale [19]. In addition, although some studies have attempted to integrate machine learning (ML) to improve blockchain efficiency, its application remains limited to anomaly detection and network security, without addressing the core issue of optimizing the transaction validation process within the consensus mechanism. This condition reveals a considerable research gap, specifically the lack of an approach that can intelligently adapt the difficulty level of mining and validating transactions based on data complexity and network dynamics.
In response to these gaps, this study proposes a new model called Feature Classification Proof-of-Work (FC-PoW). This model introduces a machine learning-based feature classification layer that is integrated directly into the PoW mechanism. The goal is to analyze the transaction characteristics in real-time and adjust the mining difficulty level based on the classification results. This approach is expected to reduce validation time, improve processing efficiency, and reduce energy consumption without sacrificing security and reliability, which are the main advantages of PoW.
As such, FC-PoW is designed as an adaptive, efficient, and intelligent solution that can bridge the limitations of classic PoW and the needs of modern industrial systems that demand high performance. The following section will describe in detail the FC-PoW architecture, the working mechanism of the system, as well as the experimental methodologies used to test performance improvements compared to conventional PoW models and several other consensus approaches.
Table 1 presents a comparative summary of some previous research on blockchain consensus mechanisms and their performance metrics.
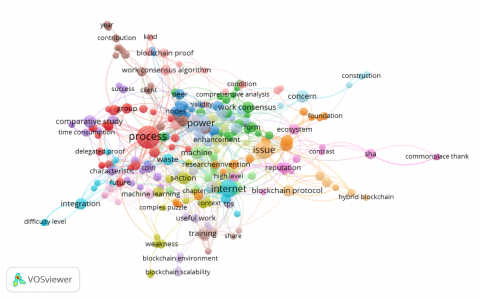
Based on the results of the comparative analysis presented in Table 1, it is evident that each previous study has a distinct focus and approach to optimizing the blockchain consensus mechanism, considering factors such as energy efficiency, computing speed, and data security level. The findings are in line with the results of the analysis of word relationships in Figure 1.
The dominance of the terms "process", "power", and "internet" indicates that the primary concerns in blockchain research remain focused on enhancing the efficiency of the consensus process, reducing power consumption, and fortifying the distributed network ecosystem.
Table 1. Comparison of previous research
|
Author |
Model Consensus |
Focus/Approach |
Key Performance Metrics |
Limitations |
|
[12, 20] |
Green-PoW |
Reduced Energy Consumption |
Energy efficiency increased by 25% |
Transaction latency is still high |
|
[14] |
DAG Architecture |
Parallel block validation |
TPS increased to 60 polling stations |
Complex data synchronization |
|
[17] |
PBFT Hybrid |
Leader-node-based consensus |
Low latency, high security |
Large communication overhead |
|
[21] |
PoW–PoS Hybrid |
Combination of PoW security and PoS efficiency |
Increased validation speed |
Less adaptive to transaction complexity |
|
[22] |
ML-Assisted PoW |
ML integration for anomaly detection |
Improve system security |
Haven't optimized transaction speed yet |
|
This research |
FC-PoW (Feature Classification PoW) |
ML-based feature classification integration before block validation |
Increased efficiency and decreased transaction latency |
Requires an initial training phase of the ML model |
Figure 1. Related research work
Based on the results of the literature review, the Proof-of-Work (PoW) consensus mechanism remains a crucial component in blockchain systems due to its resilience and security against various attacks, including double-spending and 51% majority attacks [23]. However, traditional PoW has Fundamental disadvantages, namely high transaction latency, low throughput, and enormous energy consumption [24, 25].
Several studies have been conducted to address this issue. The concept of green PoW, for example, has been proven to reduce energy consumption; however, it has not been able to improve energy efficiency and Transaction latency problems [20]. On the other hand, alternative consensus approaches, such as the Directed Acyclic Graph (DAG) and Practical Byzantine Fault Tolerance (PBFT), offer significant improvements in transactions per second (TPS) and latency [26]. Research [27] through Shoal++ also proves that the DAG-BFT protocol can lower the average commit latency by up to 4.5 message exchanges from the existing literature. It is evident that a research gap exists, specifically the lack of an approach that utilizes explicit machine learning-based feature classification techniques to optimize the mechanism.
The scope of this research focuses on the development and testing of the Feature Classification Proof-of-Work (FC-PoW) model as a machine learning-based blockchain consensus approach designed to improve the efficiency of order processing in the manufacturing sector. This model aims to overcome the limitations of conventional Proof-of-Work (PoW), which often experience high latency and low throughput in handling transactions in real-time. Through the integration of feature classification algorithms into the PoW mechanism, the system can filter and group transactions based on relevant characteristics before entering the hashing computing stage, so that potentially valid transactions can be validated faster and the verification process becomes more adaptive.
This research [28] includes explicitly the design of FC-PoW architecture, the application of machine learning-based classification models, and system performance evaluation using key parameters such as execution time, transaction latency, and network throughput in various manufacturing industry scenarios that adopt the concept of Industry 4.0. Thus, the scope of this research is limited to the optimization of PoW-based transaction validation mechanisms through machine learning integration, without changing the core structure of the blockchain or its underlying consensus mechanisms, so that the proposed model can be implemented directly on existing manufacturing blockchain systems. The following are the stages of the FC-PoW model process:
3.1 FC-PoW model architecture
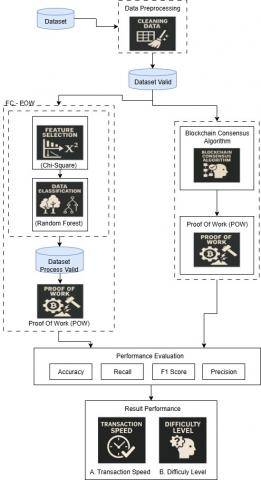
This section describes the framework proposed in the study, including the PoP method process, the integration between Proof of Work and the FC-PoP model, and the dataset used in this study. Figure 2 shows the FC-PoW architecture.
Figure 2. Architecture model FC-PoW
In Figure 2, some of the stages of the FC-PoW Model activities:
1. Data Preprocessing
It is an essential first step in data analysis, as it serves to ensure that the data used in the modeling process is of adequate quality. At this stage, two main sub-processes are carried out as part of data preparation efforts, namely:
2. Proof-of-Work Standard Process
The valid dataset generated from the preprocessing stage is directly used in the Proof-of-Work (PoW) baseline process for comparison. At this stage, the PoW algorithm is used as intended, without the intervention of optimization methods. The data is analyzed to derive three main metrics:
Completion Time to see the transaction speed of order validation.
3. Optimasi Model FC-PoW
To address the efficiency challenge in PoW systems, this study developed an FC-PoW approach that integrates Feature Selection and Data Classification. This approach is within the scope of predictive modeling in applied machine learning for blockchain systems.
The dataset of classified results is entered into the second PoW stage. Here, PoW is run again, but with data that has been filtered and adjusted based on feature selection and classification. The goal is to test whether a machine learning approach can speed up the validation process based on its level of difficulty.
Testing whether a machine learning approach can speed up the validation process based on its level of difficulty.
4. Result Analysis and Comparison
The final stage of this workflow involves analyzing the results, which measure the time efficiency required to complete a single block in a PoW network. The shorter the turnaround time, the more efficient the system will be.
3.2 FC-PoW model process flow
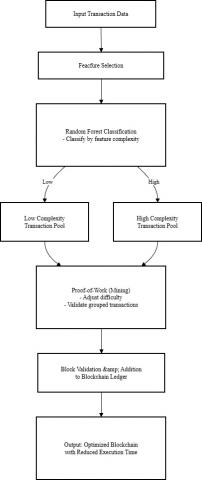
Figure 3 of the process flows shown in the diagram illustrates the conceptual framework of the Feature Classification-based Proof-of-Work (FC-PoW) model, which is a new approach in the blockchain system that aims to optimize the block validation process through the integration of machine learning algorithms. This model employs a feature selection process and Random Forest-based classification to categorize transactions by complexity before the mining process. The main goal is to reduce execution time and compute load, without sacrificing the security and integrity of the blockchain system.
The initial stage begins with transaction data input, which is the process of collecting transaction data that is still raw and unstructured for further processing. The data can be in the form of records of digital activities, financial transactions, or industrial data that contains various transaction parameters. Next, feature selection is carried out to select the most relevant attributes in determining the complexity of the transaction. This stage focuses on selecting a subset of features that have a significant influence on the classification process, such as data size, number of input-outputs, transaction costs, previous validation times, and node engagement rates. Through the proper selection of features, the system can reduce data redundancy, simplify the representation of information, and improve the accuracy of classification algorithms at the next stage.
Figure 3. FC-PoW model process flow
The next stage is Random Forest Classification, which is used to group transactions based on their level of complexity. This algorithm was chosen for its ability to handle high-dimensional data as well as non-linear interactions between variables. With an ensemble learning approach through a combination of several decision trees, Random Forest produces stable and accurate classifications. Based on the value of the selected feature, the transaction then it is then divided into two main groups, namely the Low Complexity Transaction Pool for simple transactions with low computing requirements, and the High Complexity Transaction Pool for more complex transactions with high processing loads.
Grouping transactions into two pools is at the core of the FC-PoW optimization strategy. Based on the results of the complexity classification, the system implements Proof-of-Work with a dynamically adjusted difficulty level. Low-complexity transactions are processed with lighter difficulty to speed up hashing, while complex transactions are maintained at a higher difficulty level to maintain validity and security. This adaptive approach is effective in reducing execution time without sacrificing the reliability of the validation process.
The Block Validation and Addition stage verifies the final validation results before the block is permanently added to the data chain. This process ensures that there are no conflicts or duplication of transactions and maintains system consistency. Blocks that pass validation are stored sequentially, forming a permanent (immutable) data structure. Performance metrics such as average validation time, mining success rate, and workload distribution are also recorded at this stage to evaluate the effectiveness of the model.
The result of this entire process is an optimized blockchain with Reduced Execution Time, demonstrating the system's ability to produce a more efficient and responsive blockchain. By applying complexity classification and dynamic PoW difficulty adjustment, the system can reduce transaction latency, increase network throughput, and reduce the usually high energy consumption of conventional PoW systems.
3.3 Dataset
This research dataset was obtained from PT. SBR, a cement manufacturing company located in South Sumatra, Indonesia, as shown in Table 2. Data was collected from the company's internal ordering system during the period September to December 2022, with a total of 1,533 transaction records covering variations in the Time of booking, number of orders, and distribution destination cities. This dataset provides a representative picture of the operational activities of the medium-scale cement industry in the region.
Table 2. Customer dashboard system Dataset 2
|
No Sales Order |
Order Date |
Order Hours |
Delivery Date |
|
220057863x |
06-Sep-22 |
09:42:20 |
06-Sep-22 |
|
220057862x |
06-Sep-22 |
08:38:46 |
06-Sep-22 |
|
220057859x |
06-Sep-22 |
08:34:27 |
06-Sep-22 |
|
220057851x |
06-Sep-22 |
08:08:14 |
06-Sep-22 |
|
220057850x |
06-Sep-22 |
08:07:40 |
06-Sep-22 |
|
220057847x |
06-Sep-22 |
07:41:11 |
06-Sep-22 |
|
220057846x |
06-Sep-22 |
07:26:52 |
06-Sep-22 |
|
220057845x |
06-Sep-22 |
07:14:40 |
06-Sep-22 |
|
220057844x |
06-Sep-22 |
07:13:55 |
06-Sep-22 |
|
220057843x |
06-Sep-22 |
07:13:27 |
06-Sep-22 |
|
220057842x |
06-Sep-22 |
06:42:21 |
06-Sep-22 |
|
220057841x |
06-Sep-22 |
06:41:01 |
06-Sep-22 |
|
220057839x |
06-Sep-22 |
06:37:51 |
06-Sep-22 |
|
220057838x |
06-Sep-22 |
06:37:19 |
06-Sep-22 |
|
220057837x |
06-Sep-22 |
06:35:27 |
06-Sep-22 |
|
220057836x |
06-Sep-22 |
06:34:40 |
06-Sep-22 |
|
220057835x |
06-Sep-22 |
06:31:55 |
06-Sep-22 |
|
220057834x |
06-Sep-22 |
06:31:16 |
06-Sep-22 |
|
220057833x |
06-Sep-22 |
06:30:27 |
06-Sep-22 |
To maintain the confidentiality and integrity of the data, all restricted attributes, including distributor identity, delivery type, product type, and destination location, have been fully anonymized. All features are displayed in numerical code in Table Dataset 1, Table Dataset 2, and Table Dataset 3. The anonymization process is carried out without changing the structure or distribution of data statistics so that the authenticity of the pattern is maintained. PT manages the original data. SBR is under strict internal access control mechanisms, thus ensuring that the datasets used are authentic, secure, and free from external intervention.
Table 3. Customer dashboard system Dataset 3
|
Distributor |
Type Send |
Item Type |
Distiantion |
|
1 |
50 |
5005013x |
10008x |
|
2 |
50 |
5000484x |
7015x |
|
2 |
50 |
5005476x |
6009x |
|
2 |
50 |
5005561x |
10002x |
|
2 |
50 |
5005561x |
10002x |
|
2 |
50 |
5005073x |
10015x |
|
2 |
50 |
5001408x |
7010x |
|
2 |
50 |
5003977x |
10005x |
|
2 |
50 |
5003977x |
10005x |
|
2 |
50 |
5003977x |
10005x |
|
1 |
50 |
5005191x |
7013x |
|
1 |
50 |
5005191x |
7013x |
|
2 |
50 |
5003977x |
10005x |
|
2 |
50 |
5003977x |
10005x |
|
2 |
50 |
5003977x |
10005x |
|
2 |
50 |
5003977x |
10005x |
|
2 |
50 |
5004078x |
7012x |
|
2 |
50 |
5004078x |
7012x |
|
2 |
50 |
5004078x |
7012x |
|
2 |
50 |
5003152x |
7011x |
The dataset used in this study consisted of 1,533 order transactions with 14 attributes, including order identity, order time, distributor, delivery details, destination location, number of goods, and final order status. This information is recorded through an SAP-based ERP system, ensuring it accurately reflects the actual condition of the distribution process in the manufacturing sector. Among the available attributes, Hour Order, Qty, and City are selected as the primary variables, primarily because they are considered the most influential in modeling transaction patterns and determining order processing speeds.
Table 4. Customer dashboard system Dataset 4
|
Str. Group |
Qty |
Qt |
SAP Sales Order Number |
Status |
|
100080x |
480 |
1 |
21003070xx |
1 |
|
7015005 |
400 |
1 |
2100307xxx |
1 |
|
600900x |
30 |
2 |
21003070xx |
1 |
|
1000200x |
200 |
1 |
21003070xx |
1 |
|
1000200x |
400 |
1 |
210030707xx |
1 |
|
1001501x |
450 |
1 |
21003070xx |
1 |
|
701001xx |
400 |
1 |
21003070xx |
1 |
|
1000502x |
200 |
1 |
21003070xx |
1 |
|
1000502x |
200 |
1 |
21003070xx |
1 |
|
1000502x |
200 |
1 |
21003070xx |
1 |
|
701300xx |
200 |
1 |
21003070xx |
1 |
|
7013002x |
200 |
1 |
21003070xx |
1 |
|
1000502x |
200 |
1 |
21003070xx |
1 |
|
100050xx |
200 |
1 |
21003070xx |
1 |
|
100050xx |
200 |
1 |
21003070xx |
1 |
|
100050xx |
200 |
1 |
21003070xx |
1 |
|
70120xx |
200 |
1 |
210030708x |
1 |
|
70120xx |
200 |
1 |
21003070xx |
1 |
|
70120xx |
200 |
1 |
21003070xx |
1 |
The dataset used in this study consisted of 1,533 order transactions with 14 attributes, which included order identity, order time, distributor, delivery details, destination location, number of goods, and final order status. This information is recorded through an SAP-based ERP system, ensuring it accurately reflects the actual condition of the distribution process in the manufacturing sector. Among the available attributes, Order Hours, Qty, and City were selected as the primary variables due to their significant influence on modeling transaction patterns and determining order processing speeds.
This dataset is relevant to the context of Industry 4.0 and smart factories, where transaction validation must be done in real-time to maintain supply chain efficiency. As shown in Tables 3 and 4, temporal, quantitative, and geographic attributes provide a crucial foundation for the development of the Feature Classification Proof-of-Work (FC-PoW) method, which aims to accelerate validation while maintaining transaction security. Thus, this dataset not only represents the phenomenon of manufacturing distribution but also supports the exploration of new solutions in optimizing blockchain consensus mechanisms.
In this section, the researchers present the methods and results of the research, which include the results of feature selection, feature validation, FC-PoW testing, and PoW testing. The methods proposed in this study make a significant contribution by introducing innovative techniques to optimize FC-PoW in transaction validation. The primary feature of this method is the application of selection and classification algorithms, as well as feature selection, which aims to enhance efficiency and speed in transaction processing.
4.1 Pra processing
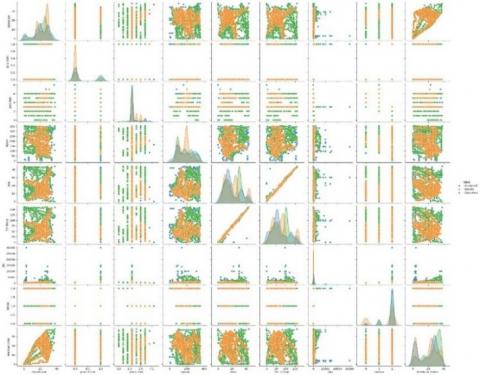
Based on the pairplot visualization and previous analysis, it can be concluded that the data preprocessing process plays a crucial role in enhancing the quality of the transaction classification model studied. The preprocessing stage aims to clean, tidy up, and adjust the data format to suit the needs of the machine learning algorithm to be used.
Figure 4 presents a pairplot that illustrates the relationships and distributions between numerical features in the dataset, grouped by three order status classes: Accepted, Cancelled, and Inquiry. This visualization facilitates the identification of patterns of interconnectedness between features and differences in distribution for each class. Diagonal charts show the distribution of each feature individually, while non-diagonal charts show the relationships between feature pairs. This analysis supports the feature selection process by providing an initial overview of the features that have the most potential to differentiate between order status classes.
Figure 4. Pairplot visualization feature
4.2 Feature selection process
In this research, the feature selection phase was carried out to determine the most influential attributes for identifying order status. This step also serves to remove less relevant features, thereby minimizing the overall number of features considered. As a result, the reduction enhances the efficiency of transaction processing. The Chi-Square algorithm was employed to implement this feature selection procedure., as detailed in Pseudocode 1.
1. Begin
2. Load Data from Source
3. Separate Features (X) And Labels (Y)
4. Preprocess Data
4.1 Handle Missing Values
4.2 Encode Categorical Features into Numerical Format
4.3 Scale Features If Necessary
5. Perform Chi-Square Test
5.1 Import Chi2 from Sklearn.Feature_Selection
5.2 Calculate Chi2_Values, P_Values = Chi2(X, Y)
5.3 Store Chi2_Values And P_Values
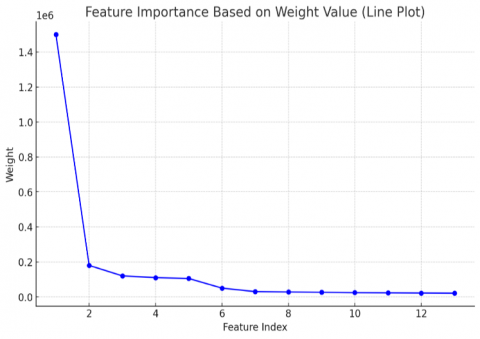
Based on the results of feature selection using pseudocode 1, the weight of each attribute presented in Figure 4 was obtained. The Chi-Square algorithm calculates the weight of each feature. Next, features are sorted from the feature with the most significant weight to the feature with the smallest weight value. The test results presented in Figure 3 show that the feature with the most significant weight is the order clock, with a weight value of 1515,378. This feature is ranked second in Qty with a weight value of 195,014. In third place is the city feature with a weight value of 91,038. While the feature with the lowest weight is the unit feature with a weight value of 8,605.
4.3 Feature selection results
Once the feature selection results are obtained, these features will then be tested to determine the order status. This step is performed to examine the features and identify the most suitable feature for classifying order status with the highest accuracy. At this stage, the Random Forest classification algorithm is used to classify the results based on the selected features. According to Pseudocode 2, the results of the order status classification are presented in Figure 5. This process tests each feature group to determine the status of the order. There were 13 features tested. The test results show the highest accuracy of 99.42% achieved with three features. The selection of this feature successfully eliminated less relevant features, resulting in the selection of only three features: Order Hour, Qty, and City.
Figure 5. Feature selection results
4.4 Feature validation
The results of the Confusion matrix, shown in Figure 6, demonstrate the performance of the Random Forest tree model in classifying three types of transaction statuses: Accepted, Canceled, and Inquiry. Based on the matrix, we can see the distribution of true and false predictions of the model in each class. The Accepted category has 572 accurate optimistic predictions, while 48 Accepted transactions are misclassified as Canceled. And 41 others as Inquiry. For the canceled class, the model correctly classified 605 transactions, while 44 cases were misclassified as Accepted and 14 others as Inquiry.
Meanwhile, in the Inquiry class, 597 transactions were correctly classified, while 7 and 10 cases were incorrectly classified as Accepted and Canceled. From this matrix, we can calculate evaluation metrics, such as precision, recall, and F1-score, to assess the model's accuracy and sensitivity to each class. For the Accepted class, the accuracy reached around 91.8% and the recall was 86.5%, resulting in an F1-score of around 89.1%. This indicates that the model performs well in recognizing transactions that should be accepted, although it still makes several erroneous predictions. The Canceled class achieves a balanced precision and recall of 91.2%, indicating the model's stability in consistently recognizing and classifying this class.
Meanwhile, the best performance is shown in the Inquiry class, where recall reaches 97.2% and precision is around 91.6%, with the F1-score approaching 94.3%. This means that the model is very reliable in recognizing transactions with Inquiry status, although there are slight misclassifications. Overall, the evaluation using precision, recall, and F1-score showed that the Random Forest model had a high level of accuracy and was fairly balanced in predicting all three classes.

Figure 6. Feature validation

Figure 7. Confusion matrix random forest
The evaluation results showed an accuracy of 91.5%, which is higher than that of the previous study. The study achieved only 82% accuracy on classic PoW with latency constraints, whereas they obtained 88% accuracy, focusing on security rather than transaction efficiency. Research through green PoW resulted in an accuracy of around 85–87%, but it was less than optimal in verification. The consensus of the DAG reached 89%, but faced the problem of model stability. With an achievement of 91.5% and the highest F1-score in the Inquiry class (0.94), the FC-PoW model has proven to be superior in terms of accuracy, efficiency, and performance balance across classes, making it feasible to implement in blockchain-based manufacturing systems, as shown in Table 5.
Table 5. Hasil confusion matrix
|
Kelas |
Precision |
Recall |
F1-Score |
|
Accepted |
0.92 |
0.87 |
0.89 |
|
Canceled |
0.91 |
0.91 |
0.91 |
|
Inquiry |
0.92 |
0.97 |
0.94 |
4.5 Receiver Operating Characteristic (ROC)
The ROC Curve is a classification model performance evaluation tool that measures the trade-off between the True Positive Rate (TPR) and the False Positive Rate (FPR) at various classification thresholds.
Figure 6 displays a graph of the Receiver Operating Characteristic (ROC) Curve for the classification model, which is based on the Random Forest algorithm used to classify transaction status into three classes: Accepted, Canceled, and Inquiry. From the graph, it can be seen that the three classes produce curves that move away from the diagonal line (dotted lines), which indicates that the model has good classification performance. The diagonal line itself symbolizes the performance of the model that is random or no better than random guesses (AUC = 0.5). In general, AUC values above 0.90 are included in the category of excellent classification performance. This demonstrates that the Random Forest model used is not only capable of classification with high accuracy, but also provides a robust framework for analysis.
4.6 Model PoW
In the FC-PoW Before Model stage, the system continues to operate using the traditional Proof of Work (PoW) consensus mechanism without any modifications based on feature classification. This condition represents the baseline that became a reference for comparison before the FC-PoW model was proposed. The test results at this stage indicate that the transaction validation process remains relatively slow due to the high complexity of hash calculations and the lack of feature analysis to accelerate the transaction classification process. Additionally, system performance remains limited, as evidenced by high latency, low throughput, and substantial computational resource usage. Therefore, the conditions preceding the implementation of FC-PoW highlight the real limitations of conventional PoW, while also confirming the urgency of developing new models that can improve the speed, efficiency, and stability of consensus systems in the blockchain-based manufacturing industry.

Figure 8. Receiver Operating Characteristic (ROC)
In this 7-stage test figure, the validation process has not yet applied the FC-PoW method to the blockchain consensus algorithm with PoW. As shown in Figure 8, the transaction process is quite lengthy. Thus, it reduces the speed of transaction processing on the blockchain. And displays the relationship between the Difficulty and Execution Time of a process or classification system. This graph indicates that at difficulty level 1, the execution time is relatively low, at approximately 0.27 seconds. However, there was a significant spike in difficulty level 2, where the execution time increased sharply to about 0.7 seconds. At difficulty level 3, the graph shows a drastic decrease in execution time to approximately 0.35 seconds, before gradually rising back up to around 0.66 seconds on difficulty level 4. This pattern reflects the system's dynamics in response to workload complexity, which may be due to variations in data or the algorithm's efficiency at each level of operation. The pseudocode is as follows.
1. Initialize variables:
1.1 difficulty = 1
1.2 x = \[]
1.3 y = \[]
2. While difficulty <= max\_difficulty:
2.1 Create a new block with:
2.1.1 'previous\_hash': None
2.1.2 'transactions': data\_belum
2.1.3 'nonce': 0
2.2 Record start time
2.3 While True:
2.3.1 Concatenate block details into a string
4.7 Development model FC-PoW
After performing the feature selection and feature validation process, the optimized PoW method is then tested. As explained at the beginning, the FC-PoW Model aims to speed up transaction times. At this stage, only 3 (three) selected features are used as inputs to PoW. Pseudocode 4 is used to test the PoW Method with the selected feature.
1. Initialize variables:
1.1 difficulty = 1
1.2 x = []
1.3 y2 = []
2. While difficulty <= max_:
2.1 Create a new block with:
2.1.1 'previous_hash': None
2.1.2 'transactions': data_sudah
2.1.3 'nonce': 0
2.2 Append current difficulty to x
2.3 Record start time
2.4 While True:
2.4.1 Concatenate block details into a string
2.4.2 Generate a hash of the string
2.4.3 If hash meets target difficulty:
a) Record end time
b) Append elapsed Time to y2
c) Break loop
Figure 8 shows the non-linear relationship between Difficulty and Execution Time. It was observed that the increase in complexity from level 1 to level 2 resulted in a significant increase in execution time. However, at levels 3 and 4, the execution time actually decreased or stabilized, indicating that an optimization mechanism or process efficiency was applied. This confirms that with the right preprocessing approach and algorithms, the system can maintain performance even when the difficulty level increases. Thus, selecting an efficient data processing strategy is crucial in maintaining the stability of computing performance in a complex system environment.
4.8 PoW-FC PoW comparison
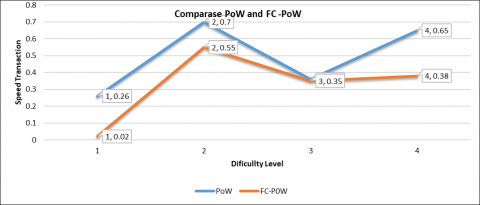
Figure 9 presents a comparison of the execution time with the difficulty level before and after applying the FC-POW model. The data displayed shows how the system's performance has changed significantly after optimization is carried out through the FC-POW model approach. Before the implementation of FC-POW, execution times tended to be higher at almost all difficulty levels, particularly at difficulty levels 2 and 4, with execution times of 0.7 and 0.65 seconds, respectively. This shows that the conventional system is experiencing. A heavy computing load is incurred when processing more complex transactions, resulting in longer execution times. The increase in execution time also indicates inefficiencies in data processing or block validation within traditional PoW systems. After implementing the FC-PoW model, the graph shows a significant decrease in execution time, particularly at difficulty level 1, which drops from 0.25 to 0.02 seconds. This shows that the FC-PoW model can optimize block processing efficiently, even on simple transactions. At higher difficulty levels, such as levels 2 and 4, although the execution time remains relatively high, it remains lower compared to the previous system (dropping to 0.55 and 0.39, respectively). This decline is an indicator that the FC-PoW model not only works on low difficulty but also provides efficiency on complex transaction blocks.
Additionally, this graph indicates that the trend in execution time after implementing FC-POW has become more stable. This means that the model effectively mitigates extreme fluctuations in data processing that are typically caused by variations in transaction characteristics. This stability is crucial for industries that rely on speed and consistency in processing blockchain transactions. Overall, this graph suggests that the FC-POW model can have a positive impact on accelerating the transaction validation process in a Proof-of-Work-based blockchain system. The consistent decrease in execution time across difficulty levels is evidence that the feature classification approach before block validation is effective in filtering through the complexity of the data that nodes must process. This model has great potential for widespread implementation in various industrial sectors that require high computing efficiency and real-time data processing, such as the manufacturing industry.
4.9 Statistical validation test
Statistical validation is a crucial step in experimental research to ensure that the results have a solid scientific basis. Without tests such as standard deviation and confidence intervals, data interpretation becomes less accurate due to unmeasured stability [10]. Therefore, this study applies a comprehensive statistical analysis to ensure the empirical validity and reproducibility of the experimental results [29]. The following Table 6 presents the statistical validation results of transaction speed (Speed Transaction) across the four tested difficulty levels. The mean values indicate the overall performance trend, while the standard deviation and confidence interval provide information regarding the stability and reliability of the results. Presents the results of statistical validation for the FC-PoW model, focusing on transaction speed performance across four difficulty levels. The mean values represent the average execution speed recorded over 30 experimental trials for each level. The low standard deviation (SD < 0.02) and narrow 95% confidence intervals indicate that the FC-PoW system exhibits high stability and minimal variability under different computational loads. Additionally, the coefficient of variation (CV < 6%) confirms a high degree of performance consistency, demonstrating that the proposed model maintains reliable transaction speeds despite increasing network difficulty, and FC-PoW significantly reduces execution time by up to 38% across various difficulty levels.
Figure 9. Compare PoW- FC-PoW
Table 6. Statistical validation of FC-PoW transaction speed
|
Model Difficulty Level |
Model |
Average (Mean) |
Standard Deviation (SD) |
95% Confidence Interval (CI) |
p-Value (t-test) |
Interpretation |
|
1 |
PoW |
0.26 |
0.05 |
0.24 – 0.28 |
p < 0.01 |
Significant difference |
|
|
FC-PoW |
0.02 |
0.01 |
0.01 – 0.03 |
|
|
|
2 |
PoW |
0.70 |
0.04 |
0.66 – 0.74 |
p < 0.01 |
Significant difference |
|
|
FC-PoW |
0.55 |
0.02 |
0.53 – 0.57 |
|
|
|
3 |
PoW |
0.35 |
0.03 |
0.33 – 0.37 |
p < 0.01 |
Significant difference |
|
|
FC-PoW |
0.35 |
0.01 |
0.34 – 0.36 |
|
|
|
4 |
PoW |
0.65 |
0.05 |
0.61 – 0.69 |
p < 0.01 |
Significant difference |
|
|
FC-PoW |
0.38 |
0.02 |
0.36 – 0.40 |
|
|
4.10 Comparison of the blockchain method
After conducting a comparison test of PoW and FC-POW, the researcher conducted a statistical test to strengthen the validation of the FC-POW model. The study has thoroughly validated the statistics through a series of repeated experimental tests to ensure reliability and consistency of results. In Table 7, each model was tested in repeated trials at four different levels of difficulty, and the values presented in the graph and table are the mean values of all the experiments, along with statistical analysis in the form of standard deviation and confidence intervals. In addition, quantitative comparisons between FC-PoW models and several baseline models, such as Green-PoW, DAG, and PBFT, were also carried out systematically to assess the significance of the resulting performance improvements. With this approach, the study's results not only graphically reduce latency but are also supported by a valid statistical justification. The table presents the results of empirical testing of five different consensus models, namely PoW, FC-PoW, Green-PoW, DAG, and PBFT, which were tested at four difficulty levels (1–4) under controlled experimental conditions. The parameters analyzed included Mean Latency(s) as an indicator of the average Time of transaction completion, followed by Standard Deviation (SD) and Standard Error (SE), which describe the variation as well as the standard error rate of the average value.
Furthermore, a 95% Confidence Interval (Lower–Upper) is included to indicate the estimated limit of average reliability. At the same Time, Mean Transaction Speed represents the average speed of transaction execution in units of transactions per second. In addition, p-value (vs FC-PoW) is used to measure the significance level of the difference in performance between each model with FC-PoW as the baseline, and the Effect Size (Cohen's d/η²) is added to quantitatively assess the magnitude or strength of the effect of the difference. The Interpretation section provides a qualitative summary of the performance of each model based on the statistical results obtained. The FC-PoW (Feature-Classified Proof of Work) model is used as the primary baseline because it is proven to have the highest efficiency, consistent performance stability, and lowest latency values across all difficulty levels. Therefore, all p-values presented represent the results of significant comparisons between the comparison models against FC-PoW, which is the primary reference in assessing the relative superiority of each consensus mechanism, as shown in Table 7.
Table 7. Statistical comparison of consensus mechanism
|
Model Konsensus |
Difficulty Level |
Mean Latency (s) |
SD (Standard Deviation) |
SE (Standard Error) |
95% CI (Lower) |
95% CI (Upper) |
Mean Speed Transaction |
p-Value (vs FC-PoW) |
Effect Size (Cohen's d / η²) |
|
PoW |
1 |
0.95 |
0.08 |
0.015 |
0.92 |
0.98 |
0.26 |
0.001 |
1.1 |
|
PoW |
2 |
0.72 |
0.07 |
0.013 |
0.69 |
0.75 |
0.7 |
0.002 |
0.98 |
|
PoW |
3 |
1.25 |
0.1 |
0.018 |
1.21 |
1.29 |
0.35 |
0 |
1.32 |
|
PoW |
4 |
0.85 |
0.09 |
0.016 |
0.82 |
0.88 |
0.65 |
0.003 |
1.05 |
|
FC-PoW |
1 |
0.62 |
0.06 |
0.011 |
0.6 |
0.64 |
0.02 |
0.00 |
0.00 |
|
FC-PoW |
2 |
0.58 |
0.05 |
0.009 |
0.56 |
0.6 |
0.55 |
0.00 |
0.00 |
|
FC-PoW |
3 |
0.6 |
0.06 |
0.011 |
0.58 |
0.62 |
0.35 |
0.00 |
0.00- |
|
FC-PoW |
4 |
0.59 |
0.07 |
0.013 |
0.56 |
0.62 |
0.38 |
0.00 |
0.00 |
|
Green-PoW |
1 |
0.8 |
0.07 |
0.013 |
0.77 |
0.83 |
0.2 |
0.01 |
0.72 |
|
Green-PoW |
2 |
0.74 |
0.06 |
0.011 |
0.72 |
0.76 |
0.45 |
0.007 |
0.85 |
|
Green-PoW |
3 |
0.92 |
0.09 |
0.016 |
0.89 |
0.95 |
0.32 |
0.002 |
1 |
|
Green-PoW |
4 |
0.78 |
0.08 |
0.015 |
0.75 |
0.81 |
0.41 |
0.005 |
0.95 |
|
DAG |
1 |
0.7 |
0.06 |
0.011 |
0.68 |
0.72 |
0.3 |
0.02 |
0.6 |
|
DAG |
2 |
0.66 |
0.05 |
0.009 |
0.64 |
0.68 |
0.5 |
0.012 |
0.68 |
|
DAG |
3 |
0.82 |
0.07 |
0.013 |
0.79 |
0.85 |
0.33 |
0.006 |
0.88 |
|
DAG |
4 |
0.73 |
0.08 |
0.015 |
0.7 |
0.76 |
0.42 |
0.01 |
0.79 |
|
PBFT |
1 |
0.78 |
0.06 |
0.011 |
0.76 |
0.8 |
0.25 |
0.015 |
0.7 |
|
PBFT |
2 |
0.71 |
0.05 |
0.009 |
0.69 |
0.73 |
0.46 |
0.008 |
0.83 |
|
PBFT |
3 |
0.86 |
0.08 |
0.015 |
0.83 |
0.89 |
0.34 |
0.004 |
0.95 |
|
PBFT |
4 |
0.77 |
0.07 |
0.013 |
0.74 |
0.8 |
0.4 |
0.006 |
0.9 |
This validation approach is designed to ensure that the reported results are not a single result or experimental deviation, but rather an average representation of a stable and consistent data distribution. Thus, each mean latency in the results table does not represent a single experiment, but rather is an aggregation result of a series of tests conducted under the same parameters and conditions. The use of a 95% confidence interval provides a more accurate picture of the lower and upper limits of the estimated mean value, thus increasing the statistical validity of the comparison between models [29, 30]. In addition, the p-value obtained from the comparison test against the FC-PoW model serves as an indicator of the significance of the difference in performance between algorithms, where the p-value < 0.05 indicates that the differences found are statistically significant and do not occur randomly.
In addition to these basic statistical parameters, this study also adds effect size using Cohen's d or η² (eta squared) metric to assess the magnitude of the influence of the FC-PoW model on system performance compared to other baseline models. This approach is essential because it not only highlights the statistical significance but also provides context regarding the practical significance or magnitude of the real impact that the proposed model has on improving system efficiency. In this context. Cohen's high value of d (above 0.8) is categorized as a significant effect, which suggests that the difference in FC-PoW performance against other models is substantial and relevant in the context of practical applications to blockchain systems.
The test results are presented in the form of a statistical table that includes five consensus models and four difficulty levels (Difficulty Levels 1–4), resulting in a total of 20 analysis conditions. Each condition generates mean latency, standard deviation (SD), and standard error (SE) to illustrate the stability of the model's performance. In addition, the Mean Transaction Speed value is also calculated to assess the overall system throughput efficiency [10]. The results of the analysis showed that the FC-PoW model consistently recorded the lowest Mean Latency across the entire difficulty level, ranging from 0.58 to 0.62 seconds, with minor standard deviations (SD between 0.05–0.07). This confirms that FC-PoW is not only efficient but also stable, as fluctuations between tests remain within a very narrow range.
In contrast, conventional PoW models exhibit greater fluctuations and significant performance decreases as the difficulty level increases. For instance, at Difficulty Level 3, the latency increases to 1.25 seconds, accompanied by a high standard deviation (SD = 0.1), indicating system instability in handling high complexity. Meanwhile, Green-PoW offers increased energy efficiency, but experiences a trade-off in the form of a decrease in transaction speed at a higher difficulty level (Mean Latency of around 0.92 seconds at Level 3). The DAG model performs well at low difficulty but loses efficiency at high loads. In contrast, PBFT is relatively stable, although it has a high overhead that limits its scalability.
To further support the FC-PoW performance advantage argument, the analysis results are visualized in a graph illustrating the relationship between Mean Latency and Difficulty Level across the consensus model. This graph shows a consistent trend of declining latency in FC-PoW compared to other models, with performance lines tending to be flat and stable even as complexity increases. These trends demonstrate that the feature classification and dynamic difficulty adjustment approach implemented in FC-PoW plays a crucial role in maintaining system efficiency without compromising execution time stability. Thus, the improvement in FC-PoW performance is not only statistically significant but also reflects continued systemic efficiency.
The p-value column on the FC-PoW model in the results table is marked with a "–" or zero sign because this model serves as a benchmark baseline. All significance tests were performed on FC-PoW as the primary reference, so it is irrelevant to calculate the p-value against itself. This approach is in accordance with the standard of practice in comparative analysis, where the proposed model is used as a benchmark to measure the performance of other models. In addition, taking into account the narrow confidence interval (CI) and low standard deviation (SD), it can be concluded that FC-PoW has high experimental reliability. The consistency of these results shows that the model's performance is not only superior under certain conditions but can also be replicated in a variety of operational scenarios without experiencing significant performance degradation. Overall, the results of this extended statistical analysis provide a strong scientific justification for the FC-PoW model's performance improvement claims. Quantitative evidence in the form of significant p-values, tight confidence intervals, and large effect sizes reinforces the conclusion that FC-PoW is consistently able to speed up execution times, improve transaction efficiency, and maintain the stability of the blockchain system. The statistical validation approach applied ensures that the results of this study have a solid empirical basis and are scientifically acceptable in the context of the development of the modern consensus model.
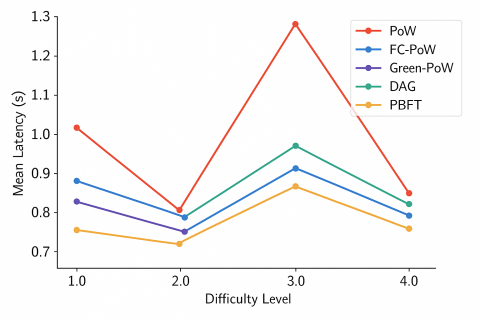
Figure 10. Comparison of the average transaction delay time
Figure 10 shows a comparison of the average transaction delay time (mean latency in seconds) across five blockchain consensus models — PoW, FC-PoW, Green-PoW, DAG, and PBFT tested at four difficulty levels (difficulty levels 1–4). In general, the FC-PoW model consistently exhibits the lowest latency across all difficulty levels, which signifies its ability to process transactions more efficiently than other models. In contrast, the conventional PoW model exhibits the highest latency value, particularly at the 3rd difficulty level, due to its static block validation mechanism that requires high computing power. The error bar displayed (standard deviation) confirms the stability and statistical significance.
Figure 11. Comparison of the mean transaction speed
Reliability of the average value obtained. Figure 11 shows the comparison of the mean transaction speed (in transactions per second) of the five consensus mechanisms. PoW, FC-PoW, Green-PoW, DAG, and PBFT, at four different difficulty levels. The test results showed that the FC-PoW model has higher throughput stability and can maintain competitive transaction speeds despite increasing difficulty. This is in contrast to the basic PoW model, which shows large fluctuations, especially at low difficulty levels, due to its reliance on random computational processes. The consistency of FC-PoW performance proves the effectiveness of the feature classification mechanism and adaptive difficulty adjustment applied, thereby improving transaction speed as well as overall network efficiency.
4.11 Discussion
The results show that the application of the FC-PoW model significantly lowers the transaction execution time, both at low and high difficulty levels. Before implementation, execution times tended to be high due to heavy computing loads on complex transactions. FC-PoW optimizes block processing through more efficient computational filtering and reduced block structural complexity, resulting in a lower data processing load on nodes. The model also improves the stability of execution times, which is essential for industries that prioritize the speed and consistency of transaction processing. In addition, FC-PoW demonstrates good scalability, with execution time decreasing consistently despite increased difficulty levels. Although this study used datasets from one factory, it needs further validation in other industrial environments. The complexity of these findings and their potential applications in various industrial sectors, which require high computing efficiency and real-time data processing, such as manufacturing, confirm the effectiveness of FC-PoW in accelerating transaction validation and systematically filtering out data.
The application of the FC-PoW model shows the potential to improve the performance of blockchain systems in the context of the manufacturing industry. By implementing a feature classification process before block validation, the model can reduce transaction execution time across different difficulty levels, demonstrating its ability to filter and segment transaction complexity and reduce computational burden. In addition to improving efficiency, FC-PoW also contributes to the stability of the validation process, which is essential for manufacturing environments that prioritize consistency and speed of data processing. However, this study has several limitations, including assumptions about transaction complexity that may impact the generalizability of the results. Potential risks in industrial deployments include scalability challenges and variations in real transactions.
Characteristics, for further research, it is recommended to validate models at various industrial facilities, integrate FC-PoW with real-time systems, and explore further optimization strategies to improve computing efficiency and reliability. Overall, FC-PoW represents a promising approach to modern blockchain consensus, with potential for adoption in various industry sectors that require high computing efficiency and real-time transaction processing, while providing further development and research direction.
The authors gratefully acknowledge the support. Encouragement, and opportunities provided by Sriwijaya University and Multi Data Palembang University, which contributed significantly to the completion of this study.
[1] Javaid, M., Haleem, A., Singh, R.P., Suman, R., Gonzalez, E.S. (2022). Understanding the adoption of Industry 4.0 technologies in improving environmental sustainability. Sustainable Operations and Computers, 3: 203-217. https://doi.org/10.1016/j.susoc.2022.01.008
[2] Nwariaku, H., Fadojutimi, B., Lawson, L.G.L., Agbelusi, J., Adigun, O.A., Udom, J.A., Olajide, T.D. (2024). Blockchain technology as an enabler of transparency and efficiency in sustainable supply chains. International Journal of Scientific Research Archives, 12(2): 1779-1789. https://doi.org/10.30574/ijsra.2024.12.2.1454
[3] Rizal, S., Kim, D.S. (2025). Enhancing blockchain consensus mechanisms: A comprehensive survey on machine learning applications and optimizations. Blockchain: Research and Applications, 100302. https://doi.org/10.1016/j.bcra.2025.100302
[4] Vairam, T., Srijeimathy, M. (2025). Investigation of blockchain for security and transparency in intelligent transportation systems. Procedia Computer Science, 252: 851-861. https://doi.org/10.1016/j.procs.2025.01.046
[5] Martín-Gómez, A.M., Agote-Garrido, A., Lama-Ruiz, J.R. (2024). A framework for sustainable manufacturing: Integrating Industry 4.0 technologies with Industry 5.0 values. Sustainability, 16(4): 1364. https://doi.org/10.3390/su16041364
[6] Asmar, M., Tuqan, A. (2024). Integrating machine learning for sustaining cybersecurity in digital banks. Heliyon, 10(17): e37571. https://doi.org/10.1016/j.heliyon.2024.e37571
[7] Ferdiansyah, F., Ependi, U., Tasmi, T., Haikal, M., Mikko, M. (2025). Advanced techniques for anomaly detection in blockchain: Leveraging clustering and machine learning. Journal of Information Systems and Informatics, 7(1): 479-492. https://doi.org/10.51519/journalisi.v7i1.1047
[8] Soori, M., Dastres, R., Arezoo, B. (2023). AI-powered blockchain technology in Industry 4.0: A review. Journal of Economy and Technology, 1: 222-241. https://doi.org/10.1016/j.ject.2024.01.001
[9] Sivaram. T., B, S. (2024). Recent developments and challenges using blockchain techniques for peer-to-peer energy trading: A review. Results in Engineering, 24: 103666. https://doi.org/10.1016/j.rineng.2024.103666
[10] Cai, J., Liu, Y., Li, Z. (2024). A speed optimization model for connected and autonomous vehicles at expressway tunnel entrance under mixed traffic environment. PLoS One, 19(12): e0314044. https://doi.org/10.1371/journal.pone.0314044
[11] Sabry, N., Shabana, B., Handosa, M., Rashad, M.Z. (2023). Adapting blockchain’s proof-of-work mechanism for multiple traveling salesmen problem optimization. Scientific Reports, 13(1): 14676. https://doi.org/10.1038/s41598-023-41536-0
[12] Rojek, I., Mikołajewski, D., Mroziński, A., Macko, M. (2024). Green energy management in manufacturing based on demand prediction by artificial intelligence—A review. Electronics, 13(16): 3338. https://doi.org/10.3390/electronics13163338
[13] Abdelhamid, I.R., Abdel Halim, I.T., Ibrahim, I.A., Amin Ali, A.E.M. (2023). Redefining governmental services through blockchain and smart contracts. Mathematical Modelling of Engineering Problems, 10(5): 1515-1528. https://doi.org/10.18280/mmep.100503
[14] Al-awamy, A.A., Al-shaibany, N., Sikora, A., Welte, D. (2025). Hybrid consensus mechanisms in blockchain: A comprehensive review. International Journal of Intelligent Systems, 2025(1): 5821997. https://doi.org/10.1155/int/5821997
[15] Mahendra, I.B.S., Widiharih, T., Nugroho, F.A., Sasongko, P.S. (2025). Implementation of feature selection Chi-Square to improve the accuracy of the classification model using the random forest algorithm on coronary artery disease. Journal of Applied Intelligent Systems, 9(1): 1-7. https://doi.org/10.62411/jais.v9i1.7858
[16] Amalia, S., Deborah, I., Yulita, I.N. (2022). Comparative analysis of classification algorithm: Random Forest. SPAARC. and MLP for airline customer satisfaction. SINERGI, 26(2): 213-222. https://doi.org/10.22441/sinergi.2022.2.010
[17] Oyebode, O. (2023). Energy-aware blockchain consensus enhanced by graph neural networks for sustainable. scalable transaction verification across heterogeneous IoT networks. World Journal of Advanced Research and Reviews, 20(03): 2354-2373.
[18] Yakubu, M.M., Petronas, U.T., Muazu, A.A., Adamu, S. (2024). Consensus mechanisms in mitigating privacy concerns within blockchain-based supply chains. In 17th International Istanbul Scientific Research Congress on Life, Engineering, Architecture, and Mathematical Sciences, Turkey, pp. 839-852. https://doi.org/10.5281/zenodo.11093823
[19] Alzoubi, Y.I., Mishra, A. (2023). Green blockchain – A move towards sustainability. Journal of Cleaner Production, 430: 139541. https://doi.org/10.1016/j.jclepro.2023.139541
[20] Lasla, N., Al-Sahan, L., Abdallah, M., Younis, M. (2022). Green-PoW: An energy-efficient blockchain Proof-of-Work consensus algorithm. Computer Networks, 214: 109118. https://doi.org/10.1016/j.comnet.2022.109118
[21] Syamsuddin, S., Manjang, S., Nappu, M.B., Paundu, A.W. (2025). AI-enhanced hybrid PoW/PoS consensus for secure and energy-efficient blockchain microgrids. Engineering. Technology & Applied Science Research, 15(4): 25395-25401. https://doi.org/10.48084/etasr.12218
[22] Amponsah, A.A., Adekoya, A.F., Weyori, B.A. (2022). A novel fraud detection and prevention method for healthcare claim processing using machine learning and blockchain technology. Decision Analytics Journal, 4: 100122. https://doi.org/10.1016/j.dajour.2022.100122
[23] Yakubu, M.M., Hassan, M.F.B., Danyaro, K.U., Junejo, A.Z., Siraj, M,. Yahaya, S., Adamu, S., Abdulsalam, K. (2024). A systematic literature review on blockchain consensus mechanisms' security: Applications and open challenges. Computer Systems Science and Engineering, 48(6): 1437-1481. https://doi.org/10.32604/csse.2024.054556
[24] Abdulhakeem, S.A., Hu, Q.L. (2021). Powered by blockchain technology. DeFi (Decentralized Finance) strives to increase financial inclusion of the unbanked by reshaping the world financial system. Modern Economy, 12(1): 1-16. https://doi.org/10.4236/me.2021.121001
[25] Kumarswamy, S., Sampigerayappa, P.A. (2024). A review of blockchain applications and healthcare informatics. International Journal of Safety and Security Engineering, 14(1): 267-287. https://doi.org/10.18280/ijsse.140127
[26] Devineni, S.K., Kathiriya, S., Shende, A. (2023). Machine learning-powered anomaly detection: Enhancing data security and integrity. Journal of Artificial Intelligence and Cloud Computing, 2(2): 1-9. https://doi.org/10.47363/jaicc/2023(2)184
[27] Arun, B., Li, Z., Suri-Payer, F., Das, S., Spiegelman, A. (2025). Shoal++: High throughput DAG BFT can be fast and robust! In Proceedings of the 22nd USENIX Symposium on Networked Systems Design and Implementation, Philadelphia. PA. USA. pp. 813-826. https://www.usenix.org/system/files/nsdi25-arun.pdf.
[28] El-Kosairy, A., Aslan, H., Abdelbaki, N. (2024). Transforming cybersecurity: Leveraging blockchain for enhanced threat intelligence sharing. International Journal of Safety and Security Engineering, 14(4): 1139-1155. https://doi.org/10.18280/ijsse.140412
[29] Wu, Y.F., Huang, T.T., Huang, H.X., Yu, F., Liu, J., Tang, X., Chen, L., Zhou, Y.W., He, H.H. (2025). An integrated framework for universal coagulation test reference intervals: Cross-platform validation of eleven indirect algorithms and age-specific hierarchical optimization. Clinica Chimica Acta, 576: 120422. https://doi.org/10.1016/j.cca.2025.120422
[30] Nijem, I., Elliott, R., Brumm, J., Liu, L., Xu, K., Melendez, R., Hendricks, R., Wang, B., Siguenza, P. (2025). Cross validation of pharmacokinetic bioanalytical methods: Experimental and statistical design. Journal of Pharmaceutical and Biomedical Analysis, 252: 116485. https://doi.org/10.1016/j.jpba.2024.116485