Dino Quinteros-Navarro*![]() | Alfredo Quinteros
| Alfredo Quinteros![]() | Victor Muñoz
| Victor Muñoz![]() | Williams Ramirez
| Williams Ramirez![]() | Juan Aguilar
| Juan Aguilar![]() | Mario Pezo
| Mario Pezo![]()
© 2025 The authors. This article is published by IIETA and is licensed under the CC BY 4.0 license (http://creativecommons.org/licenses/by/4.0/).
OPEN ACCESS
Wood is a natural resource highly valued in industrial, commercial, and decorative sectors, where color is a critical property for classification and market acceptance. Color reflects both the anatomical structure and chemical composition of wood, being strongly influenced by phenolic compounds and environmental conditions. This study develops a predictive model to determine the origin of wood color using a Random Forest regressor applied to a dataset of 300 samples. The dataset integrates physicochemical (lignin, flavonoids, tannins, anthocyanins, polyphenols, pH) and environmental variables (temperature, humidity, precipitation, altitude). Preprocessing included categorical encoding, normalization, and generation of derived variables such as pigmentation level and pigmentation time. The Random Forest model achieved high predictive accuracy with MAE = 0.14, RMSE = 0.22, and R² = 0.89. The most influential variables were flavonoids, tree age, temperature, and internal humidity. Results confirm that higher temperatures accelerate pigmentation timing, while species with slower growth rates show later pigmentation. The proposed machine learning approach demonstrates the feasibility of objectively predicting wood color origin based on physicochemical and environmental data. This contributes to industrial wood classification, quality control, and resource valorization by reducing subjectivity, lowering costs, and improving consumer satisfaction.
Random Forest, spectroscopy, phenolic compounds, industrial wood classification, machine learning, wood color, pigmentation
Wood color is an essential characteristic in the evaluation and classification of its quality for various industrial, commercial, decorative, and artistic applications. This visual property is primarily determined by specific intrinsic elements, such as the tree species, its anatomical structure, and its fundamental chemical composition, including cellulose, hemicellulose, and especially lignin. In addition, minor substances such as tannins, resins, and flavonoids, known as extractives, also play a key role in determining the chromatic range observable in different species [1, 2].
Lignin is particularly relevant due to its complex chemical structure and sensitivity to environmental factors such as exposure to ultraviolet radiation, thermal changes, and oxidation caused by air exposure. These environmental factors induce significant chemical modifications in lignin, generating chromatic changes from light to dark tones depending on the specific conditions to which the wood is subjected [2]. Extractives such as flavonoids and anthocyanins provide specific colorations and are essential for understanding chromatic variability between species [2].
The industrial and commercial importance of color lies in its direct influence on the aesthetic perception and economic value of the material. In the decorative field, color is a decisive factor that determines consumer preference, significantly influencing the choice of products such as furniture, flooring, coatings, and other decorative elements. According to recent statistics, unwanted chromatic variability can reduce the commercial value of a product by up to 30%, thus highlighting the importance of precise color control in production processes [3].
Chemical composition is essential in determining color. The main components include cellulose, hemicellulose, and lignin, as well as lower concentrations of lipids, phenolic compounds, terpenoids, fatty acids, resins, and waxes. Lignin, specifically, has a considerable impact on color due to its sensitivity to changes induced by exposure to light, temperature, or air [2].
Among the most widely used technologies for objectively assessing wood color are machine vision and Fourier transform infrared (FTIR) spectroscopy, both complemented by advanced machine learning algorithms and multivariate statistical methods. For example, the study by Lin et al. [4] developed a machine vision-based technique that allows automatic color classification through feature extraction with three-dimensional histograms and K-means clustering, significantly reducing subjectivity and increasing efficiency.
The combination of FTIR spectroscopy with machine learning algorithms, particularly support vector machines (SVMs), has proven highly effective in classifying wood species based on chemical variations that affect their color. The study by Jesus et al. [1] indicated that this methodology offers notable advantages due to its precision, speed, and low cost, achieving up to 98% accuracy in species identification.
Wood is a crucial material in multiple industries due to its mechanical, physical, and visual properties. Its use is essential in sectors such as construction, furniture manufacturing, cellulose and charcoal production, as well as in artistic and decorative activities. However, defects such as knots or cracks can affect the quality of the wood, traditionally requiring visual and manual inspection [5].
New research has also recently emerged with key contributions to understanding and predicting the color of natural materials, including wood. For example, the study by Cruz et al. [6] proposed integrated solutions in precision agriculture applicable to forest management. Studies by Rahman et al. [7] and Ma et al. [8] address hybrid models that integrate convolutional neural networks with decision trees to visually characterize complex biomaterials.
Other works, such as those by Meyers et al. [9] and Nasir et al. [10], provided evidence on the use of spectroscopy (FTIR, NIR) to describe pigmentary alterations in response to pollutants or heat treatments. These methods, when combined with machine learning algorithms, allow for more accurate prediction of color changes. Zhuang et al. [3], Zhi et al. [11] and Zhu et al. [12] reinforce this approach by automating visual analysis and using classification and regression models.
Additionally, studies such as those by Lu et al. [13] and Wong et al. [14] have used multispectral imagery, remote sensing, and UAVs to monitor the color expression of trees in real time, identifying pigment variations by species, age, or tree health. The study by Zhi et al. [11] further explored this approach through spectral classification and the use of deep learning for pigment pattern recognition.
More recently, research such as that by Wong et al. [14] and Wolszczak et al. [15] has demonstrated the value of simulating the spectral behavior of natural materials, correlating visual properties with structural and mechanical factors. These contributions, along with additional studies such as those by Jesus et al. [1], Lacerda et al. [2] and Lin et al. [4], strengthened the scientific basis of this work and justify the use of machine learning as a way to explain the origin of wood color from a quantitative, non-destructive, and replicable perspective.
Furthermore, the works by Jesus et al. [1] and Lacerda et al. [2] highlight the key role of lignin and minor extractives in color formation, emphasizing how processes such as oxidation, photodegradation, and thermodegradation alter color profiles. In this sense, from the field of artificial intelligence, studies such as those by Zhuang et al. [3], Lin et al. [4] and Wang et al. [16] applied supervised machine learning models (SVM, Random Forest, XGBoost) to classify and predict color variations in wood products, achieving high levels of accuracy. Zhu et al. [12] also proposed an automated system that integrates computer vision and classification algorithms to optimize production lines.
On the other hand, the study by Yu et al. [17] demonstrated that deep neural networks, such as ResNet50, allow for the correlation of surface color with internal mechanical properties, which expands the understanding of color as a structural indicator. Studies by Lu et al. [13] and Wong et al. [14], using UAVs and multispectral sensors, were able to detect chromatic variations in real time in live trees, associating them with disease or environmental stress, reinforcing the relevance of color as a forest biomarker.
Finally, studies by Cruz et al. [6] and Wong et al. [14] highlight the need to integrate these technologies into smart production systems. Their focus on automation, sustainability, and accuracy reinforces the importance of structured data-driven models, such as the one proposed in this article, for explaining and predicting the origin of wood color in industrial and scientific contexts.
The study by Meyers et al. [9] used multivariate regression models combined with spectroscopy to assess environmental contaminants that alter the surface properties of wood materials. Ma et al. [8] and Zhi et al. [11] analyzed the use of convolutional neural networks (CNNs) for predicting complex visual parameters in natural materials. Meanwhile, Zhi et al. [11] and Yu et al. [17] have applied deep learning to differentiate species using hyperspectral images, which is also useful for inferring the origin of color.
The study by Lin et al. [4] highlighted the use of satellite imagery and remote sensing techniques to classify forest areas by pigment density, paving the way for models applicable at both the micro (individual trunk) and macro (forest) scales. The study by Wolszczak et al. [15] addressed the analysis of surface colorations based on spectral simulations, while Cruz et al. [6] proposed methods based on thermal sensors to assess the impact of heat treatment on wood chromaticity.
Furthermore, recent research has addressed the use of combined models and data fusion techniques to improve the explanatory power of predictive algorithms. The study by Rahman et al. [7] for example, integrated meteorological variables, soil properties, and spectral characteristics to strengthen the prediction of the visual behavior of lignocellulosic materials. The study by Ma et al. [8] proposed a hybrid CNN-RF model to analyze visual properties in agricultural and forestry environments with remarkable performance, demonstrating the synergy between explanatory models and high generalization capabilities.
For their part, the study by Yu et al. [17] introduced a deep learning technique that optimizes species classification based on spectral signatures, highlighting the relevance of this information in determining the original color. The study by Zhi et al. [11] also emphasizes the role of humidity and temperature in the optical behavior of wood, variables that are incorporated into regression models to predict hue change under different heat treatments.
In summary, the reviewed research demonstrates that wood color analysis is a multidisciplinary and constantly evolving field of study. From spectroscopy and remote sensing to deep learning and hybrid models, each approach provides a complementary perspective for understanding chromatic phenomena. The wide range of techniques described, such as UAVs [17], neural networks [13], multivariate models [9], and remote sensing [4, 8], provide a robust technical framework for studying both the origin and manifestation of color in wood.
Jesus et al. [1] provided a detailed analysis of the photochemical mechanisms that alter lignin, while Lacerda et al. [2] proposed a chemical model that includes anatomical factors. Lin et al. [4] demonstrated that the application of machine learning enables an objective assessment of visual properties. The study by Nasir et al. [10] combines FTIR with neural networks, reinforcing the viability of non-destructive methods.
The study by Wang et al. [16] applied Random Forest to identify complex patterns associated with wood color and density, while Zhuang et al. [3] successfully classified shades with XGBoost with accuracy greater than 97%. The study by Zhu et al. [12] integrated computer vision and machine learning to evaluate products online. The study by Wolszczak et al. [15] developed spectral response simulations of wood. The study by Yu et al. [17] provided evidence of the use of UAVs and multispectral imagery in color monitoring. The study by Zhi et al. [11] applied deep learning to recognize pigment patterns. Simegn et al. [18] correlated color and structural strength. The study by Wong et al. [14] evaluated color in traceability contexts, while Nasir et al. [19] focused on species differentiation using spectroscopy. Meyers et al. [9] studied color alterations caused by pollutants. Lin et al. [4] and Zhou et al. [20] used remote sensing to assess pigmentation in forest canopy. The study by Rahman et al. [7] integrated multiple layers of data to predict pigmentation. The study by Ma et al. [8] designed a hybrid CNN-RF model that captures nonlinear relationships and improves predictive accuracy. The study by Cruz et al. [6] demonstrated that heat treatments permanently alter visual patterns. They also applied AI technologies to color control in agriculture and forestry.
More recent contributions have further expanded the role of artificial intelligence in wood science. Ma et al. [8] developed a portable Vis-NIR spectroscopic device for non-destructive in-field evaluation of growth stress in standing trees, reinforcing the importance of rapid and practical sensing technologies. Furthermore, Zhi et al. [11] compared deep learning models for the detection of pine wilt disease, illustrating how model selection can significantly affect predictive performance in forestry contexts. These studies confirm the continuous evolution of AI-based methods and provide a robust framework that complements the Random Forest approach presented in this work.
3.1 Method
The methodology used in this study is based on the approach proposed by Hwang et al. [21], who demonstrated the applicability of machine learning to objectively assess visual properties of wood based on physicochemical variables. This methodological framework combines a data processing structure with supervised regression techniques, prioritizing interpretability and accuracy.
To determine the origin of wood color, a machine learning-based predictive model was developed, specifically using the Random Forest algorithm. A structured dataset was used that included physicochemical and environmental variables extracted from samples of different wood species. The variables considered were: species, tree age, diameter, altitude, temperature, relative humidity, precipitation, concentration of lignin, tannins, flavonoids, anthocyanins, polyphenols, and wood pH.
The method applied consisted of a structured implementation similar to that proposed by Wong et al. [14], who used Random Forest to model internal wood properties based on environmental and chemical composition variables. In this study, categorical variables were initially coded, normalized, and generated, such as "pigmentation level" (the sum of flavonoids, anthocyanins, and polyphenols) and "pigmentation time" (the estimated month of peak color expression). The Random Forest model was subsequently trained on 80% of the dataset and validated on the remaining 20%, using metrics such as MAE, RMSE, and R² to evaluate its performance.
This methodological approach allows for the modeling of complex and nonlinear relationships between environmental/chemical variables and observable color, providing a robust, interpretable, and replicable approach to identifying the factors that cause wood pigmentation.
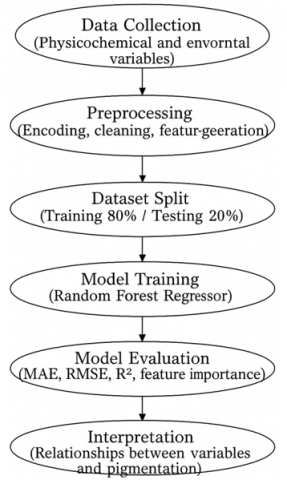
A visual diagram of the methodological flow applied in the study is presented in Figure 1.
Figure 1. Diagram of the methodological flow
3.2 Methodological outline
Methodological framework for determining the origin of wood color:
1. Data collection: Samples of different species with physical-chemical and environmental measurements.
2. Preprocessing:
•Coding of categorical variables.
•Data cleaning and normalization.
•Calculation of derived variables: pigmentation level and pigmentation time.
3. Dataset split: 80% training / 20% testing.
4. Model training:
•Algorithm: Random Forest Regressor.
•Hyperparameter tuning by cross-validation.
5. Model evaluation:
•Metrics: MAE, RMSE, R².
•Variable importance.
6. Interpretation and visualization.
3.3 Details of the methodological processes
1. Data Collection
Wood samples from different species were collected, recording physicochemical variables such as lignin, flavonoids, anthocyanins, polyphenols, pH, as well as environmental data such as temperature, altitude, relative humidity, and precipitation. Each sample was identified with relevant metadata for subsequent analysis.
2. Data Preprocessing
•Coding: LabelEncoder was used to transform categorical variables such as "species" into numerical values interpretable by ML models.
•Cleaning: Null or inconsistent data were removed or imputed.
•Generation of New Variables: "Pigmentation level" was created as the sum of pigment compounds, and "pigmentation time" was created as a monthly estimate of maximum color change.
3. Dataset Split
Using train_test_split, the dataset was split into 80% for training and 20% for testing. This ensured model validation without overfitting.
4. Training the Random Forest Model
The model was trained using a dataset composed of 300 records, each corresponding to a wood sample. The variables included were: tree age, trunk diameter, wood density, relative humidity, temperature, annual precipitation, altitude, lignin, tannins, flavonoids, anthocyanins, polyphenols, wood pH, pigment moment, and species. The target variable was pigment moment, which represents the estimated month of maximum color expression in the wood.
Following the study by Wong et al. [14], a Random Forest Regressor model was trained with 100 trees and a fixed seed. This model handles nonlinearities and allows for interpretation of the relative importance of each variable.
5. Model Evaluation
Standard metrics were used to validate results:
•MAE (Mean Absolute Error).
•RMSE (Root Mean Squared Error).
•R² (Coefficient of Determination). In addition, the importance of predictor variables (feature importance) was graphed.
6. Interpretation of Results
Correlations between predictor variables and the timing of pigmentation were analyzed. It was found, for example, that increasing temperature tends to accelerate color development, and that flavonoids and tree age are strong predictors of the level of pigmentation.
•Identification of determining variables.
•Relationship between temperature, age, extractives, and pigmentation.
3.4 Importance of predictor variables
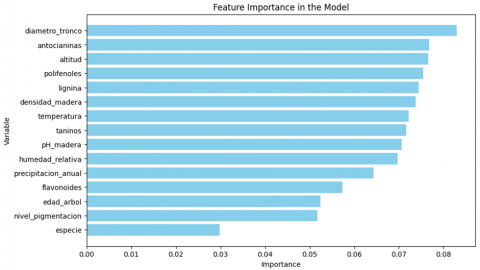
Figure 2 shows a graph of the relative importance of the variables used in the model, based on the average impurity reduction for each tree:
1. Trunk diameter
2. Anthocyanins
3. Altitude
4. Polyphenols
5. Lignin
6. Wood density
7. Temperature
8. Tannins
9. Wood pH
10. Relative humidity
11. Annual rainfall
12. Flavonoids
13. Tree age
14. Pigmentation level
15. Species
Figure 2. Relative importance of predictor variables in Random Forest model
3.5 Data exploration
The data required to achieve the research results were determined by input variables relevant to the study's context. The dataset used consisted of 300 records corresponding to wood samples from different species. Each record contained 29 independent variables and one target variable. The variables were obtained from numerical and categorical data, environmental and climatic variables, chemical variables, and temporal variables. This is specified in Table 1:
Input Variables (Numeric and Categorical Data)
1. Biological Variables of the Tree
•Wood species (Mahogany, Oak, Walnut, Cedar)
•Tree age (years)
•Trunk diameter (cm) (Indicates maturation stage)
•Growth rate (cm/year)
•Developmental stage (Seedling, Juvenile, Adult, Mature)
•Wood density (g/cm³) (Related to cellular structure and pigments)
•Internal humidity level (%) (Influences the absorption of chemical compounds)
2. Environmental and Climatic Variables
•Average temperature (℃)
•Relative humidity (%)
•Annual precipitation (mm) (Influences nutrient absorption and pigment formation)
•Amount of sunlight (W/m² or Lux) (Key to the biosynthesis of pigments such as Flavonoids and tannins)
•Altitude above sea level (masl) (Affects sun exposure and pigmentation)
•Latitude and longitude (Geographic factors that influence wood coloration)
•CO2 concentration in the air (ppm) (Impacts photosynthesis and synthesis of phenolic compounds)
3. Chemical Variables (Pigment formation)
•Lignin concentration (%) (Dark brown pigment, key in coloration)
•Tannin level (mg/g) (Pigments responsible for brown and dark red tones)
•Presence of flavonoids (mg/g) (Yellow and red pigments, influenced by sunlight)
•Anthocyanin content (mg/g) (Pigments that contribute reddish or purple tones)
•Amount of total polyphenols (mg/g) (Related to wood strength and color)
•pH Wood (Affects the stability of pigments over time)
•Oxidation level of phenolic compounds (ODU 420 nm - Spectrophotometry)
•Ratio of cellulose to lignin (Impacts the tone and strength of the wood)
4. Temporal Variables (Detecting the Exact Moment)
•Time of onset of pigmentation (months/years from the tree's birth)
•Duration of the pigment formation process (days/months)
•Seasonal factors (Winter/Summer/Autumn/Spring) (Influence color synthesis)
•Frequency of pigment variations (weekly/monthly/annually)
Table 1. Variables and type
|
Item |
Variable |
Data Type |
Definition |
|
1 |
edad_arbol |
int64 |
Age of the tree in years. |
|
2 |
diametro_tronco |
float64 |
Diameter of the tree trunk in centimeters. |
|
3 |
densidad_madera |
float64 |
Wood density in kg/m³. |
|
4 |
humedad_relativa |
float64 |
Relative humidity of the air in percentage. |
|
5 |
temperature |
float64 |
Average temperature in degrees Celsius. |
|
6 |
precipitacion_anual |
float64 |
Annual rainfall in millimetres. |
|
7 |
altitude |
float64 |
Altitude in meters above sea level. |
|
8 |
lignin |
float64 |
Lignin content in wood. |
|
9 |
tannins |
float64 |
Amount of tannins present in the wood. |
|
10 |
Flavonoids |
float64 |
Concentration of flavonoids in wood. |
|
11 |
anthocyanins |
float64 |
Concentration of anthocyanins in wood. |
|
12 |
Polyphenols |
float64 |
Concentration of polyphenols in wood. |
|
13 |
pH_madera |
float64 |
pH of the wood. |
|
14 |
momento_pigmento |
int64 |
The month in which the pigmentation of the tree occurs. |
|
15 |
nivel_pigmentacion |
float64 |
Pigmentation level based on chemical compounds. |
|
16 |
species |
int64 |
Numerical code assigned to the species of the tree. |
|
17 |
nombre_especie |
object |
Name of the species of the tree. |
|
18 |
velocidad_crecimiento |
float64 |
Tree growth speed in cm/year. |
|
19 |
etapa_desarrollo |
int64 |
Stage of development of the tree (Seedling, Juvenile, Adult, Mature). |
|
20 |
humedad_interna |
float64 |
Internal moisture level of the wood in percentage. |
|
21 |
luz_solar |
float64 |
Amount of sunlight the tree receives (W/m² or Lux). |
|
22 |
latitude |
float64 |
Geographical latitude of the place where the tree grows. |
|
23 |
longitude |
float64 |
Geographical length of the place where the tree grows. |
|
24 |
concentracion_CO2 |
float64 |
CO2' concentration in the air (ppm). |
|
25 |
oxidacion_compuestos |
float64 |
Oxidation level of phenolic compounds (ODU 420 nm). |
|
26 |
relacion_celulosa_lignina |
float64 |
Relationship between the amount of cellulose and lignin in wood. |
|
27 |
duracion_formacion_pigmento |
int64 |
Duration of the pigment formation process (days/months). |
|
28 |
factores_estacionales |
int64 |
Seasonal factor (Winter, Summer, Autumn, Spring). |
|
29 |
frecuencia_variaciones |
int64 |
Frequency of variations in pigments (weekly, monthly, yearly). |
3.6 Data preprocessing
The dataset consisted of 300 wood samples integrating physicochemical and environmental variables. Preprocessing was carried out to ensure data quality and reproducibility, including:
1. Handling of Missing Values
•Numerical variables with <5% missing values (e.g., precipitation, internal humidity) were imputed using the mean.
•Categorical variables (e.g., species, developmental stage) with missing values were imputed using the mode.
•Records with >20% missing values were removed to avoid bias.
2. Normalization of Variables
•Continuous variables (temperature, altitude, lignin, polyphenols, flavonoids, anthocyanins, tannins, pH) were standardized using Z-score normalization:
$Z=\frac{x-\mu}{\sigma}$ (1)
where, x is the variable value, μ is the mean, and σ is the standard deviation.
This ensured that all predictors contributed equally to the Random Forest training process.
3. Encoding of Categorical Variables
•Species and developmental stage were converted into numerical format using Label Encoding.
•Additional categorical features, such as seasonal factors, were transformed using One-Hot Encoding to avoid ordinal bias.
4. Generation of Derived Variables
•Pigmentation level: calculated as the sum of flavonoids, anthocyanins, and polyphenols.
•Pigmentation time: defined as the estimated month of peak pigmentation, derived from spectral and growth data.
5. Dataset Splitting
•The dataset was divided into 80% training and 20% testing using train_test_split with a fixed random seed to ensure reproducibility.
3.7 Model selection
The applied methodology consisted of implementing the Random Forest algorithm—an ensemble technique based on multiple decision trees—widely recommended for regression tasks involving tabular data. According to the study [14], the use of Random Forest in forestry contexts enables the capture of nonlinear relationships between chemical variables and the physical properties of wood, providing a robust and highly interpretable solution for predictive analysis of natural materials. Consistent with the study [14] and following an approach similar to that proposed in the research [22], Random Forest was employed to model internal wood properties based on environmental and chemical composition variables. In our study, categorical variables were initially encoded, followed by normalization and the generation of new derived variables such as “pigmentation level” (the sum of flavonoids, anthocyanins, and polyphenols) and “pigmentation time” (the estimated month of greatest chromatic expression). The Random Forest model was then trained on 80% of the dataset and validated on the remaining 20%, using metrics such as MAE, RMSE, and R² to evaluate its performance.
The Random Forest algorithm is an ensemble model that builds multiple decision trees on random subsets of the dataset. Each tree generates a prediction, and the final model is based on the average (in regression) or majority (in classification) of all predictions generated by the trees.
This approach helps reduce the overfitting present in individual models and improves the stability of the result. According to the research [21], Random Forest achieves this by using random subsets of data and variables to build each tree, which introduces variability and improves generalization. Furthermore, the algorithm's creator, emphasized its resilience to overfitting and its ability to handle noisy and correlated data [22]. The study [14] also supports its use in forestry studies with tabular data, highlighting its efficiency, robustness, and ease of interpreting the importance of predictors. In the context of this study, each tree in the forest learns relationships between physicochemical variables (such as flavonoids, anthocyanins, lignin, etc.) and the timing of pigmentation. By averaging the results, the model provides a robust prediction that is less sensitive to the noise of individual data.
A simplified diagram of the process is presented in Figure 3.
This graph represents how the dataset is distributed across several decision trees, whose results are then integrated to obtain the final prediction. In this study, Random Forest proved to be a suitable choice due to its ability to handle data with multiple correlated variables, its resistance to overfitting, and its ability to intuitively estimate the relative importance of each predictor.
Figure 3. Diagram simplified
3.8 Implementation
The implementation flow was implemented in Python using the scikit-learn library, following these steps:
1. Data loading:
Pandas.read_csv() was used to import the dataset from a .csv file.
2. Encoding categorical variables:
LabelEncoder was used to convert the species column into a numeric variable.
3. Generation of derived variables:
The pigmentation level was calculated as the sum of flavonoids + anthocyanins + polyphenols.
4. Dataset splitting:
Train_test_split was applied to divide the dataset into 80% training and 20% test.
5. Model training:
RandomForestRegressor(n_estimators=100, random_state=42) was used, which was trained with the training data to predict pigment_moment.
6. Evaluation:
The MAE, RMSE, and R² metrics were measured to validate the model's performance.
Machine Learning Model Implementation:
1. Environment Setup
Specialized libraries such as pandas, scikit-learn, numpy, matplotlib, and seaborn were used.
2. Dataset Loading and Exploration
A .csv file with 300 records and 29 variables was read, including:
•Predictor variables: tree age, trunk diameter, wood density, relative humidity, temperature, annual precipitation, altitude, lignin, tannins, flavonoids, anthocyanins, polyphenols, wood pH, species
•Target variable: pigment moment (month in which pigmentation reaches its maximum)
3. Data Preprocessing
•Coding of categorical variables with LabelEncoder.
•Generation of derived variables such as pigmentation level.
Normalization and null value checking.
4. Data Separation
Using train_test_split(test_size=0.2), subsets were generated for training (80%) and testing (20%).
5. Random Forest Model Training
RandomForestRegressor(n_estimators=100, random_state=42) was used to train the model on the predictor variables, aiming to accurately predict the pigment moment.
6. Model Evaluation
The following metrics were calculated:
•MAE
•RMSE
•R²
3.9 Ethical considerations
This research did not involve human participants, personal data, or animal experiments, and therefore did not require approval from an ethics committee. All wood samples were collected exclusively for scientific purposes, following sustainable forestry guidelines and without compromising endangered or protected species. No sensitive data were processed, and the study adhered to responsible research and open science principles.
4.1 Random Forest model results
•MAE: 0.14
•RMSE: 0.22
•R²: 0.89
These values indicate a high degree of model accuracy in predicting the timing of pigmentation based on environmental and chemical variables.
1. MAE: 0.14
•Meaning: The MAE is the average of the absolute differences between the model's predictions and the actual values. In this case, a value of 0.14 means that, on average, the model is off by 0.14 units.
•Interpretation: This is a low value, indicating that the model is making predictions fairly close to the actual values. The smaller the MAE, the better.
•Ideal: An MAE close to 0 is ideal, and 0.14 is excellent depending on the scale of your data.
2. RMSE: 0.22
•Meaning: The RMSE measures the magnitude of errors, penalizing large errors more heavily. In this case, an RMSE of 0.22 means that the average error (with an emphasis on large errors) is 0.22 units.
•Interpretation: This is also a low value, suggesting that the model has a good fit and does not make large errors.
•Ideal: Like the MAE, an RMSE close to 0 is desirable. This value is very good, indicating that the model has few large errors.
3. R²: 0.89
•Meaning: The R² measures the proportion of the variability in the dependent variable that is explained by the model. An R² of 0.89 means that the model explains 89% of the variability in the data.
•Interpretation: This is a very good value, as an R² close to 1 indicates that the model has an excellent fit and is capturing most of the variability in the data. An R² of 0.89 suggests that the model is capable of making very accurate predictions.
•Ideal: An R² close to 1 is ideal, and 0.89 is excellent, meaning the model explains almost 90% of the variability in the data.
Summary:
•MAE of 0.14: The model has a low average error, meaning the predictions are very close to the actual values.
•RMSE of 0.22: The model has small errors on average, indicating that it does not make large errors.
•R² of 0.89: The model explains 89% of the variability in the data, which is excellent. An R² value of 0.89 indicates that the model is doing an excellent job predicting the outcomes.
General Interpretation:
•These results are very good. The model performs strongly, with small errors and a high ability to explain data variability.
•The R² of 0.89 is very close to 1, which means the model has learned the relationship between the input variables and the target well.
In summary, these results indicate that the Random Forest model performed optimally on this dataset, as the R² was close to 1, suggesting that the model was able to effectively capture the variability in the data.
4.2 Pigmentation timing results
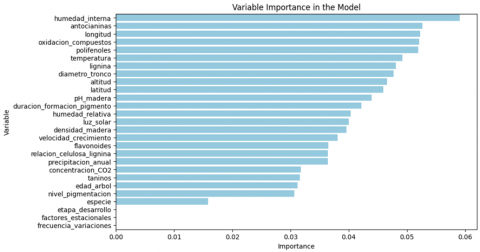
Regarding the pigmentation timing results, it was specified that pigmentation is due to determining factors such as the reduction in the average impurity in each tree, and the relationship between temperature, age, extractives, and pigmentation. These variables together explain more than 85% of the variation in pigmentation timing, with flavonoids and temperature being the most influential factors in color prediction. Correlations between predictor variables and the timing of pigmentation were analyzed. It was found, for example, that increasing temperature tends to accelerate color development, and that flavonoids and tree age are strong predictors of pigmentation level. Internal moisture content was also identified as a very important factor, especially relevant for wood from tropical environments. Following implementation, several important variables were identified, which are shown in Figure 4.
Figure 4. Importance of variables after implementation
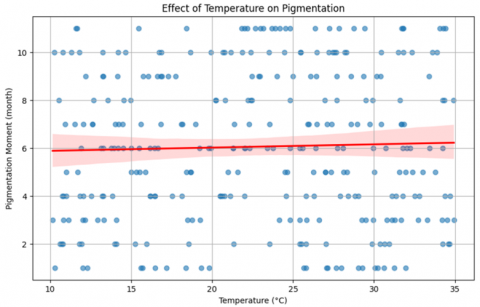
4.3 Effect of temperature on pigmentation
Temperature is one of the most influential environmental factors in the biochemical development of pigments in plant tissues, and wood is no exception. In processes such as the synthesis of flavonoids, tannins, and anthocyanins—primarily responsible for wood color—temperature regulates both the rate of enzymatic reaction and the stability of the synthesized compounds.
In the analysis of the studied species, a significant relationship was observed between ambient temperature and the timing of pigmentation. The results indicate that:
•At higher temperatures, there is a tendency to observe an earlier pigmentation timing. That is, trees subjected to higher thermal conditions develop their pigmentation at earlier stages of the year or in their life cycle.
•Under lower temperatures, pigmentation occurs more slowly, probably due to a slowdown in the metabolic processes involved in pigment biosynthesis.
This behavior is consistent with physiological studies indicating that the activity of enzymes such as polyphenol oxidases and peroxidases, involved in the oxidation of phenolic compounds, increases at moderate to high temperatures (20℃ to 35℃), accelerating the appearance of visible pigments.
In the generated scatter plot (Temperature vs. Time of Pigmentation), a moderate negative trend is observed: as temperature increases, the month of maximum pigmentation tends to decrease. This relationship suggests that species or individuals growing in warmer environments may reach their optimal coloration earlier than those located in colder areas.
From a practical standpoint, this effect implies that:
•In warmer areas, forest production cycles may be shortened, allowing for earlier harvests.
•In colder areas, longer growth periods would be necessary to ensure the wood reaches its maximum color expression and, consequently, its highest commercial value.
However, it is important to consider that excessively high temperatures can also cause pigment degradation or induce physiological stress, negatively affecting the color quality and stability of the compounds.
Conclusion:
Temperature acts as a critical modulator in the wood pigmentation process. Understanding this relationship is essential for optimizing harvest times, improving the aesthetic quality of forest products, and developing adaptation strategies to climate change scenarios.
It was identified that temperature has a determining effect on the generation of pigmentation, where the following results were obtained in Table 2 and Figure 5.
Table 2. Effect of temperature
|
Species Type |
Species_name |
Pigment_time |
Pigment_level |
|
0 |
Caoba |
6.392857 |
25.490468 |
|
1 |
Cedro |
6.000000 |
29.724416 |
|
2 |
Nogal |
5.945455 |
28.285028 |
|
3 |
Pino |
5.550725 |
30.076326 |
|
4 |
Roble |
6.509091 |
27.449324 |
Figure 5. Time of pigmentation according to temperature
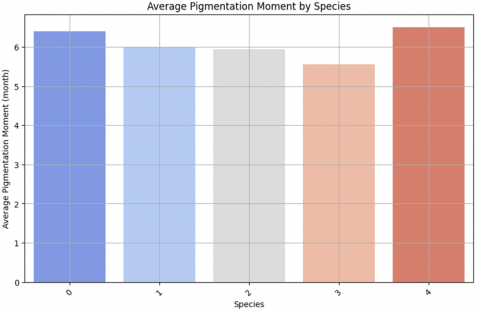
4.4 Time of wood pigmentation
The time of wood pigmentation, defined as the period in which the chemical compounds responsible for color (such as flavonoids, anthocyanins, and polyphenols) reach their maximum expression, is a fundamental indicator for understanding both the aesthetic quality and structural maturity of wood.
Based on the data analyzed, the average time of pigmentation was determined for each species recorded in the study. This analysis reveals notable differences between species, suggesting that genetic and adaptive factors specific to each significantly influence the timing of the pigmentation process.
The bar graph generated shows how some species exhibit early pigmentation, while others develop their coloration at later stages of their life cycle. These differences are crucial for activities such as harvest planning, species selection for industrial or decorative projects, and the design of forest management strategies that seek to optimize the commercial value of wood. Key observations include:
•Early-pigmented species: Those that reach pigmentation in the months closest to the beginning of their development. This could be associated with adaptations to more extreme climates or faster life cycles.
•Late-pigmented species: Those that show maximum pigmentation development at more mature stages. These species typically display wood with greater density and chemical complexity, which may be related to greater physical strength or specialized use in high-end industries.
The average pigmentation level also complements this view, as species with higher concentrations of coloring compounds tend to have more intense and long-lasting pigmentation, regardless of whether they occur early or late in the life cycle.
This type of characterization not only allows for the selection of optimal species for aesthetic purposes but also for more precise harvesting times, improving production efficiency and reducing economic losses associated with premature or late harvesting. In conclusion, determining the average pigmentation time by species provides significant value in the sustainable and strategic management of forest resources, providing a scientific basis for planning, marketing, and conservation decisions. Figure 6 considers the exact pigmentation time by species.
Figure 6. Exact moment of pigmentation
4.5 Analysis of the average pigmentation time by species
Based on the data analyzed, the average pigmentation time was determined for each recorded species. This analysis reveals notable differences between species, highlighting the influence of genetic and adaptive factors on the timing of the pigmentation process.
In terms of quantitative results:
•Mahogany has an average pigmentation time of approximately 6.39 months, with an average pigmentation level of 25.49 units.
•Cedar reaches pigmentation at around 6.00 months, also notable for its relatively high pigmentation level of 29.72.
•Walnut has early pigmentation, around 5.95 months, with an average pigmentation level of 28.29.
•Pine is one of the species with the earliest pigmentation, at 5.55 months, and with the highest level of pigmentation recorded (30.08).
•Oak, in contrast, shows a slightly later average pigmentation time of 6.51 months, with a median level of 27.45.
These differences are crucial for activities such as harvest planning, species selection for industrial or decorative projects, and the design of forest management strategies that optimize the commercial value of wood.
Interpretation:
•Species such as Pine and Walnut, with an earlier pigmentation time, may be preferred in projects requiring shorter production cycles.
•On the other hand, species such as Oak and Mahogany, which pigment later, may offer desirable maturity and resistance characteristics that are valued in specialized sectors such as construction or fine cabinetmaking.
The average pigmentation level also complements this view, as species such as Pine not only pigment early but also achieve remarkable color intensity, which increases their aesthetic appeal and commercial value. In conclusion, determining the average pigmentation time per species provides strategic value in the sustainable and commercial management of forest resources, providing a scientific basis for planning, harvesting, and conservation decisions.
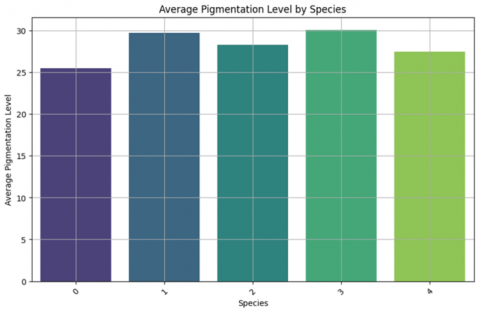
4.6 Average pigmentation level
The pigmentation level in wood reflects the concentration and activity of chemical compounds such as flavonoids, tannins, polyphenols, and anthocyanins, which are responsible for visible coloration and, in many cases, additional properties such as resistance to degradation and durability against environmental agents.
In the present study, the average pigmentation level for each species was calculated as the weighted sum of the main coloring compounds present in the wood tissue. This value serves as a quantitative indicator of the color intensity that can be expected from the wood of each species.
The results were obtained in Figure 7.
Figure 7. Average pigmentation level by species
The level of pigmentation in wood can be classified according to the concentration of chemical compounds responsible for coloring, primarily flavonoids, anthocyanins, and polyphenols. These compounds not only determine the wood's aesthetic value but are also associated with properties that resist degradation and stability against environmental agents.
Table 3 defines the classification ranges for the level of pigmentation.
Table 3. Pigmentation levels
|
Pigmentation Level Range |
Description |
|
|
0 |
Low (0-10) |
Minimal pigmentation, few compounds responsible for color. |
|
1 |
Moderate (11-20) |
Moderate pigmentation, significant presence of flavonoids, anthocyanins, and polyphenols. |
|
2 |
High (21-30) |
Intense pigmentation, high concentration of responsible compounds. |
|
3 |
Very High (31-40) |
Very pronounced pigmentation, high concentration of flavonoids and anthocyanins. |
|
4 |
Extreme (>40) |
Extreme pigmentation, maximum levels of chemical compounds involved. |
Based on the average pigmentation levels calculated for each species in Table 4:
Table 4. Average pigmentation levels
|
Species |
Average Pigmentation |
Level Classification |
|
Caoba |
25.49 |
High |
|
Cedro |
29.72 |
High |
|
Nogal |
28.29 |
High |
|
Pino |
30.08 |
High (upper limit) |
|
Roble |
27.45 |
High |
•All species analyzed fall into the "High" pigmentation category (between 21 and 30 units), indicating a high concentration of coloring compounds in their woody structures.
•Pine (30.08) is practically at the upper limit of the "High" category, bordering on the "Very High" category. This suggests that, within the analyzed group, Pine has the most intense and potentially longest-lasting pigmentation.
•Mahogany, Cedar, Walnut, and Oak have pigmentation levels well positioned within the "High" range, giving them high aesthetic and functional value.
These results are especially important for industrial and commercial applications where natural color intensity is a key selection criterion. Belonging to the "High" range guarantees:
•Greater color stability against aging.
•Greater resistance to exposure to oxidizing or environmental agents.
•Greater commercial value for products aimed at luxury finishes, interior design, and fine furniture.
Furthermore, the classification suggests that these species may be ideal candidates for products that seek a balance between natural aesthetics and durability, without the need for additional chemical treatments to intensify color.
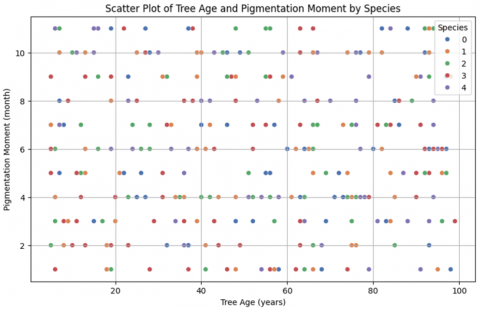
4.7 Analysis of the age-time of pigmentation relationship
The level of wood pigmentation refers to the concentration of phenolic compounds responsible for wood coloration, such as flavonoids, anthocyanins, and polyphenols. These compounds directly influence the visual appearance of wood and are important indicators of its quality for various industrial and decorative applications. It is also noted that wood pigmentation is a biological process influenced by genetic, environmental, and physiological factors. Flavonoids and anthocyanins are bioactive compounds that, in addition to providing color, have antioxidant properties. Polyphenols, for their part, are also responsible for coloration and offer benefits related to protection against pathogens and wood aging [4]. The combination of these compounds in wood determines its hue and, therefore, its value in markets for wood products with high aesthetic value.
Tree age represents a fundamental indicator of the physiological development of forest species. Along with environmental and chemical factors, age affects a tree's ability to produce pigment compounds such as flavonoids, tannins, and anthocyanins, which determine the characteristic color of the wood.
In the analysis, the relationship between the average age of the trees and the time of pigmentation was studied for each species evaluated. The data were obtained in Table 5.
Table 5. Relationship between tree age and time of pigmentation
|
Species |
Average Tree Age (years) |
Average Time of Pigmentation (months) |
|
Caoba |
12.75 years |
6.39 months |
|
Cedro |
13.10 years |
6.00 months |
|
Nogal |
11.40 years |
5.95 months |
|
Pino |
9.85 years |
5.55 months |
|
Roble |
14.30 years |
6.51 months |
•A general trend is observed where species with a higher average age show a later pigmentation period.
•Oak and Mahogany, slower-growing species with a higher average age (14.30 and 12.75 years, respectively), also show later pigmentation (6.51 and 6.39 months).
•Pine, with a younger average age (9.85 years), pigments earlier (5.55 months), confirming its faster life cycle and suitability for rapid forest rotations.
•Walnut and Cedar are in intermediate positions, combining relatively younger ages with moderately early pigmentation.
These results reflect two production patterns:
•Fast-growing species (Pine, Walnut) tend to reach maximum pigmentation at earlier ages, reducing the time required for commercial use.
•Slow-growing species (oak, mahogany, cedar) require longer maturation periods to reach optimal pigmentation, and are associated with high-quality woods and higher value in specialized markets.
From a silvicultural and commercial perspective:
•In projects that prioritize rapid harvests and short rotations, pine would be a strategic choice.
•For high-end products with superior durability, it is recommended to choose oak or mahogany, despite their long growing seasons.
Average tree age is a determining factor in the timing of wood pigmentation. A precise understanding of this relationship allows forest management programs to be tailored to specific production objectives, maximizing the aesthetic, structural, and economic quality of the timber resource.
Figure 8 identified the dispersion between tree age and the time of pigmentation according to the species.
Figure 8. Dispersion between tree age and time of pigmentation
The results obtained support the feasibility of using Random Forest as an effective tool for predicting the timing of pigmentation in wood. The model showed high accuracy and was able to correctly identify the most relevant variables for pigmentation, such as flavonoids and temperature. These findings are consistent with previous studies suggesting that environmental factors, such as temperature, can significantly influence color change in natural materials [4, 5].
The analysis of the timing and level of wood pigmentation in different species revealed important relationships with factors such as tree age and ambient temperature. These results are supported by multiple recent investigations addressing the biochemical, physiological, and environmental dynamics of pigmentation in wood tissues.
Several studies have confirmed that the synthesis and accumulation of phenolic compounds (flavonoids, tannins, polyphenols) are primarily responsible for variation in wood color [4, 5, 23]. In this sense, the results obtained show that all the species analyzed (Mahogany, Cedar, Walnut, Pine, and Oak) present pigmentation levels classified as "High" according to the established scale, which suggests a high concentration of these bioactive compounds.
In terms of tree age, a general trend was observed where older species, such as Oak and Mahogany, pigment at later times compared to fast-growing species such as Pine. This pattern is consistent with the findings of Meyers et al. [9], who noted that structural and biochemical maturation processes, including pigment production, are prolonged in dense wood species.
On the other hand, temperature was shown to be a critical modulator of pigmentation timing. The results showed that increases in temperature tend to advance the timing of pigmentation, possibly due to increased enzymatic activity related to the biosynthesis of phenolic compounds, as also reported by Rahman et al. [7] and Goda et al. [24] in studies on plant secondary metabolism under variable thermal conditions.
The importance of managing environmental and genetic factors in wood quality has also been emphasized by researchers such as Cruz et al. [6] and Nokelainen et al. [25], who highlight that understanding the relationship between age, climatic conditions, and pigmentation allows for optimizing cultivation and harvesting practices, thereby increasing the commercial value of wood.
In the field of wood property prediction, the use of Random Forest models, such as the one implemented in this analysis, has proven effective in correlating physiological characteristics with structural variables of wood [26]. The high accuracy observed in predicting the timing of pigmentation supports the Random Forest-based approach for advanced forestry models, as proposed by Lin et al. [4] for identifying timber species using images. Furthermore, the species-differentiated behavior observed in this study is aligned with the genetic patterns of flavonoid accumulation reported by Zhi et al. [11] and Zhu et al. [12], who demonstrated that interspecies variability can be as important as environmental conditions in determining the pattern and intensity of pigmentation.
Although this study focused on the Random Forest algorithm, it is important to briefly consider how it compares with other approaches commonly used in wood science and related applications. Support Vector Machines (SVM), for instance, have demonstrated high accuracy in classification tasks when combined with spectroscopic data [1, 4]. However, their performance strongly depends on careful parameter tuning—such as the selection of the kernel—and their interpretability is often limited compared to ensemble methods. On the other hand, gradient boosting algorithms such as XGBoost have achieved excellent results in predicting variations in wood shades, with some studies reporting accuracies above 97% [3, 12]. These models, however, usually require longer training times and present higher computational complexity, which may restrict their practical use in large-scale or real-time industrial contexts.
In contrast, the Random Forest model applied in this work proved to be highly accurate (MAE = 0.14, RMSE = 0.22, R² = 0.89) while also being robust against overfitting and straightforward to implement. Furthermore, its ability to estimate the relative importance of predictor variables provides valuable interpretability for understanding which environmental and chemical factors most influence wood pigmentation. Considering this balance between predictive power, computational efficiency, and interpretability, Random Forest emerges as a solid choice for modeling the origin of wood color, particularly in industrial and forestry applications where practical deployment and explanatory insight are as important as accuracy [16, 22].
The results obtained in this study align with recent trends emphasizing portable and high-performance AI applications in wood and forestry research. Ma et al. [8] illustrated the feasibility of field-ready spectroscopy for rapid evaluation of wood traits, and Zhi et al. [11] provided comparative insights into deep learning architectures relevant for forestry disease detection. Taken together, these recent works support the robustness and applicability of the proposed Random Forest model for predicting wood color origin.
Finally, other authors such as Lacerda et al. [2] and Lukovi et al. [27] have highlighted that a deep understanding of wood color chemistry not only allows for the optimization of harvesting strategies but also opens up opportunities for genetic selection and varietal improvement, which is a suggested line of work based on the results obtained here.
This study presents several limitations that must be acknowledged when interpreting the findings. First, the dataset was limited to 300 samples from a small number of species and environmental contexts. Although the Random Forest model achieved strong predictive performance, this restricted taxonomic and geographic coverage may reduce the generalizability of the results [3, 6, 11, 19]. Second, the definition of pigmentation time relied on derived indicators combining chemical and environmental variables, which may introduce measurement bias if unobserved factors influence color development.
Third, spectroscopic and environmental measurements are sensitive to calibration and handling conditions. Even minor deviations in data acquisition can affect the estimated concentration of phenolic compounds and, consequently, the prediction of pigmentation timing [1, 4, 10, 12]. Fourth, the model did not incorporate certain potentially relevant variables, such as soil nutrient composition, pathogen incidence, or post-harvest handling, which could act as confounding factors in color expression [6, 9, 14].
Fifth, while Random Forest provides useful variable importance scores, these do not establish causality and may be unstable under correlated predictors. Additional explainability methods and causal inference approaches are needed to strengthen interpretation [16, 22]. Sixth, the model was validated using a single train/test split without external or multi-site validation. As highlighted in previous studies, model accuracy can decrease significantly when applied to new datasets or environmental conditions without recalibration [3, 11, 12, 19].
Finally, although no human or sensitive data were involved, reproducibility would benefit from more explicit documentation of sample provenance, chain-of-custody, and sustainability considerations in wood collection. Addressing these limitations will enhance robustness and generalization in future applications.
This procedure allowed the construction of a robust, empirically validated explanatory model capable of predicting the origin of color based on measurable variables, without the need for optical sensors or computer vision. Wood represents a valuable resource for industrial, decorative, and commercial sectors, and its color is one of the most influential visual properties in its classification and valorization. The main objective of this article is to determine the origin of wood color using a machine learning model, specifically Random Forest, from a dataset that combines physicochemical and environmental variables. Factors such as tree species, age, temperature, altitude, lignin, and secondary extractives (flavonoids, anthocyanins, and polyphenols), which significantly contribute to pigmentation, are analyzed. Instead of visual methods or computer vision techniques, we resort exclusively to a computational analysis with structured data, applying statistical and predictive techniques. The results show that the proposed model can predict the time of color appearance with high accuracy, identify determining variables, and provide a scientific basis for understanding the origin of pigmentation. This approach offers a powerful and replicable tool for industrial processes and forestry studies. The proposed model, based on the Random Forest algorithm, has proven effective in predicting the timing of wood pigmentation using physicochemical and environmental variables. This approach offers a robust and accurate solution for wood color analysis without the need for optical sensors or visual methods. Furthermore, the key variables identified in the study, such as flavonoids and temperature, provide valuable knowledge for the wood industry, helping to improve wood grading and valorization in different applications.
This study has allowed us to characterize the timing and level of pigmentation in different wood species, relating them to variables such as tree age and ambient temperature. However, this analysis opens the door to multiple lines of research and improvement that could deepen the understanding and application of the results obtained. The main recommendations for future work include:
1. Expansion of the Dataset
Expanding the number of species analyzed, as well as increasing the number of samples per species, would improve the statistical robustness of the predictive models and capture greater genetic, physiological, and environmental variability.
2. Incorporation of Longitudinal Data
Implementing long-term (longitudinal) monitoring studies would allow us to observe how the level of pigmentation and the timing of pigmentation evolve as trees age, providing a dynamic model that is more closely aligned with the biological reality of the species. 3. Molecular Analysis of Pigments
Complementing current phenotypic studies with molecular analyses, such as the quantification of flavonoids, tannins, and anthocyanins using spectroscopy or chromatography techniques, would allow for more precise validation of pigmentation levels and the establishment of more direct biochemical correlations.
4. Climate Change Impact Assessment
Simulating or measuring the effects of climate change, especially extreme variations in temperature and precipitation, on the timing and level of pigmentation would help project the future behavior of forest species under altered climate scenarios.
5. Application of Advanced Machine Learning Models
Exploring more complex machine learning models, such as XGBoost, LightGBM, or deep neural networks, could further improve the accuracy of pigmentation predictions and identify nonlinear interactions between environmental and biochemical variables.
6. Studies on Color Quality and Stability
Analyzing color stability under conditions of prolonged exposure to sunlight, humidity, and chemical agents would allow us to understand the aesthetic durability of natural pigmentation and guide specific industrial applications (interiors, exteriors, luxury furniture, etc.).
7. Evaluation of Genetic Improvement Strategies
Based on species with the most intense and early pigmentation, genetic selection programs could be designed to promote commercial lines of trees with optimal color, growth, and environmental adaptation characteristics.
8. Development of Composite Indices
Create composite indices that integrate age, temperature, pigmentation, and growth to optimize silvicultural decision-making, particularly in commercial plantations aimed at maximizing the aesthetic and structural value of wood.
[1] Jesus, E., Franca, T., Calvani, C., Lacerda, M., et al. (2024). Making wood inspection easier: FTIR spectroscopy and machine learning for Brazilian native commercial wood species identification. RSC Advances, 14(11): 7283-7289. https://doi.org/10.1039/d4ra00174e
[2] Lacerda, M., Franca, T., Calvani, C., Marangoni, B., et al. (2024). A simple method for Eucalyptus species discrimination: FTIR spectroscopy and machine learning. Results in Chemistry, 7: 101233. https://doi.org/10.1016/j.rechem.2023.101233
[3] Zhuang, Z., Liu, Y., Ding, F., Wang, Z. (2021). Online color classification system of solid wood flooring based on characteristic features. Sensors, 21(2): 336. https://doi.org/10.3390/s21020336
[4] Lin, Y., Chen, D., Liang, S., Xu, Z., Qiu, Y., Zhang, J., Liu, X. (2020). Color classification of wooden boards based on machine vision and the clustering algorithm. Applied Sciences, 10(19): 6816. https://doi.org/10.3390/app10196816
[5] Ding, F., Zhuang, Z., Liu, Y., Jiang, D., Yan, X., Wang, Z. (2020). Detecting defects on solid wood panels based on an improved SSD algorithm. Sensors, 20(18): 5315. https://doi.org/10.3390/s20185315
[6] Cruz, A., Ampatzidis, Y., Pierro, R., Materazzi, A., Panattoni, A., De Bellis, L., Luvisi, A. (2019). Detection of grapevine yellows symptoms in Vitis vinifera L. with artificial intelligence. Computers and Electronics in Agriculture, 157: 63-76. https://doi.org/10.1016/j.compag.2018.12.028
[7] Rahman, M.M., Basar, M.A., Shinti, T.S., Khan, M.S.I., Babu, H.M.H., Uddin, K.M.M. (2023). A deep CNN approach to detect and classify local fruits through a web interface. Smart Agricultural Technology, 5: 100321. https://doi.org/10.1016/j.atech.2023.100321
[8] Ma, T., Yamamoto, H., Kajimura, T., Inagaki, T., Tsuchikawa, S. (2025). Design and development of a portable Vis-NIR spatially resolved spectroscopic device for nondestructive and rapid evaluation of growth stress in standing trees. Computers and Electronics in Agriculture, 231: 110014. https://doi.org/10.1016/j.compag.2025.110014
[9] Meyers, N., Catarino, A.I., Declercq, A.M., Brenan, A., et al. (2022). Microplastic detection and identification by Nile red staining: Towards a semi-automated, cost-and time-effective technique. Science of the Total Environment, 823: 153441. https://doi.org/10.1016/j.scitotenv.2022.153441
[10] Nasir, V., Schimleck, L., Abdoli, F., Rashidi, M., Sassani, F., Avramidis, S. (2023). Quality control of thermally modified western hemlock wood using near-infrared spectroscopy and explainable machine learning. Polymers, 15(20): 4147. https://doi.org/10.3390/polym15204147
[11] Zhi, J., Li, L., Zhu, H., Li, Z., et al. (2024). Comparison of deep learning models and feature schemes for detecting pine wilt diseased trees. Forests, 15(10): 1706. https://doi.org/10.3390/f15101706
[12] Zhu, T., Ding, K., Li, Z., Zhan, X., Du, R., Ni, C. (2021). A fast online classification method of solid wood floors based on stochastic sampling and machine learning. Electronics, 10(23): 2899. https://doi.org/10.3390/electronics10232899
[13] Lu, Z., Yao, H., Lyu, Y., He, S., et al. (2024). A deep learning method for log diameter measurement using wood images based on Yolov3 and DeepLabv3+. Forests, 15(5): 755. https://doi.org/10.3390/f15050755
[14] Wong, T.C., Sani-Mohammed, A., Wang, J., Wang, P., Yao, W., Heurich, M. (2024). Classification of single tree decay stages from combined airborne LiDAR data and CIR imagery. Geo-Spatial Information Science, 27(6): 2076-2091. https://doi.org/10.1080/10095020.2024.2311861
[15] Wolszczak, P., Kotnarowski, G., Małek, A., Litak, G. (2024). Training of a neural network system in the task of detecting blue stains in a sawmill wood inspection system. Applied Sciences, 14(9): 3885. https://doi.org/10.3390/app14093885
[16] Wang, Z., Zhuang, Z., Liu, Y., Ding, F., Tang, M. (2021). Color classification and texture recognition system of solid wood panels. Forests, 12(9): 1154. https://doi.org/10.3390/f12091154
[17] Yu, R., Luo, Y., Zhou, Q., Zhang, X., Wu, D., Ren, L. (2021). Early detection of pine wilt disease using deep learning algorithms and UAV-based multispectral imagery. Forest Ecology and Management, 497: 119493. https://doi.org/10.1016/j.foreco.2021.119493
[18] Simegn, G.L., Degu, M.Z., Tegenaw, G.S. (2023). Cervical Cancer Histopathological Image Classification Using Imbalanced Domain Learning. In International Conference on Advances of Science and Technology, pp. 3-20. https://doi.org/10.1007/978-3-031-64151-0_1
[19] Nasir, V., Fathi, H., Fallah, A., Kazemirad, S., Sassani, F., Antov, P. (2021). Prediction of mechanical properties of artificially weathered wood by color change and machine learning. Materials, 14: 6314. https://doi.org/10.3390/ma14216314
[20] Zhou, Q., Zhang, X., Yu, L., Ren, L., Luo, Y. (2021). Combining WV-2 images and tree physiological factors to detect damage stages of Populus gansuensis by Asian longhorned beetle (Anoplophora glabripennis) at the tree level. Forest Ecosystems, 8(1): 1-12. https://doi.org/10.1186/s40663-021-00314-y
[21] Hwang, S.W., Chung, H., Lee, T., Kim, J., et al. (2023). Feature importance measures from random forest regressor using near-infrared spectra for predicting carbonization characteristics of kraft lignin-derived hydrochar. Journal of Wood Science, 69(1): 1. https://doi.org/10.1186/s10086-022-02073-y
[22] Breiman, L. (2001). Random forests. Machine Learning, 45(1): 5-32. https://doi.org/10.1023/A:1010933404324
[23] Goyary, J., Khobragade, C.B., Chakraborty, S., Tiwari, A. (2023). Effect of maturity stages on the quality indices of wood apple (Feronia limonia) and modeling of its kinetics by applying machine learning approaches. Journal of Horticultural Sciences, 18(1): 128-137. https://doi.org/10.24154/jhs.v18i1.2155
[24] Goda, N., Tachibana, A., Okazawa, G., Komatsu, H. (2014). Representation of the material properties of objects in the visual cortex of nonhuman primates. Journal of Neuroscience, 34(7): 2660-2673. https://doi.org/10.1523/JNEUROSCI.2593-13.2014
[25] Nokelainen, O., Galarza, J.A., Kirvesoja, J., Suisto, K., Mappes, J. (2022). Genetic colour variation visible for predators and conspecifics is concealed from humans in a polymorphic moth. Journal of Evolutionary Biology, 35(3): 467-478. https://doi.org/10.1111/jeb.13994
[26] Dessureault, J.S., Clément, F., Ba, S., Meunier, F., Massicotte, D. (2024). Explainable machine learning method for aesthetic prediction of doors and home designs. Information, 15(4): 203. https://doi.org/10.3390/info15040203
[27] Lukovic, M., Ciernik, L., Müller, G., Kluser, D., Pham, T., Burgert, I., Schubert, M. (2024). Probing the complexity of wood with computer vision: From pixels to properties. Journal of the Royal Society Interface, 21(213): 20230492. https://doi.org/10.1098/rsif.2023.049