Bandi Sasmito*![]() | Bagus Hario Setiadji
| Bagus Hario Setiadji![]() | R. Rizal Isnanto
| R. Rizal Isnanto![]()
© 2025 The authors. This article is published by IIETA and is licensed under the CC BY 4.0 license (http://creativecommons.org/licenses/by/4.0/).
OPEN ACCESS
Road infrastructure plays a crucial role in urban development and public safety. To overcome the limitations of traditional road inspection methods, the study presents a real-time AI-based system that integrates YOLOv8 object detection with GNSS-based geolocation for the automatic detection and mapping of road faults. The system operates on Android smartphones, which are connected to cameras and GNSS receivers, allowing for synchronized image acquisition and position marking during surveys. A dataset consisting of 7,518 annotated road surface images was used to train the YOLOv8 model, achieving a precision of 82.9%, a recall of 81.8%, and an F1 score of 76.4% to detect common types of damage (e.g., potholes, cracks). Geographic coordinates extracted from images via Optical Character Recognition (OCR) are validated against ground truth GNSS measurements. Planimetric verification yielded a total RMS error of 5.523 m. GNSS signal quality affects variations in accuracy, the distance between the camera and the surface, and vehicle speed during data collection. Despite these irregularities, the location of the detected damage can still be verified in the field. This integrated solution offers scalable and efficient tools for georeferenced road condition monitoring, supporting data-driven infrastructure maintenance and planning.
road, Artificial Intelligence (AI), object detection, You Only Look Once (YOLO), road damage detection, Global Navigation Satellite System (GNSS), Optical Character Recognition (OCR)
The road network serves not only as a key indicator of a city’s development but also as a foundational element in urban planning. As such, proper management is essential to ensure its effective functioning and sustainability [1]. Despite their importance, roads often present hazardous conditions for both humans and animals, prompting extensive research aimed at reducing accidents and improving road safety [2, 3]. In response to these challenges, conventional methods of road damage inspection—traditionally conducted manually and visually—have gradually evolved into automated approaches driven by Artificial Intelligence (AI) [4].
One of the most significant developments in AI is object detection in images and videos, which is being increasingly utilized in applications such as road surface monitoring. These methods use machine learning algorithms that can interpret complex data inputs, such as images, text, or audio [5-7]. Machine Learning (ML) offers a practical approach to achieving AI’s broader objective of extracting meaningful patterns from data, resulting in high accuracy across various domains, including image classification, facial recognition, and even human pose estimation [8-10].
Among the many algorithms developed for object detection, You Only Look Once (YOLO) stands out for its speed and efficiency [11, 12]. As a single-stage detector, YOLO has undergone several updates, including YOLOv3, YOLOv4, YOLOv5, and, most recently, YOLOv8, each offering significant performance improvements [13-16]. Earlier models, such as YOLOv5 and YOLOv7, achieved real-time detection with respectable accuracy; however, they often faced limitations in complex scenes involving small or overlapping objects—typical in road environments with varied lighting and surface conditions. Moreover, their modular architectures required additional customization for tasks like instance segmentation or object tracking. Ultralytics YOLOv8, released on January 10, 2023, addresses these limitations by offering an integrated, end-to-end architecture comprising a Backbone, Neck, and Head, optimized for object detection, classification, and instance segmentation [17, 18]. Compared to YOLOv5, YOLOv8 delivers improved precision, faster inference times, and native support for TensorRT and ONNX deployment, making it highly suitable for mobile and edge computing [19, 20]. Compared to two-stage detectors like Faster R-CNN, YOLOv8 offers significantly lower latency while maintaining competitive accuracy, an essential advantage for real-time road monitoring applications. This justifies the selection of YOLOv8 in this study, aiming to achieve a balance between speed, accuracy, and deployment flexibility.
However, while YOLO-based models are effective at identifying road damage types such as cracks, potholes, and patches, they do not inherently provide geographic information about the detected objects. In geospatial applications, position is typically represented using geographic coordinates, latitude and longitude, and in some cases, altitude. Without spatial context, the practical utility of detected road damage remains limited, particularly for tasks involving maintenance planning, navigation, or public reporting. Most existing studies on road damage detection using YOLO (e.g., YOLOv5 or YOLOv7) focus solely on detection accuracy, without addressing how to georeference the detected damage effectively [21]. This gap hinders the real-world usability of such systems, particularly in mobile and field-based deployments.
To address this gap, this study integrates YOLOv8 with Global Navigation Satellite System (GNSS) data to automatically tag detected damage with real-world geographic coordinates. GNSS provides real-time, global positioning capabilities that are unaffected by weather conditions, making it an ideal choice for outdoor data collection [22, 23]. Integrating GNSS with image and video capture enables seamless synchronization between visual data and spatial information. Android smartphones provide an ideal platform for this integration, offering support for both USB and wireless communication with external devices, such as cameras and GNSS receivers [24, 25]. Within this system, YOLOv8 is employed to detect road surface damage, while Optical Character Recognition (OCR) is used to extract coordinate information displayed on the screen. OCR tools, known for their high accuracy in recognizing Latin characters, facilitate this extraction process [26, 27].
In this context, the primary objective of the study is to develop an integrated system capable of detecting road damage while simultaneously capturing its spatial location in the form of geographic coordinates. The proposed solution simulates real-time object detection enriched with location tagging and further validates the accuracy of these coordinates through field-based GNSS measurements. This approach enhances the practicality and reliability of automated road damage detection systems, making it easier to identify, locate, and address road defects in real-world environments.
The hardware configuration for the recording system uses a smartphone as the primary control and processing unit. The smartphone serves multiple functions, including managing the connected camera and GNSS receiver, running the data acquisition application, and storing the recorded image and position data. In addition to smartphones, tablet devices with compatible operating systems and sufficient hardware capabilities can also be used as alternatives. Tablets may offer larger screen sizes, which can improve user interaction during field operations, particularly for monitoring real-time video streams and reviewing positional accuracy. This flexibility in hardware selection allows the system to adapt to various operational needs and user preferences, making it suitable for a range of mobile data acquisition scenarios.
GNSS-based systems are particularly vulnerable to signal degradation in challenging environments such as urban canyons, tunnels, and dense foliage due to multipath effects and satellite signal obstructions [28]. These limitations can introduce significant positioning errors, often exceeding 10-20 meters in severe cases. To address these challenges, researchers have developed several mitigation strategies, including differential GPS (DGPS), real-time kinematic (RTK) correction, and sensor fusion with inertial measurement units (IMUs) [29, 30]. For this study, we selected the Beitian BN-220 DGPS receiver due to its optimal balance of portability, affordability (< $100), and demonstrated positioning accuracy (< 2.5 m in open sky conditions) compared to conventional GPS modules.
Figure 1. Recording equipment system design
In Figure 1, this image recording device and position meter are developed using Android technology. The recording and its position are displayed on the screen of the phone or tablet. Image recorders typically use a live mobile phone camera device when recording from a motorcycle, or an external camera, such as an action camera or a regular digital camera, when using a car. The GNSS board used, Beitian BN-220 DGPS, offers sub-meter level accuracy in open environments and supports GPS and GLONASS satellites, enhancing performance under urban conditions. The device is connected via Bluetooth to the mobile phone to facilitate real-time data exchange.
Implementation of acquisition data recording on several roads in Semarang City, Central Java, Indonesia. The results of image and coordinate recording are then processed through a detection algorithm using the application created in the first stage. The results of the process will be presented as an image with a bounding box that displays the classification of road damage and the corresponding position coordinates of the damage.
The OCR library used in this study is implemented in Python and serves to extract coordinate text embedded within images. OCR is a widely adopted method for recognizing and converting printed or handwritten text in images into machine-readable digital formats [31, 32]. OCR is utilized in this context because it enables coordinate extraction directly from overlaid information shown in the camera’s live feed during recording. This method simplifies the synchronization process by embedding coordinates visually within the image frame, ensuring that each detected object has an apparent spatial reference without needing to match separate GNSS logs. While direct GNSS data logging could reduce complexity, the current OCR-based approach offers flexibility in various recording setups where data overlay is embedded in real time.
One of the most commonly used OCR engines in Python is Tesseract, an open-source software developed by Google. Tesseract has been extensively validated for its high accuracy in recognizing Latin characters, making it suitable for extracting numerical and alphabetic data from various image sources [33, 34]. Its integration with Python through libraries such as Pytesseract enables seamless processing of image data, allowing for the automated reading of positional information without manual transcription. This capability plays a crucial role in synchronizing visual object detection results with precise location data, forming a complete and georeferenced dataset for road damage analysis.
YOLOv8 Model Training: The YOLOv8 object detection model was trained on a custom dataset containing 7,518 annotated images of road surface conditions. Data augmentation techniques included random flipping, rotation, brightness adjustment, and scaling to improve generalization across diverse road and lighting conditions. Training was conducted for 100 epochs using a batch size of 16 and an image input resolution of 640 × 640 pixels. The Adam optimizer was used with an initial learning rate of 0.001. The model was validated using a separate dataset (1,000 images), achieving a precision of 82.9%, a recall of 81.8%, and an F1 score of 76.4%.
Testing of the coordinates of the damage site was also carried out by measuring samples in the field. Coordinate validation measurements were carried out using GNSS/GPS Geodetic tools. Geodetic GNSS tools were chosen as the validation tool due to their meticulous and fast measurement results. The results of the model and validation are compared to determine their accuracy and precision. The accuracy assessment is carried out by calculating the Root Mean Square Error (RMSE) of the process, which is the square root of the sum of the squares of the size difference between the total square root value and the number of measurements used. RMSE, also known as standard error ($\sigma$), is calculated from the process of taking the square root of the sum of the squares of the size differences and the number of measurements used [35-37]. The mathematical definition of RMSE is similar to standard deviation, which is the square root of the average of the residual squares. The RMSE, denoted as $\sigma$, is a commonly used statistical metric to measure the magnitude of error between predicted or modeled values and actual observed values. The formula for calculating RMSE is presented in Eq. (1).
$\sigma =\sqrt{\frac{\mathop{\sum }_{i=0}^{n}{{E}_{i}}^{2}}{n}}$ (1)
where, $\sigma$ is RMSE, also called standard error, $\sum_{i=0}^n E_i{ }^2$ is the sum of the squared errors in an observation, and n is the number of measurements taken.
Additionally, positional accuracy is influenced by factors such as vehicle speed and camera angle during data acquisition. Although not analyzed quantitatively in this study, observational data indicated that higher speeds and oblique angles can degrade the clarity of coordinate overlays, potentially affecting OCR accuracy and GNSS signal stability. Future work will explore systematic analysis of these effects.
The design of the image recording device is developed by integrating several modular components that work together to enable the synchronized acquisition of image and positional data. The primary components in this system include a camera, a GNSS receiver, and a smartphone or tablet, which serves as the central processing and control unit. Each element plays a specific role in the data collection process: the camera captures real-time images or video of the road surface, the GNSS receiver provides accurate geographic coordinates, and the smartphone functions as both the controller and storage device. The connection between the camera and the smartphone is established via a USB-C interface, ensuring high-speed and stable data transfer for video streaming and control commands. Meanwhile, the GNSS receiver communicates wirelessly with the smartphone via Bluetooth, allowing for the flexible placement of the receiver module without the constraints of physical wiring. This modular and wireless design improves ease of use in field conditions, reduces clutter, and enhances mobility during data collection. The system is designed to be lightweight, portable, and adaptable, making it suitable for mobile surveying applications such as road condition monitoring, asset mapping, and geospatial data acquisition in dynamic environments.
GNSS circuit in Figure 2 is built utilizing the Beitian BN-220ZF GPS module, the ESP-32 IoT module, and the TP4056 Protect Charger. The circuit is created using a GNSS Module and an IoT-Nodemcu ESP-32 microcontroller. This Receiver GPS/GNSS device can stream NMEA positioning data wirelessly via Bluetooth. Smartphones receive a precision position streaming data acquisition application. This low-power, portable GNSS receiver design is optimized for field deployment where wired connections are impractical. By leveraging the wireless communication capabilities of the ESP-32 and the compact form factor of the BN-220ZF module, the system offers a flexible and efficient solution for integrating accurate geospatial data into mobile survey workflows. It is instrumental in road condition monitoring, asset mapping, and other field-based geoinformatics applications requiring centimeter-level positional accuracy.
Figure 2. GNSS circuit
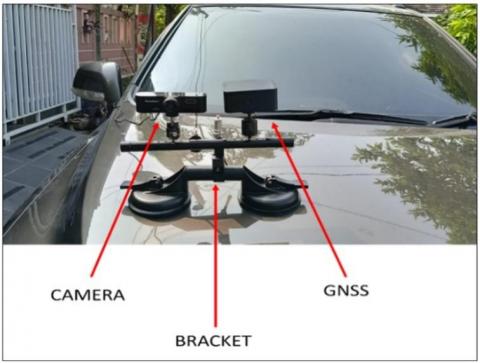
The sturdy aluminum bracket serves as the central mount for various data acquisition devices installed on the car hood. Designed to be horizontal and symmetrical, this bracket supports the primary equipment. System stability is maintained by two strong suction cups, ensuring all devices remain secure even when the vehicle is in motion. The bracket’s design enables flexible and precise installation, making it ideal for road survey applications and automated field data collection.
Figure 3. Camera and GNSS receiver configuration on a bracket for road data acquisition
Figure 3 shows a camera mounted on one side of the support bar, as indicated by the left arrow, which records the journey or visually documents road conditions during data acquisition. On the opposite side, shown by the right arrow, a GNSS receiver is installed to obtain precise positioning data. Both devices are mounted on a horizontal bracket designed to provide stability and ensure optimal performance under dynamic conditions during field surveys.
A road data acquisition system is installed on a vehicle for visual surveying and position-based mapping. The system integrates several key components, including a USB camera, a GNSS receiver, a support bracket, and a smartphone, which serves as the monitoring device. The camera and receiver are mounted on the front hood of the vehicle using a horizontal metal bracket secured with suction cups to ensure device stability during vehicle movement. Inside the car, a smartphone is mounted on the dashboard, serving as a display unit to monitor the live video feed from the external camera in real-time.
Figure 4. In-vehicle monitoring of external camera feed for road surveying
The image in Figure 4 illustrates that the external camera is connected to the smartphone via a USB interface and controlled using a dedicated application. This application displays the live video stream from the camera, complete with a simple user interface, such as a “Record” button to start or stop recording. The GNSS receiver installed on the opposite side captures precise positional coordinates, allowing each video frame to be associated with accurate location data. This integrated setup enables efficient and synchronized road surveys, providing both visual and spatial documentation that can be used for various analyses, such as detecting road damage, mapping assets, or monitoring longitudinal environmental conditions.
The survey system produces data in the form of road surface images enriched with spatial information such as geographic coordinates (latitude and longitude), altitude, speed, and timestamp. This integration of visual and spatial data enables each captured image to be precisely georeferenced, allowing users to identify not only the type and severity of road surface conditions but also the exact location of the observed damage on a map. The inclusion of timestamp data ensures temporal tracking, which is essential for monitoring degradation over time or for comparing data across different survey periods. Meanwhile, vehicle speed is a critical factor affecting the reliability of recorded coordinates, as higher speeds can increase the margin of error in location measurement due to temporal displacement and GNSS lag. Altogether, this combination of attributes allows the dataset to support comprehensive spatial analysis, infrastructure planning, and maintenance decision-making, making it highly valuable for transportation authorities, urban planners, and geospatial analysts.
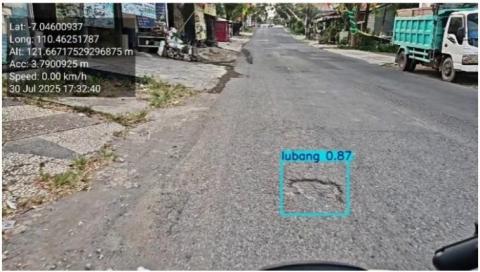
Figure 5. Detection image with additional coordinates
The image captured in Figure 5 shows the output of an automated road damage detection system that utilizes computer vision and geospatial tagging to identify and localize road surface defects. The image shows a pothole (“lubang”) detected with a confidence score of 0.87, enclosed in a bounding box and visually highlighted for straightforward interpretation. The system overlays metadata directly onto the video frame, including latitude, longitude, altitude, accuracy, and timestamp, enabling precise geolocation of the identified road damage.
Such a system combines visual analysis from a front-facing camera with GNSS data to support real-time condition monitoring of roads. The information displayed—such as coordinates and detection confidence—can be stored and later used for road maintenance planning, infrastructure audits, or integration into GIS-based asset management systems. This approach improves efficiency and consistency in road assessments, especially for large-scale urban or rural monitoring programs.
Furthermore, a position test was carried out. This test aims to obtain quantitative data regarding the position of the road damage class. Through this measurement, the information on the position or location of road damage, as shown by the model’s results in the application system, can be as precise or accurate. The use of the position or location generated by this application aims to facilitate identifying the damage site. Subsequently, it will make it easier for surveyors or those on duty to locate it again in the field.
The image shows a field verification activity conducted to directly identify road surface damage while simultaneously recording positional coordinates using a GNSS device with the NRTK (Network Real-time Kinematic) method. This method allows for centimeter-level positional accuracy, making it highly suitable for validating damage detection results from the automated system. Measurements are taken precisely at the damage point (in this case, a pothole), with the operator ensuring the device is held perpendicular to the surface and that the RTK correction signal remains stable. This process is essential to ensure the spatial reliability of the detection data. It serves as a reference for evaluating the performance of the image and AI-based mapping system used in the previous road survey.
The test compared the model-generated coordinates with the field verification results, revealing positional discrepancies between the automated detection system and the GNSS NRTK ground measurements. These differences were calculated as the deviation in latitude (ΔE) and longitude (ΔN), and the total positional error was computed in meters using the RMSE method. The resulting error values provide insight into the spatial accuracy of the automated detection system and serve as a critical reference for evaluating model performance and identifying potential improvements, whether in the detection algorithm or the integration of spatial data.
Table 1. Comparison of model and verified coordinates with positional error metrics
|
No. |
Model |
Verification |
Speed Km/h |
ΔE |
ΔN |
Error Total |
|||
|
E |
N |
E |
N |
||||||
|
1 |
438283.730 |
9221107.683 |
438284.756 |
9221109.742 |
19.760 |
-1.026 |
-2.059 |
2.300 |
|
|
2 |
438289.164 |
9221100.030 |
438290.371 |
9221103.034 |
20.230 |
-1.207 |
-3.004 |
3.238 |
|
|
3 |
438315.850 |
9221111.554 |
438318.237 |
9221114.240 |
21.740 |
-2.387 |
-2.686 |
3.594 |
|
|
4 |
438016.951 |
9221011.747 |
438020.771 |
9221015.716 |
27.860 |
-3.820 |
-3.969 |
5.509 |
|
|
5 |
438023.893 |
9221009.166 |
438027.903 |
9221013.253 |
26.420 |
-4.010 |
-4.087 |
5.725 |
|
|
6 |
437926.281 |
9221608.627 |
437919.677 |
9221603.324 |
34.130 |
6.604 |
5.303 |
8.470 |
|
|
7 |
437914.045 |
9221680.691 |
437909.621 |
9221685.548 |
32.180 |
4.424 |
-4.857 |
6.570 |
|
|
8 |
437897.541 |
9221755.230 |
437899.245 |
9221756.914 |
20.840 |
-1.704 |
-1.684 |
2.396 |
|
|
9 |
440642.436 |
9221129.655 |
440639.228 |
9221131.255 |
27.100 |
3.208 |
-1.601 |
3.585 |
|
|
10 |
440637.403 |
9221131.082 |
440640.228 |
9221133.255 |
18.540 |
-2.825 |
-2.174 |
3.565 |
|
|
11 |
440615.998 |
9221138.099 |
440613.136 |
9221139.880 |
20.700 |
2.863 |
-1.781 |
3.371 |
|
|
12 |
440592.903 |
9221146.836 |
440594.379 |
9221146.935 |
17.240 |
-1.476 |
-0.099 |
1.480 |
|
|
13 |
440575.907 |
9221152.192 |
440577.338 |
9221152.135 |
19.780 |
-1.431 |
0.057 |
1.433 |
|
|
14 |
440501.840 |
9221180.812 |
440503.082 |
9221181.186 |
24.300 |
-1.242 |
-0.374 |
1.297 |
|
|
15 |
440453.134 |
9221285.477 |
440452.452 |
9221282.406 |
25.810 |
0.681 |
3.071 |
3.145 |
|
|
16 |
440470.726 |
9221410.460 |
440465.205 |
9221406.988 |
33.730 |
5.521 |
3.472 |
6.522 |
|
|
17 |
440476.448 |
9221485.162 |
440480.899 |
9221489.231 |
33.050 |
-4.451 |
-4.068 |
6.031 |
|
|
18 |
440446.637 |
9221665.537 |
440443.411 |
9221668.971 |
31.280 |
3.226 |
-3.434 |
4.712 |
|
|
19 |
440150.786 |
9222026.462 |
440151.578 |
9222017.945 |
33.280 |
-0.792 |
8.517 |
8.554 |
|
|
20 |
440163.250 |
9222097.480 |
440166.027 |
9222102.124 |
25.960 |
-2.777 |
-4.644 |
5.411 |
|
|
21 |
440162.332 |
9222090.578 |
440165.492 |
9222094.429 |
26.100 |
-3.160 |
-3.851 |
4.981 |
|
|
22 |
440156.610 |
9222033.089 |
440157.180 |
9222034.826 |
25.700 |
-0.570 |
-1.737 |
1.829 |
|
|
23 |
440156.141 |
9222012.453 |
440155.528 |
9222012.722 |
24.910 |
0.613 |
-0.269 |
0.670 |
|
|
24 |
440191.349 |
9221961.923 |
440197.264 |
9221954.957 |
35.500 |
-5.915 |
6.966 |
9.138 |
|
|
25 |
440287.317 |
9221847.925 |
440284.727 |
9221844.968 |
30.600 |
2.590 |
2.956 |
3.931 |
|
|
26 |
440424.814 |
9221699.578 |
440421.916 |
9221707.200 |
39.700 |
2.898 |
-7.621 |
8.154 |
|
|
27 |
440400.019 |
9221738.976 |
440396.222 |
9221745.120 |
42.200 |
3.797 |
-6.144 |
7.223 |
|
|
28 |
440424.814 |
9221699.578 |
440428.390 |
9221692.310 |
39.800 |
-3.576 |
7.268 |
8.100 |
|
|
29 |
440389.213 |
9221758.927 |
440393.726 |
9221751.654 |
40.210 |
-4.513 |
7.273 |
8.559 |
|
|
30 |
440430.912 |
9221690.489 |
440426.286 |
9221695.181 |
37.690 |
4.625 |
-4.692 |
6.589 |
|
|
31 |
440382.711 |
9221765.442 |
440378.255 |
9221770.787 |
36.500 |
4.456 |
-5.345 |
6.959 |
|
|
30 |
440430.912 |
9221690.489 |
440426.286 |
9221695.181 |
37.690 |
4.625 |
-4.692 |
6.589 |
|
|
31 |
440382.711 |
9221765.442 |
440378.255 |
9221770.787 |
36.500 |
4.456 |
-5.345 |
6.959 |
|
|
|
|
|
|
|
|
|
|
Min: |
0.670 |
|
|
|
|
|
|
|
|
|
Max: |
9.138 |
|
|
|
|
|
|
|
|
|
Average: |
4.937 |
|
|
|
|
|
|
|
|
|
RMS error: |
5.523 |
Table 1 presents the comparison results between the model-generated coordinates and the verified field measurements used to evaluate the positional accuracy of road damage detection. The ΔE (Delta Easting) and ΔN (Delta Northing) values represent the differences between the model and ground-truth coordinates, which were used to compute the total positional error using Euclidean distance. Figure 6 illustrates the ground verification process conducted using a GNSS RTK receiver, where the detected road damage points were precisely measured in the field to obtain high-accuracy reference coordinates. This procedure ensured that each detected defect was spatially validated against the model-generated coordinates, thereby supporting the positional accuracy assessment presented in Table 1. Across all observations, the RMSE was calculated at 5.523 m, with error values ranging from 0.670 m to 9.138 m. These errors reflect the overall spatial deviation and are influenced by factors such as the accuracy limitations of the GNSS module used (DGPS-grade), the relative distance between the camera and damage point, and the vehicle’s speed during data acquisition.
Figure 6. Implementation of verification of damage positions in the field
Further analysis revealed that vehicle speed has a measurable impact on geolocation accuracy. As detailed in Table 1 and visualized in Figure 7, higher speeds consistently resulted in greater positional discrepancies. Regression analysis confirmed a strong linear correlation between speed and positional error (R² = 0.7168), indicating that motion dynamics during capture can significantly degrade spatial accuracy. This result suggests that operating at lower speeds (≤ 30 km/h) can improve accuracy in mobile survey settings.
Figure 7. Plot of vehicle speed vs. RMSE
While the achieved RMSE does not satisfy sub-meter georeferencing standards, it is sufficient for practical road maintenance tasks where errors within a few meters remain visually traceable. Furthermore, a comparative evaluation with similar mobile mapping systems [38, 39] indicates that the system's performance aligns with industry-accepted accuracy levels for field-level planning and damage documentation.
These results confirm that controlling vehicle speed can enhance spatial accuracy in mobile surveys, and we recommend limiting speed to below 30 km/h for improved precision. The YOLOv8 model used for damage detection achieved reliable performance with mAP@0.5 of 76.4% and mAP@0.5:0.95 of 76.4% at an IoU threshold of 0.76, ensuring the reliability of visual detection outcomes.
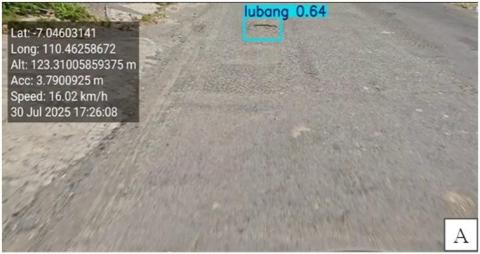
Additionally, the study initially observed that the relative position of road damage within the image frame—specifically, the proximity of the damage to the camera—may influence detection clarity and, consequently, spatial accuracy. However, due to limitations in data collection, particularly the absence of direct measurements of object distance during field surveys, this relationship could not be quantitatively assessed. As such, we treat this influence as hypothetical in the present study. Prior literature in photogrammetry and geolocation has demonstrated that increased object distance can reduce image resolution and introduce geometric distortions, which may affect both detection performance and coordinate estimation. Notably, Dai et al. [40] highlight that spatial errors in photogrammetric measurements increase proportionally with object distance relative to the camera baseline, thereby degrading geolocation accuracy. In this context, we retain the discussion to contextualize possible sources of error observed in our spatial accuracy results. Figure 8 illustrates this concept by comparing two image captures of the same road defect taken from different distances. In subgraph (A) of Figure 8, the damage is recorded from a greater distance, while in subgraph (B), it is captured more closely. Although the damage and location are constant, the difference in visual appearance across frames likely influenced detection outcomes and could contribute to coordinate deviation.
Figure 8. Differences in the distance of road damage relative to the camera: (A) damage captured from a far distance, (B) damage captured from a closer distance within the image frame
The vehicle speed and distance between the camera and the actual damage location are critical factors that can affect the positional accuracy of data acquisition. This factor helps explain the spatial deviations observed, where differences between model-generated and verified coordinates reached several meters. Therefore, the relative position of the damage within the image frame should be considered a potential source of error in image-based geospatial data acquisition systems.
The developed system integrates a GNSS receiver with a mobile device to acquire georeferenced imagery of road surface conditions. The GNSS module communicates wirelessly with the smartphone via Bluetooth, facilitating real-time positional data exchange during field surveys. Planimetric verification using field measurements demonstrated positional discrepancies, with total error values ranging from 0.670 meters to 9.138 meters. The average error was 4.937 meters, culminating in an RMSE of 5.523 meters. These deviations are influenced by several factors, including the inherent accuracy limitations of the GPS device (DGPS-grade), the movement speed of the vehicle, and the varying distance between the camera and the damaged object during capture. Despite these challenges, the error margins remain within a field-verifiable range, supporting practical road condition monitoring applications.
To enhance spatial accuracy and system robustness, especially in dynamic field environments, future improvements should consider the integration of RTK-GNSS modules (e.g., u-blox ZED-F9P), which provide centimeter-level accuracy suitable for municipal asset management tasks. Although these modules incur higher costs, they offer a favorable cost-benefit ratio for large-scale deployments where positional precision is critical. Additionally, refining camera-GNSS synchronization, optimizing image acquisition angles, and extending battery life and data storage capabilities will support system scalability for prolonged and wide-area surveys. Ultimately, the system provides a portable, low-cost, and scalable solution for road surface damage detection and geospatial documentation, with potential for further enhancements to meet the demands of smart city infrastructure monitoring.
[1] Ahmadzai, F., Rao, K.L., Ulfat, S. (2019). Assessment and modelling of urban road networks using Integrated Graph of Natural Road Network (a GIS-based approach). Journal of Urban Management, 8(1): 109-125. https://doi.org/10.1016/j.jum.2018.11.001
[2] Wegman, F. (2017). The future of road safety: A worldwide perspective. IATSS Research, 40(2): 66-71. https://doi.org/10.1016/j.iatssr.2016.05.003
[3] Kek, S.L., Lim, F.P., Yap, H.K. (2025). Prediction of road safety risks through crack detection and structural deterioration assessment. Mechatronics and Intelligent Transportation Systems, 4(4): 198-209. https://doi.org/10.56578/mits040403
[4] Shang, J., Zhang, A.A., Dong, Z.S., Zhang, H., He, A.Z. (2024). Automated pavement detection and artificial intelligence pavement image data processing technology. Automation in Construction, 168: 105797. https://doi.org/10.1016/j.autcon.2024.105797
[5] Vrtagic, S., Dordevic, M., Dogan, F., Codur, M., Hoxha, M., Softic, E. (2023). AI-enabled assessment of roadway integrity: Forecasting bitumen deformation and road stability throughout the lifecycle under traffic impact. International Journal of Transport Development and Integration, 7(4): 321-329. https://doi.org/10.18280/ijtdi.070406
[6] Pei, X., Zuo, K., Li, Y., Pang, Z. (2023). A review of the application of multi-modal deep learning in medicine: Bibliometrics and future directions. International Journal of Computational Intelligence Systems, 16(1): 44. https://doi.org/10.1007/s44196-023-00225-6
[7] Goodfellow, I., Pouget-Abadie, J., Mirza, M., Xu, B. (2020). Generative adversarial networks. Communications of the ACM, 63(11): 139-144. https://doi.org/10.1145/3422622
[8] Orgován, L., Bécsi, T., Aradi, S. (2021). Autonomous drifting using reinforcement learning. Periodica Polytechnica Transportation Engineering, 49(3): 292-300. https://doi.org/10.3311/PPtr.18581
[9] Nasution, S.M., Septiawan, R.R., Fikri, R.M., Dirgantoro, B. (2024). Traffic management enhancement: A competitive machine learning system for traffic condition classification. International Journal of Transport Development and Integration, 8(4): 553-567. https://doi.org/10.18280/ijtdi.080407
[10] Cao, Z., Hidalgo, G., Simon, T., Wei, S.E., Sheikh, Y. (2019). OpenPose: Realtime multi-person 2D pose estimation using part affinity fields. IEEE Transactions on Pattern Analysis and Machine Intelligence, 43(1): 172-186. https://doi.org/10.1109/TPAMI.2019.2929257
[11] Alsuwaylimi, A.A., Alanazi, R., Alanazi, S.M., Alenezi, S.M., Saidani, T., Ghodhbani, R. (2024). Improved and efficient object detection algorithm based on YOLOv5. Engineering, Technology & Applied Science Research, 14(3): 14380-14386. https://doi.org/10.48084/etasr.7386
[12] Liu, Z., Zhang, E., Ding, Q., Liao, W., Wu, Z. (2024). An improved method for enhancing the accuracy and speed of dynamic object detection based on YOLOv8s. Sensors, 25(1): 85. https://doi.org/10.3390/s25010085
[13] Li, S., Gu, X., Xu, X., Xu, D., Zhang, T., Liu, Z., Dong, Q. (2021). Detection of concealed cracks from ground penetrating radar images based on deep learning algorithm. Construction and Building Materials, 273: 121949. https://doi.org/10.1016/j.conbuildmat.2020.121949
[14] Megaarta, M.A. (2025). Comparative evaluation of YOLOv5 and YOLOv8 Models in detecting smoking behavior. Journal of Artificial Intelligence and Engineering Applications (JAIEA), 4(3): 2048-2056. https://doi.org/10.59934/jaiea.v4i3.1089
[15] Cheng, G., Chao, P.Z., Yang, J., Ding, H. (2024). SGST-YOLOv8: An improved lightweight YOLOv8 for real-time target detection for campus surveillance. Applied Sciences, 14(12): 5341. https://doi.org/10.3390/app14125341
[16] Yilmaz, B., Kutbay, U. (2024). YOLOv8-based drone detection: Performance analysis and optimization. Computers, 13(9): 234. https://doi.org/10.3390/computers13090234
[17] Wang, G., Chen, Y.F., An, P., Hong, H.Y., Hu, J.H., Huang, T.G. (2023). UAV-YOLOv8: A small-object-detection model based on improved YOLOv8 for UAV aerial photography scenarios. Sensors, 23(16): 7190. https://doi.org/10.3390/s23167190
[18] Xiao, B.J.., Nguyen, M., Yan, W.Q. (2024). Fruit ripeness identification using YOLOv8 model. Multimedia Tools and Applications, 83(9): 28039-28056. https://doi.org/10.1007/s11042-023-16570-9
[19] Yang, W.J., Wu, J.C., Zhang, J.L., Gao, K., Du, R.H., Wu, Z., Firkat, E., Li, D.W. (2023). Deformable convolution and coordinate attention for fast cattle detection. Computers and Electronics in Agriculture, 211: 108006. https://doi.org/10.1016/j.compag.2023.108006
[20] Talaat, F.M., ZainEldin, H. (2023). An improved fire detection approach based on YOLO-v8 for smart cities. Neural Computing and Applications, 35(28): 20939-20954. https://doi.org/10.1007/s00521-023-08809-1
[21] Wu, T.Y., Dong, Y.K. (2023). YOLO-SE: Improved YOLOv8 for remote sensing object detection and recognition. Applied Sciences, 13(24): 12977. https://doi.org/10.3390/app132412977
[22] Jin, S.G., Meng, X.Y., Dardanelli, G., Zhu, Y.L. (2024). Multi-global navigation satellite system for earth observation: Recent developments and new progress. Remote Sensing, 16(24): 4800. https://doi.org/10.3390/rs16244800
[23] Hernández Olcina, J., Anquela Julián, A.B., Martín Furones, Á.E. (2024). Real-time cloud computing of GNSS measurements from smartphones and mobile devices for enhanced positioning and navigation. GPS Solutions, 28(4): 167. https://doi.org/10.1007/s10291-024-01705-8
[24] Najafabadi, M.D., Shojaei, K. (2024). Robo-platform: A robotic system for recording sensors and controlling robots. arXiv preprint arXiv:2409.16595. https://doi.org/10.48550/arXiv.2409.16595
[25] Osborne, A., Mossman, H., Caporn, S., Coulthard, E. (2025). Comparing the accuracy and precision of smartphone and specialist handheld GNSS receivers for use in ecological fieldwork. Ecological Solutions and Evidence, 6(1): e70015. https://doi.org/10.1002/2688-8319.70015
[26] Wick, C., Reul, C., Puppe, F. (2018). Calamari−A high-performance tensorflow-based deep learning package for optical character recognition. arXiv preprint arXiv:1807.02004. https://doi.org/10.48550/arXiv.1807.02004
[27] Anand, R., Shanthi, T., Sabeenian, R.S., Veni, S. (2020). Real time noisy dataset implementation of optical character identification using CNN. International Journal of Intelligent Enterprise, 7(1-3): 67-80. https://doi.org/10.1504/IJIE.2020.104646
[28] Groves, P.D. (2011). Shadow matching: A new GNSS positioning technique for urban canyons. The Journal of Navigation, 64(3): 417-430. https://doi.org/10.1017/S0373463311000087
[29] Wang, L., Li, Z.S., Wang, N.B., Wang, Z.Y. (2021). Real-time GNSS precise point positioning for low-cost smart devices. GPS Solutions, 25(2): 69. https://doi.org/10.1007/s10291-021-01106-1
[30] Li, Z., Tao, J., Lei, Z., Guo, J., Zhao, Q.L., Guo, X.X. (2025). Factor graph optimization-based RTK/INS integration with raw observations for robust positioning in urban canyons. IEEE Transactions on Instrumentation and Measurement, 74: 1-11. https://doi.org/10.1109/TIM.2025.3577823
[31] Drobac, S., Lindén, K. (2020). Optical character recognition with neural networks and post-correction with finite state methods. International Journal on Document Analysis and Recognition (IJDAR), 23(4): 279-295. https://doi.org/10.1007/s10032-020-00359-9
[32] Salma, Saeed, M., ur Rahim, R., Gufran Khan, M., Zulfiqar, A., Bhatti, M.T. (2021). Development of ANPR framework for Pakistani vehicle number plates using object detection and OCR. Complexity, 2021(1): 5597337. https://doi.org/10.1155/2021/5597337
[33] Hegghammer, T. (2022). OCR with Tesseract, Amazon Textract, and Google Document AI: A benchmarking experiment. Journal of Computational Social Science, 5(1): 861-882. https://doi.org/10.1007/s42001-021-00149-1
[34] Park, J., Lee, E., Kim, Y., Kang, I., Koo, H.I., Cho, N.I. (2020). Multi-lingual optical character recognition system using the reinforcement learning of character segmenter. IEEE Access, 8: 174437-174448. https://doi.org/10.1109/ACCESS.2020.3025769
[35] Chai, T., Draxler, R.R. (2014). Root mean square error (RMSE) or mean absolute error (MAE)? - Arguments against avoiding RMSE in the literature. Geoscientific Model Development, 7(3): 1247-1250. https://doi.org/10.5194/gmd-7-1247-2014
[36] Ghilani, C.D. (2018). Adjustment Computations: Spatial Data Analysis (Sixth Edition). John Wiley & Sons, Inc., Hoboken, New Jersey.
[37] Ghilani, C.D., Wolf, P.R. (2015). Elementary Surveying: An Introduction to Geomatics (14th Edition). Boston: Pearson-Prentice Hall.
[38] Specht, M., Specht, C., Dąbrowski, P., Czaplewski, K., Smolarek, L., Lewicka, O. (2020). Road tests of the positioning accuracy of INS/GNSS systems based on MEMS technology for navigating railway vehicles. Energies, 13(17): 4463. https://doi.org/10.3390/en13174463
[39] Specht, C., Pawelski, J., Smolarek, L., Specht, M., Dabrowski, P. (2019). Assessment of the positioning accuracy of DGPS and EGNOS systems in the Bay of Gdansk using maritime dynamic measurements. The Journal of Navigation, 72(3): 575-587. https://doi.org/10.1017/S0373463318000838
[40] Dai, F., Feng, Y., Hough, R. (2014). Photogrammetric error sources and impacts on modeling and surveying in construction engineering applications. Visualization in Engineering, 2(1): 2. https://doi.org/10.1186/2213-7459-2-2