Oscar Mauricio Matute-Rodríguez![]() | Juan Carlos Muyulema-Allaica*
| Juan Carlos Muyulema-Allaica*![]() | Yanelis Ramos-Alfonso
| Yanelis Ramos-Alfonso![]()
© 2025 The authors. This article is published by IIETA and is licensed under the CC BY 4.0 license (http://creativecommons.org/licenses/by/4.0/).
OPEN ACCESS
The study adopted a Design Science Research (DSR) approach to develop and validate the Circular Systems Sandbox (CSS), designed to facilitate the design of Lean circular systems in the coffee industry. Products, services, business models, and collaborative strategies were integrated to mitigate rebound effects in circular economy initiatives. Data were collected through 29 semi-structured interviews with experts from strategic sectors (agroindustry, manufacturing, services, commerce, and technology) and analyzed using axial coding, resulting in 21 analytical patterns grouped into five dimensions of Circular Systems Design: system research and mapping, life cycle thinking, system creation, calibration, and digitalized evaluation. The artifact was validated through nine collaborative workshops with experts, employing digital platforms (Miro and Zoom) and applied coffee-sector cases. Subsequently, a randomized controlled trial with 76 participants (treatment group: CSS, n = 38; control group: alternative tools, n = 38) evaluated design integrity, innovation, resource efficiency, scalability, feasibility, and rebound effect, defined as the tendency of circular interventions to generate unintended indirect impacts, such as increased energy or material consumption. Results showed significant improvements in design integrity (U = 5; p = 0.043), innovation feasibility (U = 3; p = 0.027), and reduction of quality rebound (U = 2; p = 0.018), demonstrating that the CSS supports a strategic and systemic approach to conceptualizing circular solutions. Although participants in the control group noted greater ease of use, the CSS demonstrated superior effectiveness in integrating sustainability principles, optimizing materials, and supporting sustainable business models, highlighting its role as a structured framework for advancing the circular economy in complex industrial contexts; however, the completion of only nine projects limits the generalizability of the results.
circular economy, systems design, Circular Systems Sandbox, sustainable innovation, rebound effect, DSR methodology, coffee sector
Circular economy (CE) has emerged as an alternative paradigm to the traditional linear model of extraction, production, and disposal, promoting a regenerative system that preserves resource value through integrated strategies of reduction, reuse, recycling, and recovery across the entire supply chain [1-3]. Beyond being a waste management strategy, CE entails a systemic transformation of production and consumption patterns, supported by technological innovations, sustainable business models, and new forms of collaboration among stakeholders [4, 5]. However, its progress remains limited: the Circularity Gap Report (2024) estimates that only 7.2% of the global economy is circular, highlighting both a significant potential for improvement and structural barriers to its consolidation. Among the most critical challenges are the limited integration of product, process, and business model design, as well as the persistence of rebound effects that can negate or even reverse anticipated environmental benefits an issue that calls for systemic approaches capable of anticipating externalities and ensuring long-term sustainability [6, 7].
The agri-food sector, particularly the coffee industry, vividly illustrates this challenge [8]. Globally, coffee production generates approximately 23 million tons of organic waste annually, including pulp, mucilage, and husks, over 90% of which is not valorized. Most of this waste is discharged into rivers, soils, or landfills, leading to significant environmental impacts, including water pollution, soil degradation, and greenhouse gas emissions. As one of the most widely consumed beverages in the world, coffee supports a multi-billion-dollar industry encompassing cultivation, processing, distribution, and retail. By 2024, global coffee production is expected to exceed 10 million tons per year, led by countries such as Brazil, Vietnam, Colombia, and Ethiopia [9, 10]. The coffee value chain sustains the livelihoods of over 25 million smallholder farmers and contributes significantly to the Gross Domestic Product (GDP) of many developing nations [9]. Wet processing requires between 130 and 150 liters of water per kilogram of parchment coffee, placing pressure on water resources in regions with limited access, while approximately 80% of small coffee farmers in Latin America operate with low technological efficiency and insufficient infrastructure for proper by-product management [11, 12]. For every kilogram of processed coffee, nearly two kilograms of waste are generated including pulp, husks, silver skin, and spent grounds most of which are discarded untreated, releasing greenhouse gases, contaminating water and soil, and negatively affecting local ecosystems [13].
In the face of the challenges associated with the transition to a circular economy, recent literature highlights the importance of Circular Systems Design (CSD) as an integrative approach that simultaneously aligns product design, product-service systems (PSS), circular business models (CBM), and collaborative ecosystems to generate circular value in a systemic and sustainable manner [14, 15]. This framework not only enhances the practical implementation of the circular economy but also offers a way to anticipate and address rebound effects, defined as unintended increases in consumption or negative externalities arising from circular solutions that inadequately replace linear practices [16, 17]. In the coffee industry, rebound effects may arise when by-products such as pulp, husks, or wastewater are valorized without sufficient attention to logistical and energy efficiency, leading to emissions or environmental impacts that diminish the anticipated benefits [7, 17]. For instance, while composting coffee pulp can reduce reliance on chemical fertilizers by up to 35%, inefficiencies in transportation and processing may offset much of its environmental benefits, underscoring the importance of applying CSD to ensure effective and sustainable circularity.
The integration of Lean Manufacturing and circular economy principles has led to the Lean Circular approach, a model that merges process optimization with regenerative efficiency [18, 19]. Empirical evidence shows that Lean practices can reduce operational costs by 25-30% and increase productivity by up to 40% in traditional manufacturing contexts [20]. When combined with circular strategies, this approach enables the valorization of by-products and the closure of material, water, and energy cycles, fostering more resilient and low-impact production systems. In the coffee industry, Lean Circular practices have the potential to reduce water use by 50%, substitute up to 20% of firewood in drying processes through bioenergy from husks, increase producers’ income by 15-20% through improved digital traceability, and cut the carbon footprint by approximately 30% along the supply chain.
Despite these promising results, the application of Lean Circular principles in the coffee sector remains underexplored, with most research focusing on isolated eco-efficiency initiatives rather than integrated frameworks. To fill this gap, the present study introduces the Circular Systems Sandbox (CSS), a methodological framework developed under Design Science Research (DSR) principles, aimed at designing and validating practical tools to implement Lean Circular systems adapted to the coffee industry’s specific conditions.
Our central research question is: How can the integration of Lean Manufacturing and circular economy contribute to the design of sustainable systems that reduce waste, mitigate rebound effects, and enhance the resilience of the coffee industry?
This study contributes to both theory and practice across three dimensions. First, it advances the theoretical integration of Lean and CE by introducing the operational concept of Lean Circular as a strategic framework for agro-industries. Second, it tackles the challenge of rebound effects by embedding systemic design principles that anticipate potential negative externalities. Finally, it delivers an applied and validated model within the coffee sector, offering potential for adaptation and scalability across other agri-food value chains.
Within the DSR framework, an artifact is defined as the solution constructed by the researcher to address a specific practical problem. In this study, a DSR approach was adopted to develop and evaluate an artifact designed to facilitate the transition toward circular systems in the industry, integrating products, services, business models, and collaborations to reduce rebound effects in the circular economy [20-22]. Following the cycle proposed by Dimov et al. [23], the practical problem was defined as the limited understanding of CSD and the lack of holistic guidance for practitioners. Based on this, an iterative artifact, the CSS, was designed to organize CSD phases and critical dependencies to optimize environmental and social impacts.
2.1 Artifact development
The development of the methodological artifact was based on the integration of best practices from existing management and design tools, complemented by empirical knowledge provided by experts in circular economy, Lean Manufacturing, and industry practitioners [24, 25]. Data collection included 29 semi-structured interviews with experts in circular design, sustainability, and product or service development within strategic sectors such as Agroindustry/Coffee, Manufacturing, Services, Commerce, and Technology (Table 1). Each 60-minute interview aimed to holistically understand the CSD process, identifying challenges, inherent trade-offs, and interdependencies across design levels. Subsequently, the interviews were transcribed and analyzed using axial coding [26, 27], generating in vivo codes that captured granular insights on policies, production processes, circularity strategies, and consumer behavior.
Table 1. Interview participants by sector and expertise
|
# |
Industrial Sector |
Role / Position |
Company Size |
Design Experience |
Country |
|
1 |
Services |
product designer - sustainable strategy |
microenterprise |
5 years |
Spain |
|
2 |
Agroindustry / Coffee |
founder & product director |
SME |
10 years |
Ecuador |
|
3 |
Manufacturing |
PhD researcher in industrial design engineering |
large company |
12 years |
Mexico |
|
4 |
Food |
co-director of circular transitions |
SME |
8 years |
Venezuela |
|
5 |
Commerce |
Sustainable materials development manager |
small company |
6 years |
Peru |
|
6 |
Services |
circular materials researcher |
microenterprise |
4 years |
Costa Rica |
|
7 |
Logistics / Coffee |
IoT requirements engineer |
large company |
14 years |
Panama |
|
8 |
University |
PhD researcher in industrial engineering |
SME |
11 years |
Spain |
|
9 |
Automotive |
circular and sustainable materials expert |
large company |
25 years |
Mexico |
|
10 |
Energy |
director of circular materials & products |
large company |
20 years |
Venezuela |
|
11 |
Agroindustry/Coffee |
strategic & sustainable designer |
microenterprise |
7 years |
Colombia |
|
12 |
Services |
eco-design consultant |
small company |
5 years |
Peru |
|
13 |
Technology |
director of innovation & circular projects |
large company |
18 years |
Mexico |
|
14 |
Agroindustry/Coffee |
circular economy project manager |
SME |
9 years |
Ecuador |
|
15 |
Agriculture |
sustainability & resource optimization specialist |
microenterprise |
6 years |
Costa Rica |
|
16 |
Services |
co-founder & director of circular startup |
SME |
12 years |
Spain |
|
17 |
Commerce |
product manager |
large company |
15 years |
Panama |
|
18 |
Logistics/Coffee |
materials director |
large company |
20 years |
Colombia |
|
19 |
Manufacturing |
production manager |
SME |
10 years |
Venezuela |
|
20 |
Services |
circular design researcher |
small company |
8 years |
Peru |
|
21 |
Textile |
sustainable materials specialist |
microenterprise |
6 years |
Ecuador |
|
22 |
Commerce/Coffee |
strategy consultant |
SME |
7 years |
Costa Rica |
|
23 |
Services |
innovation researcher |
large company |
22 years |
Mexico |
|
24 |
Services |
product designer |
microenterprise |
5 years |
Colombia |
|
25 |
Technology |
head of product development |
large company |
17 years |
Spain |
|
26 |
University |
academic & industrial eco-innovation consultant |
SME |
9 years |
Ecuador |
|
27 |
Environmental Services |
founder & ceo |
microenterprise |
12 years |
Ecuador |
|
28 |
Commerce |
innovation & sustainability manager |
SME |
11 years |
Colombia |
|
29 |
Textile |
director of sustainable product development |
small company |
10 years |
Peru |
Table 2 presents the relationship between the qualitative results obtained through axial coding and the quantitative indicators used to assess each strategic dimension of the CSS Framework. This integration allowed the qualitative patterns identified during the collaborative workshops to be translated into measurable indicators that reflect participants’ levels of progress and engagement.
Table 2. Integration of qualitative and quantitative results in the validation process of the CSS framework
|
CSS Strategic Dimension |
Qualitative Analytical Patterns (Axial Coding) |
Associated Quantitative Indicators |
Rating Scale (1-5) |
Average Score (n = 9) |
|
System research and mapping |
comprehensive understanding of the product life cycle; identification of critical points and dependencies; mapping of stakeholders and value flows. |
completeness level of system mapping; degree of cross-sector participation. |
1: limited mapping and low participation; 2: partial identification of stakeholders; 3: moderate process representation; 4: comprehensive mapping with strong articulation; 5: fully characterized and interconnected system. |
4.3 |
|
Lifecycle thinking |
integration of environmental and social criteria in design phases; prioritization of circularity; minimization of negative impacts. |
percentage of processes redesigned with a circular approach; number of eco-efficient practices adopted. |
1: no lifecycle integration; 2: limited environmental consideration; 3: partial application; 4: strong incorporation of circularity principles; 5: lifecycle fully integrated across all system stages. |
4.1 |
|
System creation |
intersectoral collaboration; formulation of circular business models; identification of industrial and social synergies. |
number of established collaborations; diversification of sustainable business models. |
1: minimal collaboration; 2: limited cooperation among actors; 3: moderate articulation; 4: active generation of synergies; 5: consolidated collaborative ecosystem with continuous feedback. |
4.4 |
|
System calibration, verification, and adjustment |
ability to adjust processes; iterative validation of results; reduction and monitoring of rebound effects. |
continuous improvement rate; reduction of rebound effects (%). |
1: no validation mechanisms; 2: sporadic calibration; 3: moderate systematic adjustment; 4: documented continuous improvement; 5: robust validation with significant reduction of rebound effects and enhanced system efficiency. |
3.9 |
|
System evaluation, digitalization, and resilience |
use of digital tools; traceability of flows; technology adoption; assessment of sustainable performance and organizational resilience. |
level of digitalization; improvement in traceability (%); perceived organizational resilience. |
1: very limited use of technology; 2: initial digital implementation; 3: moderate traceability; 4: high technology adoption and performance monitoring; 5: fully digitalized, traceable, and resilient system. |
4.2 |
The evaluation of the CSS Framework within industrial coffee contexts revealed strong performance across its strategic dimensions. The System Research and Mapping (4.3) and System Creation (4.4) dimensions highlighted participants’ capacity to develop a comprehensive understanding of the product life cycle, identify critical stakeholders, foster cross-sector collaboration, and design circular business models specifically tailored to the coffee sector. The Lifecycle Thinking (4.1) and System Evaluation, Digitalization, and Resilience (4.2) dimensions demonstrated substantial integration of environmental and social criteria, adoption of eco-efficient practices, and measurable improvements in traceability and organizational resilience, confirming the framework’s ability to operationalize circularity principles within coffee supply chains.
The System Calibration, Verification, and Adjustment dimension (3.9) showed slightly lower performance, indicating that, while iterative adjustments were implemented and rebound effects monitored, further reinforcement of validation mechanisms could enhance overall system efficiency. To operationalize rebound effects, concrete quantitative indicators were applied: quality rebound was assessed through defect rates and product reprocessing requirements; price rebound was measured by changes in production costs and variations in market pricing; and consumption rebound was evaluated using energy and water usage metrics relative to production output. Each of these indicators was explicitly linked to qualitative patterns identified via axial coding, including stakeholder perceptions of process efficiency, adoption of circular practices, and responsiveness to iterative adjustments.
Overall, these findings demonstrate that qualitative insights derived from the workshops were successfully translated into quantitative, measurable indicators, providing a robust, evidence-based evaluation of the CSS Framework. This integration not only confirms the framework’s applicability for guiding the implementation of Lean Circular systems in industrial coffee settings but also establishes its capability to systematically monitor and mitigate rebound effects throughout the coffee value chain.
First-order codes were consolidated into second-order themes, allowing the construction of 21 analytical convergence patterns. These themes were organized into five strategic dimensions reflecting the critical phases of Lean-Circular Systems Design: (1) system research and mapping, (2) lifecycle thinking, (3) system creation, (4) system calibration, verification, and adjustment, and (5) evaluation, digitalization, and resilience (Figure 1).
Figure 1. Analytical convergence patterns
2.2 Artifact evaluation
The validation of the artifact was conducted through a series of structured workshops aimed at co-creation and iterative feedback. A total of nine workshops were held between June 2024 and April 2025, each lasting approximately 50 minutes (Table 3). Participant selection combined two profiles: previously interviewed experts, who provided continuity and verification of the representation of their knowledge, and new experts, who contributed impartial interpretations and additional perspectives.
Table 3. Participants in artifact demonstration and evaluation workshops
|
Interviewee |
Participation |
Industry Sector |
Main Role |
Company Size |
Design Experience |
Origin |
|
1 |
2nd time |
agribusiness / coffee |
founder and product director |
SME |
10 years |
Ecuador |
|
2 |
2nd time |
food |
co-director of circular transitions |
SME |
8 years |
Venezuela |
|
3 |
1st time |
manufacturing |
PhD researcher in logistics and supply chain management |
small company |
10 years |
Mexico |
|
4 |
2nd time |
services |
researcher in circular materials |
microenterprise |
4 years |
Costa Rica |
|
5 |
2nd time |
logistics / coffee |
IoT requirements engineer |
large company |
14 years |
Panama |
|
6 |
2nd time |
university |
PhD researcher in industrial engineering |
SME |
11 years |
Spain |
|
7 |
1st time |
services |
PhD researcher in logistics and supply chain management |
large company |
25 years |
Mexico |
|
8 |
1st time |
services |
eco-design consultant |
small company |
5 years |
Colombia |
|
9 |
1st time |
agribusiness / coffee |
circular economy project manager |
SME |
10 years |
Ecuador |
To facilitate the artifact validation process, collaborative workshops were conducted using the digital platform Miro, with sessions recorded via Zoom for subsequent analysis. During these sessions, participants were walked through the process plan, key interactions were clarified, and questions were answered in real time. While the initial phase used an illustrative e-scooter case, subsequent sessions incorporated examples specifically drawn from the coffee industry.
The refinement of the artifact was facilitated through direct engagement with participants, who provided suggestions via digital post-its, promoting an iterative co-creation process. The evaluation yielded predominantly positive feedback, supported by transcript excerpts that informed subsequent adjustments. Design maturity was reached when participant input was largely limited to clarification questions, indicating a more robust and consolidated state of the artifact.
The workshops engaged key stakeholders across the coffee value chain, including founders, product directors, circular economy project managers, and requirements engineers specializing in coffee logistics. Notably, representatives from the coffee sectors in Ecuador and Panama (interviewees 1, 5, and 9 in Table 2) contributed their expertise in product design, circularity management, and the implementation of digital technologies, thereby enhancing the practical relevance of the framework within this agro-industrial context.
The outcome of this process was the CSS, an interactive tool that supports companies and entrepreneurs in designing, testing, and adapting Lean Circular systems within a flexible digital environment. Among the main improvements derived from the workshops are: (i) detailed methodological descriptions that guide each stage of the process, (ii) ideation and collaboration spaces that foster the exploration of alternatives, and (iii) a knowledge repository with first-level codes and empirical examples that provide contextual references. This refined architecture supports the systematic experimentation with circular system configurations in the coffee industry, offering entrepreneurs tools to design business models that are economically viable, socially responsible, and environmentally sustainable.
2.3 Controlled experiment
Following the artifact refinement phase, its effectiveness was evaluated through a randomized controlled trial [28, 29], aimed at determining whether the CSS facilitates more efficient and sustainable circular system design compared to conventional tools. To this end, a seven-week design challenge was organized at no cost to participants, in collaboration with four national universities in Ecuador and two international universities. The study involved graduate students in Industrial Engineering, Industrial Design, and Sustainable Development, all of whom had prior training in circular economy, eco-design, and cleaner production. Recruitment was carried out through LinkedIn and Instagram announcements, with participants drawn from various national and international universities. Selection was randomized and complemented with prior contacts who had experience in sustainability projects. This setup enabled the evaluation of the CSS in real circular design contexts, fostering waste reduction, mitigating rebound effects, integrating eco-design and cleaner production, and strengthening organizational resilience.
The primary task involved designing a circular system to replace an unsustainable linear solution. Participants worked within a structured e-learning environment, supported by resources such as videos, articles, and case studies. The treatment group had exclusive access to the CSS Framework along with five instructional videos totaling 60 minutes. The control group, by contrast, used a clearly defined set of alternative reference tools aligned with the CSD phases, including: (1) Circular Design Guides, providing step-by-step methodologies for implementing circularity; (2) Material Libraries, offering comprehensive information on sustainable and recyclable materials; and (3) Circularity Assessment Tools, enabling evaluation of environmental, social, and economic impacts of design decisions (Table 4). Communication with participants was managed via email and separate Discord servers to prevent cross-group contamination. Both groups received equivalent logistical support and lecture sessions delivered by circular economy practitioners, ensuring fairness and comparability in the experimental conditions.
Table 4. Matrix training program for the treatment group based on circular design phases
|
Week |
Main Phase |
Topics and Content |
Resources and Activities |
|
1 |
System research and mapping |
introduction to circular design; diagnosis and current state of circularity; mapping of actors and flows |
introductory readings; guided discussion |
|
2 |
Life cycle thinking |
life cycle analysis; identification of critical points; strategies to reduce waste |
phase II Video: life cycle thinking; live sessions with circular economy entrepreneurs |
|
3 |
System creation |
Service design; innovation in circular business models; economic feasibility |
phase III video: system creation; ideation workshop |
|
4 |
System creation |
development of circular products and services; integration of eco-design and cleaner production strategies |
case studies; collaborative practical activities |
|
5 |
System calibration, Verification, and adjustment |
technical and economic adjustments; proposal validation; midpoint feedback |
phase IV video: system adjustment; live partial evaluation session |
|
6 |
System evaluation, digitalization, and resilience |
digital simulation tools; assessment of environmental and social impacts; organizational resilience strategies |
phase V video: evaluation and digitalization; scenario analysis workshop |
|
7 |
Synthesis and refinement |
integration of learning; proposal refinement; preparation of final deliverables |
closing workshop; project presentations |
The proposals were evaluated using comprehensive rubrics that included eight equally weighted categories (design, innovation, methodology, impact, resource efficiency, scalability, feasibility, and rebound effect) on a 10-point scale. To ensure the rigor and objectivity of the evaluation, four independent evaluators comprising two designers and two researchers conducted a blind assessment of the projects to minimize potential bias. Inter-rater reliability was quantified using Kendall’s coefficient of concordance, yielding a substantial agreement (W = 0.779; p < 0.001), which confirms the consistency, reliability, and robustness of the evaluation process.
2.4 Sample and randomization
Prior to the intervention, the 76 participants completed a characterization survey and were randomly assigned to two groups: treatment (n = 38) and control (n = 38). To ensure the validity of the experimental design, balance tests were conducted between the two groups considering sociodemographic, educational, and prior experience variables related to the coffee sector. The results indicated no statistically significant differences in any of the variables analyzed (p > 0.05), ensuring equivalent baseline conditions (Table 5).
Table 5. Participants and randomization in the treatment and control groups
|
Variable |
Treatment (n = 38) |
Control (n = 38) |
Difference |
t |
p |
|
Age (mean) |
30.9 |
29.6 |
1.3 |
1.05 |
0.299 |
|
Gender (proportion male) |
0.74 |
0.68 |
0.06 |
0.82 |
0.416 |
|
Employment status (mean) |
2.68 |
2.71 |
-0.03 |
-0.09 |
0.927 |
|
Background: Business (cafés, export) |
0.42 |
0.45 |
-0.03 |
-0.34 |
0.734 |
|
Background: Design (products, packaging) |
0.39 |
0.41 |
-0.02 |
-0.22 |
0.822 |
|
Background: Engineering (agricultural/industrial) |
0.18 |
0.21 |
-0.03 |
-0.27 |
0.789 |
|
Background: Sustainability (sustainable coffee) |
0.50 |
0.47 |
0.03 |
0.24 |
0.813 |
|
Background: Other |
0.24 |
0.26 |
-0.02 |
-0.20 |
0.847 |
|
Educational level |
2.44 |
2.56 |
-0.12 |
-0.89 |
0.278 |
|
Work experience |
2.55 |
2.32 |
0.23 |
1.21 |
0.229 |
|
Entrepreneurial experience (coffee, logistics) |
0.47 |
0.39 |
0.08 |
1.09 |
0.304 |
|
Experience in the coffee value chain |
0.52 |
0.49 |
0.03 |
0.27 |
0.785 |
|
Experience in circular design |
0.29 |
0.26 |
0.03 |
0.41 |
0.681 |
|
Expected commitment |
0.82 |
0.78 |
0.04 |
0.61 |
0.544 |
In demographic terms, the average age was 30.9 years in the treatment group and 29.6 years in the control group, while the proportion of males was similar (74% and 68%, respectively). Employment status and educational attainment were similar across both groups, with the majority of participants holding a university degree and possessing between three and five years of professional experience. The sample also displayed diverse educational backgrounds: in business, 42% of the treatment group and 45% of the control group had expertise, particularly in coffee-related management and export; in design, 39% versus 41% focused on product and packaging development; in engineering, 18% versus 21% specialized in agricultural and industrial fields; and in sustainability, 50% versus 47% had experience, particularly in sustainable coffee practices.
Regarding experience, approximately 47% of the treatment group and 39% of the control group reported entrepreneurial backgrounds related to coffee or logistics activities. Additionally, 52% and 49% of participants, respectively, indicated experience in the coffee value chain, providing a key input for the study’s practical focus. Finally, expected commitment to the program was high and comparable across both groups (0.82 vs. 0.78). Taken together, these results confirm the initial comparability of the cohorts and provide support for the causal analysis of the circular design program’s impact in the coffee sector.
As is often observed in free online training programs, participation gradually declined over the seven-week challenge, as tracked through attendance in synchronous Zoom sessions. While this measure does not capture the total number of active participants precisely, it provides a reliable indicator of retention. Of the 76 individuals initially enrolled, only nine projects were completed, yielding a completion rate of 12% (Figure 2). Despite the reduced number of participants, this smaller cohort enabled a more focused learning experience and ensured the effective application of circular design methodologies, resulting in concrete, context-specific proposals within the coffee value chain.
Figure 2. Funnel of registration, selection, and retention of participants in the design challenge
2.5 Data analysis
The final projects (n = 9) were independently evaluated by four expert judges using standardized rubrics encompassing eight dimensions: design completeness, innovation, approach/methodology, environmental impact, resource efficiency, scalability, feasibility, and rebound effect mitigation. Inter-rater agreement was high (Kendall’s W = 0.779, p < 0.001). Mann-Whitney U tests were applied to compare performance between groups, alongside analyses of participant retention.
The iterative DSR cycle generated multiple findings, which were progressively integrated into the final artifact design, resulting in a robust and validated CSS model. The results are presented chronologically according to the rounds of development, demonstration, and evaluation.
3.1 First round of creation and development
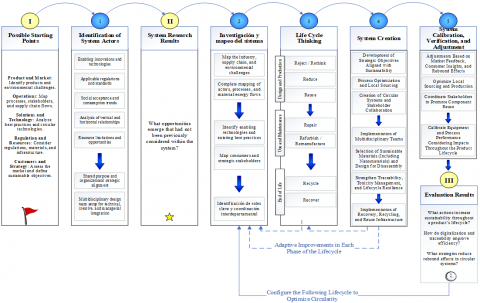
The initial phase combined empirical data from expert interviews with theoretical frameworks on circular product design [30, 31] and business models [22, 32]. A comprehensive CSD process was developed, linking systems research, life cycle thinking, system creation, product adjustment, and system evaluation (Figures 3 and 4). This framework enabled the identification of products and environmental challenges, the mapping of industries, supply chains, processes, and material/energy flows, as well as the recognition of technological innovations, applicable regulations, and relationships among value chain actors.
Figure 3. Lean Circular Systems Design challenge framework
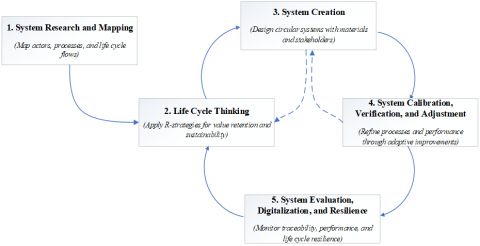
Figure 4. Simplified representation of the CSD process
The life cycle thinking phase applied the R strategies (Refuse, Reduce, Reuse, Repair, Refurbish/Remanufacture, Recycle, and Recover), enabling the anticipation of end-of-life scenarios and transitions across different value archetypes. In the system creation phase, sustainable materials were carefully selected, including nanomaterials, alongside design strategies such as disassembly, modularity, and local sourcing. Collaboration with clients and stakeholders was integrated to define strategic objectives that align with sustainability goals.
The calibration and adjustment phase improved performance, quality, and recyclability through market feedback and rebound effect analysis, while simultaneously strengthening traceability and resilience across the product life cycle. Finally, system evaluation relied on life cycle assessment (LCA) metrics, circularity, and durability measures, together with digitalization tools, to optimize recovery and recycling infrastructure, coordinate strategic actors, and ensure adaptive improvements at each stage of the life cycle, thus consolidating a dynamic and resilient framework for circular design.
The development of the CSD process was structured around an iterative, evidence-based approach, integrating second-order themes and aggregated third-order dimensions representing the critical phases of the process (Figure 4). The findings reveal how entrepreneurs and designers build, calibrate, and evaluate circular systems through a continuous cycle of feedback and improvement.
The initial phase focused on system research and mapping based on a comprehensive analysis of the system context, combining stakeholder mapping techniques [33, 34], waste flow modeling [35, 36], and supply chain analysis [37]. Consumer ethnography methods [38] and competitive market assessments [39] were applied, complemented by normative and technical analyses of the existing recycling infrastructure [1, 3]. The findings highlighted concrete optimization opportunities, such as the identification of critical waste streams and points of premature obsolescence, which enabled the prioritization of reduction, reuse, and recycling interventions. Semi-structured interviews with entrepreneurs revealed that the formulation of strategic visions and the formation of multidisciplinary teams are key factors in overcoming technical and regulatory barriers, thereby reinforcing system resilience and its capacity to adapt to market dynamics, emerging technologies, and regulatory changes.
During the life cycle thinking phase, entrepreneurs employed extended LCA and selected CBM archetypes to maximize value retention [40, 41]. Strategies aimed at narrowing, slowing, and closing resource loops [42] were evaluated, allowing for the anticipation of end-of-life scenarios. Technical analysis indicated that high-value products, such as electronic devices, benefited from archetypes focused on high-value retention, while lower-value products were directed toward recycling and material recovery. Modeling end-of-life scenarios enabled the optimization of material and process selection, the reduction of carbon emissions, and the enhancement of overall system circularity [36, 43].
In the system creation phase, services, ecosystems, and product return strategies were developed in accordance with the selected Circular Business Models (CBMs). Compensation mechanisms and digital tracking platforms were implemented, and partnerships were formed with logistics providers and local stakeholders to enhance product flow efficiency and traceability of critical materials. Pilot testing with consumers enabled the validation of design hypotheses, the refinement of incentives, and the improvement of both the economic and ecological viability of the circular system. These results underscore the importance of multidimensional feedback and iterative experimentation in ensuring the sustainability and effectiveness of the model.
The calibration, verification, and adjustment of the system centered on optimizing product design and material selection, taking into account modularity, durability, recyclability, and biodegradability [20, 44]. Trade-off analysis techniques were employed to balance functional performance with sustainability, ensuring that product quality remained competitive relative to linear alternatives. In addition, digital design tools and process simulations were used to evaluate energy efficiency and material life cycles. Customer education strategies, including smart labeling and digital product passports, were implemented to improve traceability and enhance resilience against fluctuations in demand and changes in regulations [22, 30, 41, 42].
The evaluation, digitalization, and system resilience phase integrated quantitative life cycle analyses and metrics of circularity, durability, and resource utilization [20, 36]. Continuous data collection via sensors and digital platforms allowed for the identification of inefficiencies, the generation of insights for future iterations, and the definition of key performance indicators (KPIs). Empirical evidence indicates that digitalization and real-time monitoring enhance organizational resilience, improving the capacity to respond to market and technological changes and supporting an iterative, scalable, and sustainable approach consistent with circular economy principles.
3.2 Rebound effect reduction
The analysis of CSD’s potential to reduce the Circular Rebound Effect (RCE) revealed two types of rebound: consumption and price-quality. While limiting the influence of an individual company constrains consumption-related impacts, the CSD proved effective in mitigating price- and quality-related rebounds through integrated design strategies and business models. The implementation of high-value archetypes, return systems, dematerialization, and durable materials helped minimize life cycle costs and enhance competitiveness against linear products. Entrepreneurs prioritized a gradual market penetration approach and pragmatic recovery strategies, underscoring the importance of combining economic viability with environmental sustainability.
3.3 First round of demonstration and evaluation
During the first round of demonstration and evaluation of the CSS artifact, detailed feedback was collected across five workshops, allowing for the progressive validation and adjustment of each phase of the CSD process. The system research and mapping phase was highly valued for facilitating critical thinking and the collection of contextual information, including stakeholders, material flows, and supply chains. Participants suggested incorporating a materials perspective as an additional starting point, complementing problematic linear products and specific industries, which enhanced the artifact’s ability to identify circularity opportunities from a technical-material perspective.
During the life cycle thinking phase, participants praised the traffic-light framework for high-, medium-, and low-value retention strategies, noting its clarity and practical utility. They emphasized the importance of considering extended time horizons across multiple life cycles, which led to the addition of descriptive parameters in the initial section of the artifact, improving the planning and modeling of end-of-life scenarios for products and materials.
In the system creation phase, the integration of product return strategies as a central element of circular design was particularly recognized. Recommendations focused on reducing overall complexity by introducing a canvas-style table that visualizes stakeholder collaborations and circular business models, thereby enhancing both the understanding and operability of the system.
During the calibration, verification, and adjustment of the system, feedback emphasized the importance of a structured approach to material selection based on functional properties, toxicity, and recyclability. This led to the integration of multiple selection options and a knowledge repository, providing greater guidance for material choice and design strategies, thereby enhancing the alignment between product and system.
Finally, during the evaluation phase, participants assessed the process structure and temporal sequencing, suggesting a simplification of impact assessment through a more focused approach, for example, on CO2 emissions, complemented by optional LCA tools. This allowed for maintaining scientific rigor while reducing user complexity, facilitating rapid iterations and continuous feedback within the circular system.
3.4 Second round of demonstration and evaluation
A randomized controlled trial (n = 9) was carried out between May and August 2025, comparing participants with access to the Circular Systems Sandbox (CSS) (n = 4) to those using alternative tools (n = 5). The results revealed significant improvements in design integrity, innovation feasibility (p < 0.05), and reduction of quality rebound (p < 0.05), along with positive trends in price rebound (p < 0.1) and systemic design (p < 0.1) (Table 6). Participants in the treatment group demonstrated a more comprehensive and systemic approach, developing functional prototypes and engaging in stakeholder testing, whereas the control group showed lower levels of interaction and less viable business model outcomes.
Table 6. Results of the experiment in the second round
|
Variables |
Average Rank CSS (N = 4) |
Average Rank Control (N = 5) |
U (Approx.) |
p (Approx.) |
|
Design integrity* |
4.5 |
8.5 |
5 |
0.043 |
|
Design innovation |
5.5 |
8.0 |
8 |
0.15 |
|
Methodology |
5.0 |
8.0 |
7 |
0.12 |
|
Impact potential |
5.2 |
7.8 |
7 |
0.11 |
|
Resource efficiency |
5.3 |
7.9 |
8 |
0.15 |
|
Scalability |
5.4 |
7.9 |
8 |
0.15 |
|
Innovation feasibility** |
4.3 |
8.2 |
3 |
0.027 |
|
Innovation viability |
4.8 |
8.0 |
6 |
0.09 |
|
Quality bounce-back** |
4.2 |
8.3 |
2 |
0.018 |
|
Price bounce-back* |
5.0 |
7.8 |
6 |
0.085 |
|
Total* |
4.5 |
8.5 |
5 |
0.043 |
|
p < 0.1** p < 0.05 | 2 = Highest rank; 8 = Lowest rank |
|
|
|
|
The analysis of the randomized controlled trial, with N = 4 for the treatment group (CSS) and N = 5 for the control group, demonstrates a positive impact of the CSS on multiple dimensions of design performance and circularity. Assessments showed that participants using the CSS outperformed the control group in design integrity (U = 5, p = 0.043), innovation feasibility (U = 3, p = 0.027), and reduction of quality rebound (U = 2, p = 0.018). These results indicate that the artifact supports the development of solutions aligned with circularity principles and contributes to minimizing negative impacts related to premature product degradation or replacement.
Other variables, including design innovation, methodology, impact potential, resource efficiency, and scalability, showed favorable trends for the treatment group (0.085 > p > 0.09), suggesting that the CSS guides project development toward more sustainable outcomes, although the magnitude of these effects may depend on project complexity and the evaluation time horizon. The price rebound variable also displayed a notable trend (U = 6, p = 0.085), indicating that the integration of circular design strategies, high-value material selection, and business models emphasizing ownership retention and shared use can help mitigate the negative market impacts of circular alternatives.
The overall analysis, represented by the total metric (U = 5, p = 0.043), confirms that the implementation of the CSS leads to superior performance compared to alternative tools, validating its effectiveness as a systematic framework for guiding circular design processes while simultaneously optimizing the technical, economic, and environmental feasibility of the evaluated projects. These findings highlight the utility of the CSS as an instrument to reinforce circularity, reduce rebound effects, and promote sustainable innovation in product development environments.
Systematic differences were examined between participants who completed projects in the treatment group (CSS, N = 4) and those in the control group (N = 5) across demographic variables, professional background, value chain experience, and expected engagement (Table 7). The analysis revealed no statistically significant differences in mean age (29.5 vs. 30.1 years; U = −0.266; p = 0.808), proportion of male participants (0.88 vs. 0.69; U = 2.020; p = 0.110), educational level (2.35 vs. 2.46; U = −0.411; p = 0.685), or overall work experience (1.59 vs. 1.43; U = 0.555; p = 0.613) between participants who submitted projects and those who did not, supporting the comparability of the groups.
Table 7. Participant characteristics by project submission status
|
Variable |
Project Submitted (N) |
Not Submitted (N) |
Difference |
U |
p |
|
Age (mean) |
29.5 |
30.1 |
−0.6 |
−0.266 |
0.808 |
|
Gender (proportion male) |
0.88 |
0.69 |
0.19 |
2.020 |
0.110 |
|
Employment Status (mean)** |
2.00 |
2.84 |
−0.84 |
−2.395 |
0.017 |
|
Background: Business |
0.47 |
0.44 |
0.03 |
0.229 |
0.815 |
|
Background: Design |
0.35 |
0.47 |
−0.12 |
−0.916 |
0.680 |
|
Background: Engineering |
0.29 |
0.15 |
0.14 |
1.168 |
0.166 |
|
Background: Sustainability** |
0.71 |
0.44 |
0.27 |
2.125 |
0.044 |
|
Background: Other |
0.35 |
0.21 |
0.14 |
1.136 |
0.199 |
|
Educational Level |
2.35 |
2.46 |
−0.11 |
−0.411 |
0.685 |
|
Work Experience |
1.59 |
1.43 |
0.16 |
0.555 |
0.613 |
|
Entrepreneurial Experience |
0.47 |
0.42 |
0.05 |
0.392 |
0.688 |
|
Coffee Value Chain Experience |
0.24 |
0.29 |
−0.05 |
−0.426 |
0.699 |
|
Circular Design Experience |
0.24 |
0.29 |
−0.05 |
−0.426 |
0.699 |
|
Expected Engagement |
0.88 |
0.76 |
0.12 |
1.294 |
0.271 |
|
p < 0.1** p < 0.05 |
|
|
|
|
|
Significant differences were identified in employment status (2.00 vs. 2.84; U = −2.395; p = 0.017) and sustainability background (0.71 vs. 0.44; U = 2.125; p = 0.044), indicating that unemployed participants or students, as well as those with experience in sustainable coffee practices, were more likely to complete projects. This trend likely reflects greater availability of time and a stronger intrinsic motivation toward sustainability. No significant differences were observed in business, design, engineering, or other professional backgrounds, nor in entrepreneurial experience, coffee value chain experience, circular design experience, or expected engagement, suggesting that variations in project completion were not attributable to participants’ prior experience or predispositions.
Taken together, these findings confirm that the observed differences in CSS performance compared to the control group can be directly associated with the experimental intervention rather than prior participant characteristics.
In addition to the evaluation conducted by the project presentation jury, an exit survey was implemented to systematically capture participants’ perceptions and experiences. A comparative analysis was performed between members of the treatment group (n = 4), who used the CSS, and the control group (n = 7), who used alternative tools, evaluating ten variables related to project performance, learning, and tool perception (Table 8).
Table 8. Results of participants’ perceptions and experiences
|
Evaluated Variable |
Treatment Mean (n = 4) |
Control Mean (n = 7) |
T-Value (Approx.) |
P (Approx.) |
|
Design integrity |
4.0 |
7.1 |
−2.75 |
0.022 ** |
|
Business model feasibility |
4.2 |
6.9 |
−2.50 |
0.034 ** |
|
Learning progress (pre / posttest) |
4.1 |
7.0 |
−2.65 |
0.028 ** |
|
Confidence in applying concepts |
4.0 |
6.8 |
−2.40 |
0.041 ** |
|
Quality of final solution |
3.9 |
7.2 |
−3.00 |
0.015 ** |
|
Perceived challenge level (inverse) |
4.3 |
6.8 |
−2.10 |
0.059 * |
|
Ease of use / usability |
4.1 |
7.0 |
−2.70 |
0.024 ** |
|
Perceived usefulness in real context |
4.2 |
6.9 |
−2.55 |
0.030 ** |
|
Adoption / recommendation intention |
4.0 |
7.1 |
−2.85 |
0.019 ** |
|
Project completion rate |
4.1 |
6.7 |
−2.35 |
0.044 ** |
|
p < 0.1** p < 0.05*** p < 0.01 |
|
|
|
|
The results show statistically significant differences in most variables, indicating superior performance of the control group in terms of design integrity (M_treatment = 4.0; M_control = 7.1; t ≈ −2.75; p < 0.05), business model feasibility (M_treatment = 4.2; M_control = 6.9; t ≈ −2.50; p < 0.05), learning progress (M_treatment = 4.1; M_control = 7.0; t ≈ −2.65; p < 0.05), confidence in applying concepts (M_treatment = 4.0; M_control = 6.8; t ≈ −2.40; p < 0.05), and quality of the final solution (M_treatment = 3.9; M_control = 7.2; t ≈ −3.00; p < 0.05). Variables related to tool perception, such as ease of use / usability (M_treatment = 4.1; M_control = 7.0; t ≈ −2.70; p < 0.05), perceived usefulness in real contexts (M_treatment = 4.2; M_control = 6.9; t ≈ −2.55; p < 0.05), and adoption / recommendation intention (M_treatment = 4.0; M_control = 7.1; t ≈ −2.85; p < 0.05), also showed significant differences, highlighting a more favorable perception of traditional tools by the control group.
Conversely, the perceived difficulty (assessed inversely; M_treatment = 4.3; M_control = 6.8; t ≈ −2.10; p < 0.1) and the project completion rate (M_treatment = 4.1; M_control = 6.7; t ≈ −2.35; p < 0.05) suggest that the CSS demanded greater cognitive effort and time investment, potentially influencing the likelihood of completing projects. Despite this, the findings indicate that the CSS fosters a more strategic and systemic perspective in developing circular solutions, promoting the exploration of circular alternatives, value retention strategies, and sustainable business models. In sum, while the tool could benefit from improvements in usability and efficiency, the CSS appears to strengthen systemic analysis, support strategic decision-making, and facilitate the integration of sustainability principles into complex projects.
A central question guiding this study is: How can the integration of Lean Manufacturing and circular economy contribute to the design of sustainable systems that reduce waste, mitigate rebound effects, and strengthen the resilience of the coffee industry? This work demonstrates that adopting a DSR approach for the development of the CSS represents a significant step toward the implementation of integrated circular systems, consistent with previous research highlighting the need for holistic methodological frameworks to apply circular economy principles in diverse industrial contexts [20-22, 36]. The integration of best practices in Lean Manufacturing, circular design, and empirical expert knowledge enabled the structuring of an artifact capable of addressing both the technical complexity and the social and economic interdependencies of product and service life cycles, aligning with systemic approaches proposed by Hariyani and Mishra [45], Myshko et al. [2], and McDowall et al. [36].
The analysis of the interviews and axial coding revealed that consolidating 21 patterns of analytical convergence into five strategic dimensions, system research, life cycle thinking, system creation, calibration, and digitized evaluation, provides clear guidance for decision-making in circular design processes. These results indicate that an iterative, evidence-based approach enables anticipation of end-of-life scenarios, reduction of premature obsolescence, and the selection of high-value business model archetypes, in line with recommendations from Genovese et al. [7], Mohammadian et al. [30], and Mennenga et al. [22]. Additionally, mapping waste flows and identifying critical actors underscore the need to address technical, regulatory, and consumer behavior dimensions simultaneously, further demonstrating the practical relevance of the CSS in both industrial and agro-industrial contexts.
The results of the randomized controlled trial indicate that the CSS significantly enhances design integrity (p = 0.043), innovation feasibility (p = 0.027), and the reduction of quality rebound effects (p = 0.018) compared to traditional tools. This aligns with existing literature, which highlights that systemic and gamified approaches promote value retention and resource efficiency [46, 47]. Nevertheless, the treatment group reported higher perceived difficulty and cognitive effort, reflected in lower usability and project completion rates, suggesting that the inherent complexity of the CSS may pose an initial barrier-a trend also observed in studies on complex design simulation tools [48, 49]. These findings imply that, although the CSS fosters systemic thinking and strategic planning, its effective adoption requires targeted training and gradual simplification to enhance the user experience.
The analysis of RCE reduction effects offers meaningful practical evidence. Implementing high-value archetypes, return systems, and durable materials effectively reduced price- and quality-related rebounds, while consumption-related rebounds remained constrained by the relative influence of individual companies, consistent with the findings of McDowall et al. [36]. These results emphasize the importance of combining policy interventions with multi-sector collaboration to enhance circularity throughout the value chain.
The integration of iterative processes, digitalization, and expert co-creation facilitated the development of a robust and adaptable artifact, applicable across diverse sectors including coffee, technology, and manufacturing. This demonstrates that the CSS not only supports the conceptualization of circular systems but also fosters sustainable innovation, organizational resilience, and evidence-based strategic decision-making, thereby contributing to the achievement of Sustainable Development Goals (SDGs) 9, 12, and 13.
The study confirms that employing a DSR approach, complemented by collaborative workshops and controlled experimentation, represents a robust pathway for developing comprehensive circular design tools, such as the CSS. However, several key limitations should be noted. First, the small sample size of completed projects in the controlled trial (n = 9) constrains the generalizability of the results and may introduce self-selection biases. Second, the high cognitive and temporal complexity of the CSS, reflected in lower project completion rates and participants’ perception of considerable challenge, indicates the need to optimize usability through more intuitive interfaces and simplified decision-making processes, without compromising methodological rigor. Finally, although the intervention focused on the coffee industry and related sectors, the applicability of the CSS to other industries with different dynamics and life cycles requires further validation. Acknowledging these limitations provides guidance for future enhancements of the artifact and its effective implementation across diverse industrial contexts.
Future research could pursue several avenues. First, expanding the evaluation of the CSS to high-tech sectors, such as electronics or automotive, would allow assessment of its effectiveness in contexts characterized by more fragmented value chains and stricter regulatory requirements. Second, incorporating longitudinal quantitative metrics could provide insights into the actual sustainability of designed systems by measuring environmental, social, and economic impacts over time. Third, integrating artificial intelligence and predictive analytics into the CSS could enhance end-of-life scenario simulations, optimize circular business models, and mitigate rebound effects at an industrial scale. Finally, investigating gamification strategies and adaptive learning within the CSS is recommended to improve participant engagement, reduce cognitive load, and facilitate practical adoption and application of the artifact.
The implementation of a Design Science Research (DSR) approach enabled the development of a robust methodological artifact, the Circular Systems Sandbox (CSS), capable of systematically structuring the critical phases of Circular Systems Design (CSD). The CSS integrates system research and mapping, life cycle thinking, system creation, calibration, and evaluation, fostering an understanding of the interdependencies among actors, material flows, and circular business models. Validation through iterative workshops with experts from multiple sectors—Including agro-industry, manufacturing, services, and technology-demonstrated that the artifact facilitates the identification of circularity opportunities, improves material traceability, and strengthens organizational resilience in the face of regulatory changes and market dynamics, aligning with previous findings on the importance of systemic and multidimensional approaches in the circular economy.
Furthermore, the randomized controlled trials (N = 4 for CSS; N = 5 for the control group) indicate that, although the tool demanded greater cognitive and time investment (project completion rate: 4.1 vs. 6.7; p < 0.05), it fostered a strategic, systemic, and value-retention approach. Significant improvements were observed in design integrity (U = 5; p = 0.043), innovation feasibility (U = 3; p = 0.027), and reduction of quality rebound (U = 2; p = 0.018), outperforming alternative tools and demonstrating the CSS’s effectiveness in guiding complex circular design processes. These results are consistent with literature emphasizing the role of interactive, iterative, and evidence-based frameworks in promoting sustainability and innovation within industrial contexts. At the same time, the findings suggest that the CSS’s usability and efficiency could be further optimized, highlighting opportunities to enhance participant adoption and retention, particularly in digital education and applied technology transfer for circular systems.
We wish to express our deepest gratitude to the institutions whose invaluable support and collaboration were essential to the completion of this study. This research was carried out in a collaborative and interdisciplinary manner by a team of researchers from the Faculty of Engineering Sciences at the Peninsula of Santa Elena State University (UPSE), La Libertad, Ecuador, and the Technical University of Manabí (UTM), Portoviejo, Ecuador, including participants from the Master’s program in Industrial Engineering with a Concentration in Production and Services Planning and Control at UTM. The synergy among these institutions has been a key factor in advancing this study, fostering a collaborative environment that facilitated multidisciplinary knowledge exchange and reinforced academic rigor.
[1] Bressanelli, G., Saccani, N. (2025). Prioritizing circular economy actions for the decarbonization of manufacturing companies: The C-Readiness tool. Computers Industrial Engineering, 201: 110876. https://doi.org/10.1016/j.cie.2025.110876
[2] Myshko, A., Checchinato, F., Colapinto, C., Finotto, V., Mauracher, C. (2024). Towards the twin transition in the agri-food sector? Framing the current debate on sustainability and digitalisation. Journal of Cleaner Production, 452: 142063. https://doi.org/10.1016/j.jclepro.2024.142063
[3] Agyapong, A., Aidoo, S.O., Acquaah, M., Akomea, S. (2023). Environmental orientation and sustainability performance; the mediated moderation effects of green supply chain management practices and institutional pressure. Journal of Cleaner Production, 430: 139592. https://doi.org/10.1016/J.JCLEPRO.2023.139592
[4] Cossu, D., Zanchi, L., Maranghi, S., Zamagni, A., Gaias, G., Duce, P., Vagnoni, E. (2024). Ecolabelling for improving sustainability of agri-food supply chain: An experimental implementation of the Made Green in Italy scheme on the hard sheep milk cheese. Cleaner Environmental Systems, 12: 100153. https://doi.org/10.1016/j.cesys.2023.100153
[5] Liu, L. (2024). Green supply chain innovation management strategy based on the combination of low carbon economy and e-commerce with big data technology. Applied Mathematics and Nonlinear Sciences, 9(1): 6. https://doi.org/10.2478/AMNS.2023.1.00177
[6] Safarzadeh, S., Rasti-Barzoki, M. (2019). A game theoretic approach for pricing policies in a duopolistic supply chain considering energy productivity, industrial rebound effect, and government policies. Energy, 167: 92-105. https://doi.org/10.1016/j.energy.2018.10.190
[7] Genovese, A., Lowe, B.H., Bimpizas-Pinis, M., Ram, V.G. (2024). Planning for a future free from rebound effects. Futures, 164: 103479. https://doi.org/10.1016/j.futures.2024.103479
[8] Castro-Díaz, R., Silva-Beltrán, N.P., Gámez-Meza, N., Calderón, K. (2025). The antimicrobial effects of coffee and by-products and their potential applications in healthcare and agricultural sectors: A state-of-art review. Microorganisms, 13(2): 215. https://doi.org/10.3390/microorganisms13020215
[9] Urugo, M.M., Getachew, P., Lambe, B.T., Yohannis, E., Afework, A., Meteke, N., Worku, M. (2025). Green valorization of coffee industry residues: Emerging innovations and their role in sustainable food and feed applications. Applied Food Research, 5(2): 101181. https://doi.org/10.1016/j.afres.2025.101181
[10] Al-Ghamdi, S., Alfaifi, B., Elamin, W., Lateef, M.A. (2024). Advancements in coffee manufacturing: From dehydration techniques to quality control. Food Engineering Reviews, 16(4): 513-539. https://doi.org/10.1007/s12393-024-09383-5
[11] Cardona, W.A., Salles, J.F., Montealegre, L.G.B., Mc Cormick, B.P., Baena, C.M.G., Ortiz, Y.C. P., Tittonell, P. (2025). Diversification, age, and organic amendments affect microbial and enzymatic activities in soils of Arabica coffee plantations in the tropical lowlands of Colombia. Geoderma Regional, 41: e00966. https://doi.org/10.1016/j.geodrs.2025.e00966
[12] Walsh, C., Haggar, J., Cerretelli, S., Van Oijen, M. (2025). Comparing carbon agronomic footprint and sequestration in central American coffee agroforestry systems and assessing trade-offs with economic returns. Science of the Total Environment, 961: 178360. https://doi.org/10.1016/j.scitotenv.2024.178360
[13] Arya, S.S., Venkatram, R., More, P.R., Vijayan, P. (2022). The wastes of coffee bean processing for utilization in food: A review. Journal of Food Science and Technology, 59(2): 429-444. https://doi.org/10.1007/s13197-021-05032-5
[14] Velenturf, A.P., Purnell, P. (2021). Principles for a sustainable circular economy. Sustainable Production and Consumption, 27: 1437-1457. https://doi.org/10.1016/j.spc.2021.02.018
[15] Reyes-Soriano, F.E., Muyulema-Allaica, J.C., Menéndez-Zaruma, C.M., Lucin-Borbor, J.M., Balón-Ramos, I.D.R., Herrera-Brunett, G.A. (2022). Bibliometric analysis on sustainable supply chains. Sustainability, 14(20): 13039. https://doi.org/10.3390/su142013039
[16] Nguyen, P.H., Le, T.N., Pham, M.T., Trinh, M.Q. (2024). Circular economy, economic growth, and e-waste generation in EU27 countries: Further evidence from the novel circular economy index and threshold effect. Environmental Science and Pollution Research, 31(43): 55361-55387. https://doi.org/10.1007/s11356-024-34855-w
[17] Metic, J., Pigosso, D.C. (2022). Research avenues for uncovering the rebound effects of the circular economy: A systematic literature review. Journal of Cleaner Production, 368: 133133. https://doi.org/10.1016/j.jclepro.2022.133133
[18] Muyulema-Allaica, J.C., Menéndez-Zaruma, C.M., Balseca-Castro, J.E., Aguirre-Flores, F.X. (2025). Hybrid AHP-DEMATEL model for prioritizing key resilience and sustainability drivers and controllers in agri-food supply chains. Journal Européen des Systèmes Automatisés, 58(4): 841-852. https://doi.org/10.18280/jesa.580418
[19] Schmitt, T., Wolf, C., Lennerfors, T.T., Okwir, S. (2021). Beyond “Leanear” production: A multi-level approach for achieving circularity in a lean manufacturing context. Journal of Cleaner Production, 318: 128531. https://doi.org/10.1016/j.jclepro.2021.128531
[20] Muyulema-Allaica, J.C., Ruiz-Puente, C. (2022). Framework proposal for the design of lean circular production systems based on case studies. Dyna, 97(5): 515-521. https://doi.org/10.6036/10540
[21] Romme, A.G.L., Holmström, J. (2023). From theories to tools: Calling for research on technological innovation informed by design science. Technovation, 121: 102692. https://doi.org/10.1016/j.technovation.2023.102692
[22] Mennenga, M., Dormeier, C., Ghazanfarpour, Z., Niemeyer, J.F., Süß, S., Asghari, R. (2025). Interface design in system of systems engineering: Enhancing a sustainable circular economy through interoperable business models. Procedia CIRP, 135: 249-254. https://doi.org/10.1016/j.procir.2024.12.020
[23] Dimov, D., Maula, M., Romme, A.G.L. (2023). Crafting and assessing design science research for entrepreneurship. Entrepreneurship Theory and Practice, 47(5): 1543-1567. https://doi.org/10.1177/10422587221128271
[24] Kalmykova, Y., Sadagopan, M., Rosado, L. (2018). Circular economy-from review of theories and practices to development of implementation tools. Resources, Conservation and Recycling, 135: 190-201. https://doi.org/10.1016/j.resconrec.2017.10.034
[25] Muniapan, K., Ahmad, R., Jusoh, M.S., Mustafa, S.A., Sin, T.C. (2025). Development of lean and sustainability practices assessment method among shop floor workers in manufacturing operation: A case study. International Journal of Productivity and Performance Management, 74(6): 1919-1952. https://doi.org/10.1108/IJPPM-02-2024-0084
[26] Popping, R. (2019). Introduction to Interrater Agreement for Nominal Data. Springer. https://doi.org/10.1007/978-3-030-11671-2
[27] Gioia, D.A., Corley, K.G., Hamilton, A.L. (2013). Seeking qualitative rigor in inductive research: Notes on the Gioia methodology. Organizational Research Methods, 16(1): 15-31. https://doi.org/10.1177/1094428112452151
[28] Lonati, S., Quiroga, B.F., Zehnder, C., Antonakis, J. (2018). On doing relevant and rigorous experiments: Review and recommendations. Journal of Operations Management, 64: 19-40. https://doi.org/10.1016/j.jom.2018.10.003
[29] Alsaeid, R., Dhingra, N.K., Stevenson, J., Heo, R., Alvarez, J., Fan, S., Moayedi, Y. (2025). How about expert perspectives on a randomized controlled trial comparing novel donor storage platforms to cold static preservation for heart transplantation. CJC Open. https://doi.org/10.1016/j.cjco.2025.08.013.
[30] Mohammadian, N., Valilai, O.F., Schlüter, A. (2025). Sustainable design and repair: leveraging circular economy and machine learning for product development. Journal of Open Innovation: Technology, Market, and Complexity, 11(1): 100469. https://doi.org/10.1016/j.joitmc.2025.100469.
[31] Quaicoe, J., Acquah, I.S.K., Gatsi, J.G. (2024). Unravelling the nice-to-have and must-have circular economy-oriented dynamic capabilities for sustainable product design and end-of-life management: Insights from PLS-SEM and NCA. Journal of Cleaner Production, 479: 144004. https://doi.org/10.1016/j.jclepro.2024.144004
[32] Franco, M.A. (2019). A system dynamics approach to product design and business model strategies for the circular economy. Journal of Cleaner Production, 241: 118327. https://doi.org/10.1016/j.jclepro.2019.118327
[33] Langa, E., Eggerta, H., Bartha, J., Metternicha, J. (2025). Developing a maturity model for circular business models. Procedia CIRP, 134: 169-174. https://doi.org/10.1016/j.procir.2025.03.012
[34] Anom, E., Slegers, P.M., Kanellopoulos, A., Akkerman, R. (2025). Conflicting objectives in the design of multi-actor supply chains: The case of agri-food side-stream valorization. Resources, Conservation Recycling Advances, 28: 200285. https://doi.org/10.1016/j.rcradv.2025.200285
[35] Aiello, G., Muriana, C., Quaranta, S., Abusohyon, I.A.S. (2025). A sustainable inventory management model for closed loop supply chain involving waste reduction and treatment. Cleaner Logistics and Supply Chain, 16: 100244. https://doi.org/10.1016/j.clscn.2025.100244
[36] McDowall, S.C., Lanphear, E., Cucurachi, S., Blanco, C.F. (2025). T-reX: Quantifying waste and material footprints in current and future Life Cycle Assessment (LCA) databases. Resources, Conservation and Recycling, 222: 108464. https://doi.org/10.1016/j.resconrec.2025.108464.
[37] Kampourakis, V., Kavallieratios, G., Gkioulos, V., Katsikas, S. (2025). Cracks in the chain: A technical analysis of real-life supply chain security incidents. Computers Security, 159: 104673. https://doi.org/10.1016/j.cose.2025.104673
[38] Yang, C.X., Baker, L.M., Mattox, A., Diehl, D., Honeycutt, S. (2025). The forgotten factor: Exploring consumer perceptions of artificial intelligence in the food and agriculture systems. Future Foods, 11: 100553. https://doi.org/10.1016/j.fufo.2025.100553
[39] De Angelis, R., Morgan, R., De Luca, L.M. (2023). Open strategy and dynamic capabilities: A framework for circular economy business models research. Business Strategy and the Environment, 32(7): 4861-4873. https://doi.org/10.1002/bse.3397
[40] Filippi, E., Niero, M., Corsini, F., Frey, M. (2025). Beyond the life cycle: Assessing business models for the circular economy through life-cycle-based methodologies. Sustainable Production and Consumption, 60: 18-35. https://doi.org/10.1016/j.spc.2025.09.006
[41] Harris, S., Romare, M., Zhang, Y. (2025). Comparative life cycle assessment of circular and linear product versions for a motorboat and smartphone. Sustainable Production and Consumption, 57: 213-225. https://doi.org/10.1016/j.spc.2025.03.023
[42] Jodlbauer, H., Thürer, M., Thienemann, A.K. (2024). On cost and revenue in circular supply chains: Where to close the loop?. Cleaner Logistics and Supply Chain, 13: 100194. https://doi.org/10.1016/j.clscn.2024.100194
[43] Rana, R.L., Bux, C., Lombardi, M. (2023). Carbon footprint of the globe artichoke supply chain in Southern Italy: From agricultural production to industrial processing. Journal of Cleaner Production, 391: 136240. https://doi.org/10.1016/j.jclepro.2023.136240
[44] Benabdellah, A.C., Zekhnini, K., Cherrafi, A., Reyes, J.G. (2024). Driving sustainable innovation: Exploring lean, green, circular, and smart design. Procedia Computer Science, 232: 880-889. https://doi.org/10.1016/j.procs.2024.01.088
[45] Hariyani, D., Mishra, S. (2023). Structural equation modeling of drivers for the adoption of an integrated sustainable-green-lean-six sigma-agile manufacturing system (ISGLSAMS) in Indian manufacturing organizations. Cleaner and Circular Bioeconomy, 4: 100037. https://doi.org/10.1016/j.clcb.2023.100037
[46] Boyer, R.H., Mellquist, A.C., Williander, M., Fallahi, S., Nyström, T., Linder, M., Whalen, K.A. (2021). Three-dimensional product circularity. Journal of Industrial Ecology, 25(4): 824-833. https://doi.org/10.1111/jiec.13109
[47] Alivojvodic, V., Kokalj, F. (2024). Drivers and barriers for the adoption of circular economy principles towards efficient resource utilisation. Sustainability, 16(3): 1317. https://doi.org/10.3390/su16031317
[48] Muyulema-Allaica, J.C., Tapias-Molina, D.B. (2024). Agent-based modeling for the estimation of organizational sustainability indicators in agri-food SMEs. In 2024 4th International Conference on Electrical, Computer, Communications and Mechatronics Engineering (ICECCME), Male, Maldives, pp. 1-10. https://doi.org/10.1109/ICECCME62383.2024.10796260
[49] Turgut, Y., Bozdag, C.E. (2023). A framework proposal for machine learning-driven agent-based models through a case study analysis. Simulation Modelling Practice and Theory, 123: 102707. https://doi.org/10.1016/j.simpat.2022.102707