Saverio Mirandola*![]() | Marco Puglia
| Marco Puglia![]() | Alberto Muscio
| Alberto Muscio![]() | Paolo Tartarini
| Paolo Tartarini![]()
© 2025 The authors. This article is published by IIETA and is licensed under the CC BY 4.0 license (http://creativecommons.org/licenses/by/4.0/).
OPEN ACCESS
Dry air nut roasting is a widely used process in the food industry that relies on a stream of hot air to dry and roast the main product (such as almonds, hazelnuts, walnuts, peanuts etc.). This process consists of two main phases: the drying phase, where most of the moisture content is significantly reduced, and the roasting phase, where the Maillard reaction develops the characteristic roasted flavor and crunchy texture of the final product. Traditionally, this energy-intensive process relies on conventional gas burners to achieve process temperatures up to 140-180℃. This case study investigates the benefits of implementing a hybrid thermal system that combines gas and electrical power by using an electric pre-heater supported by an on-site rooftop photovoltaic (PHV) ranging from 1 MW to 3 MW. At first an energetic model of the dry air roasting process is developed to correlate the required thermal power with the specific roaster's productivity finding out that for specific process parameters assumptions the energy requirement is approximately 197 Wh/kg of net product. Subsequently gas savings relative to the range of installed electric pre-heater power (0–500 kW) are assessed: therefore, it has been possible to identify a peak annual gas savings up to 291 € per kW of pre-heater power installed and a reduction of CO2 emissions ranging up to 140 ton/year depending on actual heater configuration. Eventually, an economic assessment is finally conducted to investigate the most efficient use of the electricity produced from the photovoltaic referred to the market trading value of both electric energy and gas.
dry roasting, economic analysis, electric heater, energy efficiency, photovoltaic
The dry nut industry is very widespread and involves a lot of processes throughout all the supply chain from the initial harvesting up to the final packaging and selling all around the world [1]. Dry air nut roasting is an effective way to dry and roast nuts using a thermal medium – the air – which does not add any nutritional content to the product and so can be considered healthier than traditional frying alternatives in order not to change the organoleptic features of the nut [2].
There are various technologies to be used for nut drying and roasting [3], in this article the focus is on mesh conveyor belt continuous roasters. In this type of dry roaster, the air is heated up by means of a modulating gas burner, which can be fed by either LPG or Natural Gas and can reach temperatures up to 140-180℃ depending on process data and final product desired characteristics [4]. The gas burner is directly installed into the main process air duct, thus generating a stream of hot air that is mixed with the main process air flow. Then, such air flow is directed onto a bed of product that is placed over a steel mesh conveyor belt that is constantly moving to bring the product from the loading hopper at the beginning up to the exit of the process. The process occurs when the stream of hot air flows through the bed of the product, so to exchange thermal energy acquired from the burner and exchange it with the product itself. Then the exhaust air downstream the process is either conveyed outside the roaster or partially recovered (either in mass or only energy by a heat exchanger) to increase the process efficiency. The process temperature requirement is usually given by a probe placed inside the process room that eventually commands the gas modulating valve according to the thermal requirements.
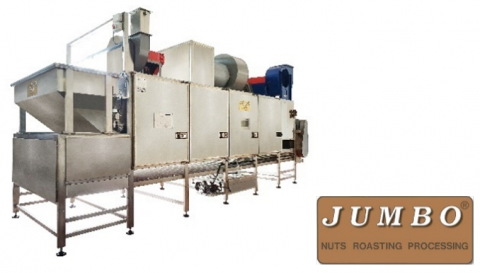
Figure 1. VUORMAR JUMBO dry roaster
In the following case scenario, the feasibility study presented has been carried out considering a Dry Roaster model JUMBO such as the one in Figure 1 (VUORMAR Packaging s.r.l. [5]).
Nonetheless, contrary to the standard and usual configuration, the installation of a hybrid thermal source composed of the following devices has been considered:
- A First electric heater which pre-heats the air before entering the burner stage to decrease the enthalpy leap of the burner itself.
- Natural gas burner which follows the pre-heating stage, and it is used according to the temperature requirement of the product to be dried and roasted.
As energy supply for the electric feeding requirements of the hybrid system, a photovoltaic field is considered installed onto the rooftop of the factory (that is meant to feed also other energy requirements); to do so, five annual irradiation data has been collected from a certified data-collection center in North of Italy [6, 7] and three different sizes of photovoltaic field has been considered from 1 MW to 3 MW (considering a typical medium factory installation field size).
The approach presented in this work is the following: Firstly, the roasting process has been energetically modeled to assess the specific energy requirements of the process in relation to the unit of processed mass; then the daily energy production capability of the photovoltaic backup field has been studied.
Eventually, according to previous assessments, different scenarios have been investigated in order to evaluate the actual gas savings in relation to the size of the installed electric pre-heater both energetically and economically. Finally, the environmental benefits of such a system are investigated.
2.1 Dry roasting process modelling
Roasting process occurs in two different macro-phases. The first is the drying of the product, where most of the moisture content is evaporated at middle-low temperatures to stabilize the microstructure of the nut as reported by Young et al. [8] & Almonds board of California guidelines [4]; the latter is the roasting phase where the Maillard reaction takes place and gives the product the typical roasted and crunchy texture following Perren and Escher [9] & Saklar et al. works [10]. In this phase higher temperatures are used to enhance the roasted flavor while the moisture content is slightly decreased through diffusion.
Different kinds of nuts can be processed such as hazelnuts, almonds, peanuts, walnuts, and pistachios [11]. In this context, Almonds are considered as the main nut to be roasted as they are widespread in the dry roasting industry [1, 12-14] due to their widespread process conditions that are subjected to [1, 12-14] and their main properties have been assumed as in Table 1 [15].
Table 1. Main nut modelling assumptions
|
Product |
Density |
Specific Heat |
|
Almonds |
460 kg/m3 |
2200 J/(kgK) |
Following the manufacturer common process guidelines [5] the raw almonds enter in process with ambient temperature and moisture that ranges from 5% to 10% [4, 15, 16]. A moisture content of 8% is assumed from here below. From manufacturer process energy analysis, it is then assumed to have two different coefficients:
The former is for determining the heat loss of the main thermal source (e.g. the burner) and it is assumed at 90%. These losses are mainly due to the fact that not the whole thermal power by combustion that occurs in the burner is completely transferred and adiabatically mixed with the process air. A portion of the thermal power is lost due to convection and conduction losses through the main process duct [17].
The latter is for determing the heat exchange between the thermal medium and final product and it is assumed at 70%. This is due to the fact that, since the process air is flowing through the bed of product placed onto the main conveyor belt, not all the thermal energy of the air is transferred and so the exhaust air after the process is still warm. These losses can be reduced by optimizing the air flow path through the process camera but from manufacturer approach the thermal losses are around 30% resulting in a heat exchange/roasting coefficient of 70 % approximately as explained in Table 2.
Table 2. Main roasting process assumptions
|
Property |
Value |
|
Drying Max Temperature [4, 8, 10] |
80℃ |
|
Saturation Vapor pressure |
47.5 kPa |
|
Roasting Max Temperature [4, 8, 10] |
150℃ |
|
Saturation Vapor pressure |
490.2 kPa |
|
Inlet Moisture Content |
8% |
|
Outlet Moisture Content |
1% |
|
Burner/Heater heat exchange efficiency |
90% |
|
Hot air/Product heat exchange efficiency |
70% |
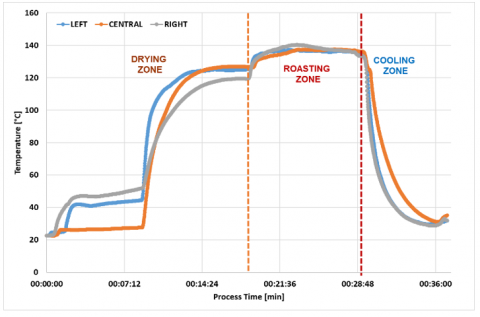
In such roaster, three different process phases occur which are namely Drying, Roasting and Cooling. As shown in Figure 2, a temperature trend made with 3 different temperature dataloggers over the whole process in three different positions (left, right and central) onto the product conveyor belt is reported. As it is possible to notice the drying phase is a phase of transition where both evaporation of internal moisture and increase of surface kernel temperature occur. During the roasting phase the temperature is then stabilized at desired values to get the required aroma. Cooling phases at the end eventually needs to be done in order to stop the roasting reaction onto the dried nut and so to control the organoleptic features of the product. Indeed, if the product is not cooled enough the chemical cooking reactions go on and can ruin the desoldered characteristics of the process [4, 10].
Figure 2. Temperature diagram example (made with datalogger in VUORMAR JUMBO process roaster) [5]
Following Figure 2 and Table 2 assumptions it is then possible to assess the overall required thermal power for the combined process. The evaluation can be made for each process phase to assess each thermal energy requirements according to assumptions made above. In the Table 3 below the whole roasting process is assessed.
Table 3. Main roasting process subdivision
|
Drying Phase |
||
|
Property |
Inlet |
Outlet |
|
Temperature |
20℃ |
80℃ |
|
Moisture Content |
8% |
3% |
|
Roasting Phase |
||
|
Property |
Inlet |
Outlet |
|
Temperature |
80℃ |
150℃ |
|
Moisture Content |
3% |
1% |
|
Cooling Phase |
||
|
Property |
Inlet |
Outlet |
|
Temperature |
150℃ |
40℃ |
|
Moisture Content |
1% |
1% |
The total necessary power is then given by the sum of latent heat and sensible heat as for the Eq. (1) computed for each phase (respectively drying and roasting) increase by means of the two effectiveness coefficient regarding the process explained above in Table 2. The cooling phase is not taken into account for thermal power computation, but it is shown to show the whole cycle dynamic.
$P_{ {total }}=\frac{P_{{latent }}+P_{{sensible }}}{\eta_{ {burner }} \cdot \eta_{{air product\ heat\ exchange }}}$ (1)
Eq. (2) and Eq. (3) represent the latent and sensible heat power equations to be used above. The former is used for the evaporation of moisture content of the product given by the delta of $\left(M C_{{out }}-M C_{{in }}\right)$ (i.e. the relative humidity difference of the product at inlet and outlet of the process) considering a $h_{{vaporization }}$ latent heat of vaporization of water of 2272 kJ/kg. The latter is used for computing the sensible heat to be applied to the net product (whose specific heat is given by $cp_{ {product}}$) to increase its temperature from the inlet one ($T_{i n}$) to the outlet one ($T_{{out }}$) at the end of each phase following what written in Table 3.
$P_{ {latent }}=\dot{m}_{{product }} \cdot\left(M C_{{out }}-M C_{{in }}\right) \cdot h_{{vaporization }}$ (2)
$P_{ {sensible }}=\dot{m}_{ {product }} \cdot c p_{{product }} \cdot\left(T_{{out }}-T_{ {in }}\right)$ (3)
It is then possible to assess the specific power requirements referred to the unit of mass of product entering in the process by dividing the whole thermal power computed by Eq. (1) by the mass flow rate of product to be processes. As below, the specific power is function of the following parameters: Moisture content variation, Temperature increase and specific heat of the product (as the water latent heat of vaporization is a constant) as in Eq. (4).
$P_{ {specific }}=\frac{P_{ {total }}}{\dot{m}_{{product }}}$ (4)
2.2 Hybrid gas – electric installation
Coming to the hybrid system features the electric heater acts as a pre-heating stage thus reducing the enthalpy leap demanded by the gas burner. Usually, common electric heaters are made by electric filaments with variable diameter and length as in the figure below. The heater is then installed as a common duct into the main process air duct.
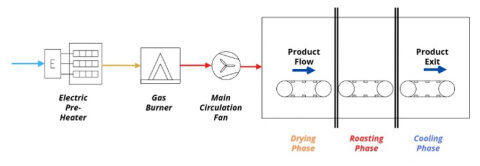
The thermoregulation dynamic of the two systems presented is very different: while the gas burner is very rapid and clear in the transitory phases due to an analogic control in 4-20 mA of the main gas flow valve, the electric pre-heater follows a more discrete thermoregulation curve, that eventually can shut of only some heaters stages when modulating the power by means of solid state relays in the main electrical control cabinet. In Figure 3 a simplified process flow diagram of the hybrid installation is shown.
Figure 3. PFD (simplified process flow diagram) of hybrid dry roasting
Depending on the actual size of the heater, it is possible to assess the enthalpy leap of the process air entering the roaster respectively in Eq. (5) and Eq. (6). Namely the ration between these two values is given by the temperature increase to the process air.
$P_{ {pre-heating-stage }}=\dot{m}_{ {process \ air }} \cdot d h_{{electric \ heater }}$ (5)
$P_{{burner-stage }}=\dot{m}_{ {process \ air }} \cdot d h_{ {burner }}$ (6)
Coming to the assessment of the size of the electric pre-heater, it is then possible to use Eq. (7) to evaluate the actual gas savings in terms of standard cubic meters (smc) consumption over the electric installed pre-heater power. Basically, it has been assessed how much gas flow volumetric rate can be saved by replacing it as main thermal source with the daily electrical energy producibility. The value is then normalized by dividing it by the installed pre-heater size to have an insight into gas saving (or replacing) efficiency. A higher value means that the available electric power is well exploited to save as much as possible while a lower one means that not the whole electric potential is being exploited enough.
$\begin{aligned} & { Saving }_{ {specific }} =\frac{{ smc }_{{avoidedgas }} \cdot{ hour }_{{work }} \cdot { days }_{ {work }}}{P_{ {pre-heater }}}\end{aligned}$ (7)
While the absolute saving amount in €/year of avoided supplied gas can be assessed by means of Eq. (8) where the daily amount of saved gas can be recollected to the overall revenues:
$\begin{aligned} { Saving }_{{absolute }}= { smc }_{ {avoidedgas }} \cdot { hour }_{ {work }} \cdot { days }_{ {work }} \cdot{ Gas }_{{price }}\end{aligned}$ (8)
Moreover from this daily approach it is possible to assess two other fundamental coefficients for the assessment: The former is the electric energy replacing factor of the process described by the Eq. (9). This is a coefficient that basically assess how much gas powered thermal source can be replaced by the electric energy use based on the fact that a portion of gas consumption is replaced by available electric energy coming from the PV in relation to a reference production output (which is for the considered JUMBO roaster 2000 kg/h [5]). A 100% replacing factor means that all the previous gas thermal source can be replaced by the use of available energy.
$Replacing\ Factor { }_{ {gas } \rightarrow { electric }}=\frac{S m c_{ {avoidedgas }}}{L H V_{N G} \cdot P_{{total }}}$ (9)
Instead, the latter is the percentage exploitation of the heater in relation to the actual energy production availability which is represented by Eq. (10):
$Pre - Heater _{\% { Use }}=\frac{\left(\frac{E_{ {daily }}}{{ hour }{ }_{ {work }}}\right)}{P_{{pre }- { heater }}}$ (10)
Table 4 sums up the considerations that have been made regarding the above-mentioned assumptions:
Table 4. Main general assumptions
|
Property |
Value |
|
Natural Gas LHV [18] |
9.842 kWh/smc |
|
Natural Gas Min Cost 2019-2024 [18] |
0.46 €/smc |
|
Natural Gas Max Cost 2019-2024 [18] |
1.31 €/smc |
|
Natural Gas Emission Coefficient [19] |
2.019 kgCO2/smc |
|
Annual Work Rate |
60% (220 days over 365) |
|
Daily Working Rate |
10 hours/day |
|
Reference Production Output [5] |
2000 kg/h |
|
Reference Thermal Required Power by Eq. (1) [5] |
393 kW |
2.3 Photovoltaic energy producibility
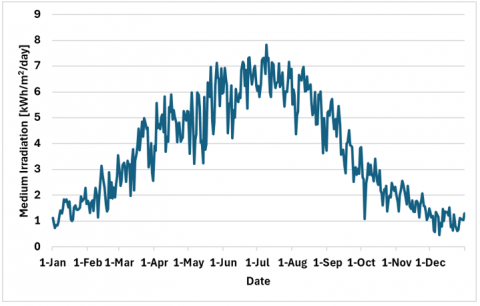
The overall producibility of Photovoltaic has been determined by means of the medium irradiation throughout the 2020-2024 period considered. In Figure 4 the medium irradiation for the North Italy Sample Town has been investigated by means of PV-GIS and local irradiation station database [6, 7].
Figure 4. Medium irradiation 2020-2024
In particular, the following assumptions referred to in Table 5 have been made over the performance of the PV field: It has been considered a Panasonic Anchor 540 W power module, with a net electric efficiency referred to STC conditions of 21.2% and a Module Ventilation Efficiency of 70% (which is according to the study [20] the worst and precautionary ventilation coefficient). Then to assess the overall area used for the PHV field it has been considered to use a 90% coefficient:
The daily energy producibility has been evaluated by means of the Eq. (11) which is referred to the UNI/TS 11300 [20],
$E_{{daily }}=\frac{I_{{day }} \cdot P_{{photovoltaic }} \cdot M V E}{{ I\_reference }}$ (11)
Table 5. Main PHV efficiency assumptions [21]
|
Property |
Value |
|||
|
Single Module Peak Power STC |
540 W |
|||
|
Single Module Area |
2.58 m2 |
|||
|
Single Module Specific Power |
212 W/ m2 |
|||
|
Module Ventilation Efficiency (MVE) [20] |
70% |
|||
|
Area Estimation Coefficient |
90% |
|||
|
Reference Irradiation [20] |
1 kW/m2 |
|||
|
Considered Power Range |
1 – 3 MW |
|||
|
Productivity |
1 MW |
2 MW |
3 MW |
|
|
Required Area |
5221 m2 |
10442 m2 |
15662 m2 |
|
|
Total modules |
2020 |
4040 |
6060 |
|
As it is clearly understandable, the photovoltaic gives its maximum contribution to the production during the spring and summer months such as from April to September. During winter and fall, the actual production difference is less evident.
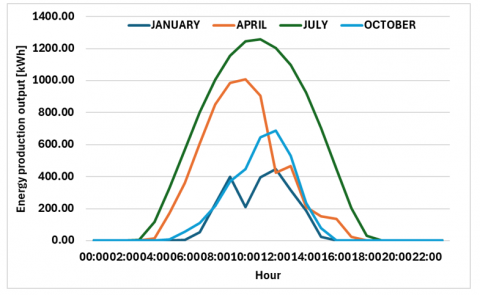
The hourly production has been then evaluated through samples months such as January, April, July and October 2024 in all three-power size to get an insight of the possible system dynamics throughout the daily production cycle. Figure 5 below shows the 3 MW case scenario.
Figure 5. Hourly production rate 3 MW
It has been then considered dedicating 100% of the produced energy to feed the electric pre-heater throughout the daily production cycle. It was then possible to compare the actual kWh energy daily production with the overall process specific energy requirements to recover the final maximum daily productivity of the roaster following Eq. (12).
$\dot{m}_{{hour }- { maximum }}=\frac{E_{{daily }}}{P_{{specific }}}$ (12)
3.1 Dry roasting specific energy requirements
After having assessed the roasting process from an energy point of view thanks to Eqs. (1)-(3) and referred it to specific energy requirements Wh/kg using the Eq. (4) the following has been stated: the specific energy requirements for the dry air roasting are 197 Wh/kg according to assumptions made in Table 2 and Table 3 can be found in Table 6 below.
Table 6. Computed process energy requirements
|
Specific Energy Requirement |
Drying |
Roasting |
Cooling |
|
Latent Heat |
51 Wh/kg |
20 Wh/kg |
-- Wh/kg |
|
Sensible Heat |
58 Wh/kg |
68 Wh/kg |
68 Wh/kg |
|
Total Re. Energy |
109 Wh/kg |
88 Wh/kg |
68 Wh/kg |
|
Total Thermal |
197 Wh/kg |
|
|
As previously said, the cooling phase is not considered for the thermal required power computation as it is a phase where the product is cooled down using a stream of filtered ambient air and so sensible heat is taken away from the hot product in order to stop the roasting chemical reaction [3].
3.2 Maximum daily production output
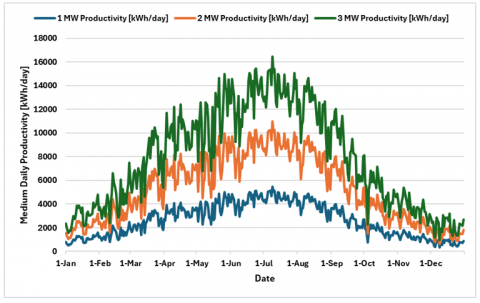
Following Eq. (9) it has been possible to assess the daily production contribution given by the backup photovoltaic field that is ultimately depicted in Figure 6 in order to get an insight over the maximum production capacity in a scenario where 100% of the produced energy is used in such system.
Figure 6. Medium daily producibility in three case study 1, 2, 3 MW
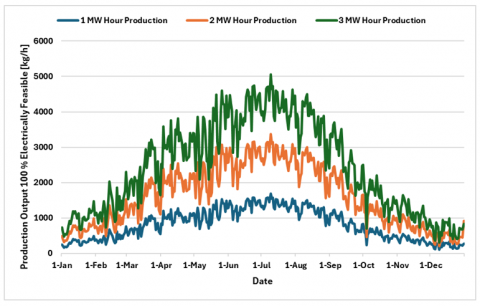
Then following Eq. (11) the maximum feasible production that can be achieved by exploiting 100% the energy output of the photovoltaic field is expressed in Figure 7. Table 7 summarise the potential production capacity for three case scenarios respectively identifying the minimum, medium and maximum peak production output for a PV powered system.
Figure 7. Medium daily producibility in three case study 1, 2, 3 MW
Table 7. Min-max productivity results
|
Productivity |
1 MW |
2 MW |
3 MW |
|
Minimum |
99 kg/h |
198 kg/h |
297 kg/h |
|
Medium |
803 kg/h |
1607 kg/h |
2409 kg/h |
|
Maximum |
1686 kg/h |
3371 kg/h |
5056 kg/h |
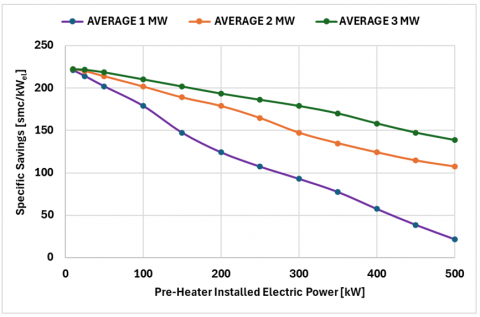
Eventually the following approach is to evaluate the actual gas consumption saving efficiency as referred to in Eq. (7).
It can be noticed that increasing the pre-heater installed power size makes the overall gas specific savings decrease.
This is because with lower pre-heater installed power the normalized energy requirements can be saturated more quickly rather than with higher power and so the maximum specific savings efficiency can be found at lower pre-heating installed power where all the heater is exploited in most cases by the photovoltaic backup availability. As further proof of this, the stability of the specific savings increases with higher backup photovoltaic energy producibility and so with higher PV field size. This is since overall energy producibility is less influenced by pre-heater use and the saturation of the pre-heating system is less sensitive. Figure 8 eventually resumes the three-energy scenario considered for the photovoltaic backup size. The sensitivity of the savings in relation to the actual PV size is evident.
Figure 8. Specific Gas savings flow rate overview
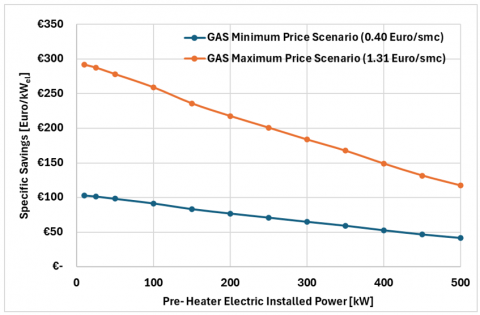
Coming to the overall absolute gas savings in terms of revenues from saved gas consumption, they are function of the gas price and can range between the two assumed extreme values min and max during 20-24 period as in the Table 4 where the natural gas price has ranged between 0.46 €/smc and 1.31 €/smc. Respectively the overall specific savings ranges up to 103 €/smc for the former and 291 €/smc for the latter that eventually end up with the trend depicted in Figure 9.
Figure 9. Specific Gas savings revenues
The absolute saving amount is then calculated by Eq. (8) and shown in Figure 10 underlining that for 1 MW scenario, from 300 kW on, the overall saving trend is reversed, and it then decreases (with a parabolic-like trend) as the pre-heater cannot be fully exploited and so the days when the heater is 100% used are decreased as well, ultimately lowering the actual economic benefit.
Figure 10. Absolute gas savings efficiency overview
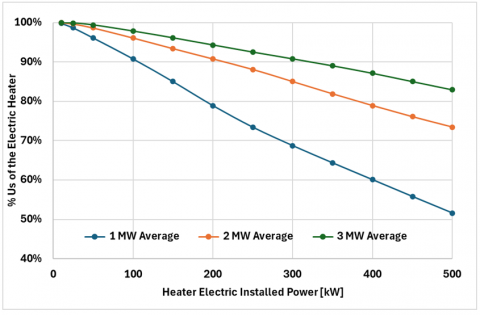
Following Eq. (9) it is then possible to assess in Figure 11 the exploitation of the pre-heater according to the different studied scenarios underlining the stability of disposing higher PHV backup sizes.
Figure 11. Medium use of the heater
The process efficiency is also increased by evaluating the overall medium daily gas saving in relation to the gas consumption demand for the process. Below in Figure 12 the replacing factor trend given by Eq. (9) is shown which clearly states that for higher pre-heater capacities it would be feasible to use 100% electric energy instead of gas to feed up the main process.
Figure 12. Replacing factor overview
3.3 Economic analysis
The economic return has been then investigated to understand the profitability of using such a system in the country’s energy scenario. Given that using the produced energy to supply the pre-heater always has a positive outcome in gas consumption reduction, the economic maximum achievable benefit of using such system in the abovementioned scenario is highly dependent on the electric energy selling price and gas purchase price. Since the Italian GSE does not correspond any favourable standard exchange for photovoltaic plants with power sizes above 200 kW [22], the selling of the electric energy follows the market fluctuations, particularly the PUN GME Index. In Figure 13 the energy trading cost referred to electricity [23] and natural gas [19] have been reported over a 10 years’ timespan from 2014 to 2024.
Figure 13. Electricity vs. gas trading cost
It is found that the economic benefit of using electric produced energy to replace gas consumption in such process is found whenever the actual electricity trading cost is lower than the gas purchase value. By this, whenever the gas purchase value is higher, it is favourable to use the pre-heater powered by the photovoltaic field while instead if the electricity trading cost is higher it is still more efficient to use gas for thermal process and sell the energy produced surplus onto the grid. Following Figure 13 it is possible to notice that the gas has been favourable since 2017 where gas price was 61.5 €/MWh and electricity price was 53.9 €/MWh.
3.4 Emission assessment
Moreover, the exploitation of such a hybrid system could help decrease the overall CO2 emissions of the whole process. Following Figure 14 is it then possible to see that the avoided emissions can range up to 140-ton CO2/year for the 3 MW scenario while the 1 MW peak is about 58-ton CO2/year. The interesting thing is that for electric pre-heater power up to 150 kW, the overall emissions are very similar in the three scenarios studied within a range of approximately 30% so the overall size of the PHV does not influence so much the environmental benefit on these power sizes. Nonetheless, over higher heater power sizes such as from 150 kW up to 500 kW, the influence of the photovoltaic backup is much more evident with a net fluctuation that can ranges up to 50% considering 2 MW-3 MW scenario and even four times avoided emissions for the 1 MW – 3 MW relation scenario. The 1 MW scenario trend has a descending phase since for higher pre-heating sizes (over 300 kW approx.) the full exploitation of the pre-heater itself is not feasible because it is oversized compared to the saturation capacity of the photovoltaic field (following what has been already stated in Figure 10). And this is relatable to a lower exploitation of the available pre-heater power that ends with a reduction in gas savings benefices.
Figure 14. Average avoided emissions
The aim of the computations above has been to investigate the feasibility of disposing of a hybrid thermal solution to generate the hot air used for dry roasting processes whenever a photovoltaic backup field is available. The size of the electric pre-heater follows the actual size of the photovoltaic field and can determine whether the heater is well exploited or not during actual use throughout the whole production year. The actual size follows indeed the specific energy consumption per kg of net roasted product that is ultimately determined by the required process parameters according to the product recipes. This can be also determined by the flexibility requirement of the customer who can decide to increase or decrease the power size according to variations in the production output and use of the roaster throughout the year to absorb some production output peak requests.
The economic benefit of such a system follows the country energy trading scenario and can be considered favorable whenever the electricity price is lower than the gas purchase cost: in this case the on-site use of produced energy would be much more valuable than actual re-selling onto the grid.
Following Italy energy trading scenario indeed the exploitation of produced electric energy has not been virtually favorable since 2018 where the gas price was higher than electricity trade value and so resulting that in such background the most efficient use of such PHV produced energy could have been to be sold onto the grid.
Despite the economic benefit is variable and depending on country energy market trade values, the environmental benefit is positive considering that potentially such a system could lead to a considerable emission reduction that peaks at 140-ton CO2/year for 3 MW and 58-ton CO2/year for 1 MW scenario.
The proposed solution may be particularly game changing whenever the energetic scenario of the country (where the customer is sited) is favorable for electric exploiting rather than gas use in order to increase the energetic efficiency of the process behind the manufacturing of dry nut industry [24]. France for example would be a country scenario where the exploitation of such device could help reduce the overall CO2 emissions due to gas burning processes even more since the country energy system is less reliant on gas sources that eventually lead to a decrease in electricity specific cost and an increase in its use in industrial processes [25, 26].
Eventually the proposed solution can be integrated as well into different roasting methods as reported by Bagheri et al. [27] to simultaneously improve the organoleptic composition of the nut and still reduce the CO2 emissions by keeping a high system flexibility.
The presented scenario could be eventually improved by modelling all the other utilities installed onto the case study factory and their management to optimize the hybrid feeding requirements. Moreover, a detailed model of the thermodynamic hybrid system can be delineated to optimize the burner stage and electric pre-heater sizes according to their interaction dynamic.
The authors would like to thank VUORMAR Packaging s.r.l. for the information provided.
|
P_latent |
Latent Heat Power of Vaporization of moisture content, kW |
|
P_sensible |
Sensible Heat Power required for nut temperature increase, kW |
|
m ̇_product |
Product mass flow rate, kg. s-1 |
|
MC_in / out |
Moisture content of the product at the inlet / outlet of the process, % |
|
h_vaporization |
Vaporization latent heat of the water, kJ.kg-1 |
|
cp_product |
Product specific heat, kJ. kg-1. K-1 |
|
T_in / T_out |
Temperature of the product at the inlet / outlet of the process, K |
|
P_pre-heater |
Installed Pre-Heater electric power size, kW |
|
Gas_price |
Natural Gas Market Price, €. smc-1 |
|
LHV_NG |
Lower Heating Value of Natural Gas, kJ.kg-1 |
|
I_day |
Daily irradiation at the ground, kWh.m2-1 |
|
P_photovoltaic |
Considered Nominal Installed Photovoltaic power size, kW |
|
MVE |
Module Ventilation Efficiency Normalized % value, |
|
I_reference |
Reference irradiation at the ground, kW. m-2 |
|
Greek symbols |
|
|
$\eta$_burner, air product |
Heat transfer efficiency (burner to air, air to product) |
[1] International Nut & Dried Fruit Report. Inc Nuts & Dried Fruits Statistical Yearbook. https://inc.nutfruit.org/wp-content/uploads/2023/05/Statistical-Yearbook-2022-2023.pdf.
[2] Riggi, R., Modesti, M., Alfieri, G., Esposito, G., Cucchiara, P., Ferri, S., Bellincontro, A. (2025). Integration of destructive and non-destructive analytical determinations for evaluating quality of fresh and roasted hazelnuts subjected to different processing temperatures. Food Science & Nutrition, 13(3): e70095. https://doi.org/10.1002/fsn3.70095
[3] Mujumdar, A.S. (2006). Handbook of Industrial Drying. CRC Press. https://doi.org/10.1201/9781420017618
[4] https://www.almonds.com/sites/default/files/content/attachments/2014aq0008_hot_air_roasting_of_almond.pdf.
[5] https://vuormar.it/prodotto/jumbo/.
[6] https://www.meteo.fvg.it/archivio.php?ln=&p=dati.
[7] https://joint-research-centre.ec.europa.eu/photovoltaic-geographical-information-system-pvgis_en.
[8] Young, C.T., Schadel, W.E., Pattee, H.E., Sanders, T.H. (2004). The microstructure of almond (Prunus dulcis (Mill.) DA Webb cv.‘Nonpareil’) cotyledon. LWT-Food Science and Technology, 37(3): 317-322. https://doi.org/10.1016/j.lwt.2003.09.007
[9] Perren, R., Escher, F.E. (2013). Impact of roasting on nut quality. In Improving the Safety and Quality of Nuts, pp. 173-197. https://doi.org/10.1533/9780857097484.2.173
[10] Saklar, S., Katnas, S., Ungan, S. (2001). Determination of optimum hazelnut roasting conditions. International Journal of Food Science and Technology, 36(3): 271-281.
[11] Pedron, G., Jaouhari, Y., Bordiga, M. (2025). Conventional and innovative drying/roasting technologies: Effect on bioactive and sensorial profiles in nuts and nut-based products. Applied Sciences, 15(3): 1258. https://doi.org/10.3390/app15031258
[12] Luo, K.K., Chapman, D.M., Lerno, L.A., Huang, G., Mitchell, A.E. (2021). Influence of post‐harvest moisture on roasted almond shelf life and consumer acceptance. Journal of the Science of Food and Agriculture, 101(1): 139-150.
[13] Chilka, A.G., Ranade, V.V. (2018). Drying of almonds I: Single particle. Indian Chemical Engineer, 60(3): 232-254. https://doi.org/10.1080/00194506.2017.1333464
[14] Lin, J.T., Liu, S.C., Hu, C.C., Shyu, Y.S., Hsu, C.Y., Yang, D.J. (2016). Effects of roasting temperature and duration on fatty acid composition, phenolic composition, Maillard reaction degree and antioxidant attribute of almond (Prunus dulcis) kernel. Food Chemistry, 190: 520-528. https://doi.org/10.1016/j.foodchem.2015.06.004
[15] Taitano, L.Z., Singh, R.P. (2012). Moisture adsorption and thermodynamic properties of California grown almonds (varieties: Nonpareil and monterey). International Journal of Food Studies, 1(1): 61-75. https://doi.org/10.7455/ijfs/1.1.2012.a7
[16] Aydin, C. (2003). Physical properties of almond nut and kernel. Journal of Food Engineering, 60(3): 315-320. https://doi.org/10.1016/S0260-8774(03)00053-0
[17] Moran, M.J., Shapiro, H.N., Munson, B.R., DeWitt, D.P. (2002). Introduction to thermal systems engineering: Thermodynamics, fluid mechanics, and heat transfer. John Wiley & Sons.
[18] Eurostat, available online at: https://ec.europa.eu/eurostat/databrowser/view/nrg_pc_203__custom_9233040/default/table?lang=en accessed on 06/05/2025.
[19] https://www.ets.minambiente.it/ets2/News#48-pubblicazione-parametri-standard-nazionali-anno-2024-ets2.
[20] https://lssth.panasonic.com/products/energy/product_finder/img/solar002.pdf.
[21] UNI/TS 11300-1:2014, Prestazioni energetiche degli edifici - Parte 1: Determinazione del fabbisogno di energia termica dell'edificio per la climatizzazione estiva ed invernale, 2014
[22] https://www.gse.it/servizi-per-te/fotovoltaico/ritiro-dedicato/come-accedere.
[23] https://www.mercatoelettrico.org/.
[24] Miserocchi, L., Franco, A., Testi, D. (2023). An integrated framework for energy performance improvement in manufacturing: From mapping to optimization. Journal of Cleaner Production, 411: 137387. https://doi.org/10.1016/j.jclepro.2023.137387
[25] https://www.iea.org/data-and-statistics/data-tools/real-time-electricity-tracker?from=2024-4-7&to=2025-4-7&category=price.
[26] https://app.electricitymaps.com/map/72h/hourly.
[27] Bagheri, H. (2020). Application of infrared heating for roasting nuts. Journal of Food Quality, 2020(1): 8813047. https://doi.org/10.1155/2020/8813047