Qayssar Mahmood Ajaj![]() | Hafssa Ali Abdullah
| Hafssa Ali Abdullah![]() | Suzan Atta Bakr
| Suzan Atta Bakr![]() | Huda Jamal Jumaah*
| Huda Jamal Jumaah*![]()
© 2025 The authors. This article is published by IIETA and is licensed under the CC BY 4.0 license (http://creativecommons.org/licenses/by/4.0/).
OPEN ACCESS
The essential wetland ecosystem of Iraq, called Al-Dalmaj Marsh, has undergone major environmental changes due to natural and human sources of influence. Time-based monitoring of this ecosystem is vital for implementing sustainable management and conservation plans. Evaluation of water bodies along with land use/land cover changes is possible through satellite imagery from Sentinel-2_L2A. Landscape mapping in marshlands is achieved through the combination of Support Vector Machine (SVM), a supervised classification analysis, Normalized Difference Vegetation Index (NDVI) and Normalized Difference Water Index (NDWI) assessment methods. This study reveals substantial metamorphosis within Al-Dalmaj Marsh territory because of water management practices in the river source regions and natural climate phenomena and escalating agricultural operations, and urban growth. The finding revealed a decrease in water and vegetation in the study period. The decrease in water coverage happens most severely because of insufficient water inflows. Dynamic changes in the area of marsh waters become clear in classified maps. In 2017, the marsh recorded area was 190 km², but by 2020, it had expanded significantly to 270 km², representing a growth of approximately 42%. However, the amount of water area decreased significantly, by over fifty percent between 2020 and 2023, to just 125 km2. Between 2023 and 2025 change in surface area was 52%, falling to 60 km2. Water classification performed at a high accuracy with the user accuracy of 0.80, producer accuracy of 1.00, and a kappa coefficient of 0.88 in 2017. In 2023, the reliability of the classification was decreased; since the kappa was found to be 0.82, and only 9 new water pixels were identified in 2020, implying that water bodies were not expanding very much. The combination of remote sensing and GIS provides multiple benefits that lead to sustained monitoring at reasonable expenses and support officials in applying essential conservation practices promptly.
remote sensing, GIS, NDWI, NDVI, SVM, Sentinel-2_L2A, Al-Dalmaj Marsh
Wetlands throughout the world, including arid and semi-arid zones, encounter serious peril because of environmental change as well as human modifications and unwise land usage decisions [1, 2]. During the past few decades, Iraq has experienced substantial ecosystem deterioration throughout its historically diverse marshland territory, which includes historically diverse wetland systems [3]. Since the 2000s, research on Iraqi wetlands, especially the Mesopotamian Marshes, has increased, although it is still quite low in comparison to international levels [4]. The first analyses concerned the ecological degradation as a result of drainage and military effects [5, 6]. Newer literature focuses on earth observation through satellite, loss of biodiversity, and climate change impacts [7]. Nonetheless, coupled hydrological, ecological, and socio-political analyses remain very limited [8]. The interdisciplinary research is urgently needed to advise a sustainable approach to restoring and managing wetlands [9]. The Al-Dalmaj Marsh distinguishes itself as a vital water reservoir, along with being an essential hydrological and ecological system that shelters diverse species [10]. The extensive alterations in the marsh require ongoing evaluation and tracking through permanent monitoring to preserve its sustainability because of natural and human-caused modifications [11, 12].
Remote Sensing (RS) and Geographic Information Systems (GIS) have turned into essential tools that enable the assessment and analysis, along with temporal-spatial monitoring of wetland evolution [13-16]. Al-Dalmaj Marsh evolves based on domestic and ecological changes through multi-temporal satellite data analysis and spatial modeling using GIS applications for marsh management development [12, 17]. The seasonal Al-Dalmaj Marsh serves as a fundamental water reservoir in the center of Iraq to preserve biodiversity alongside consolidating regional hydrological mechanisms [18]. The marsh receives its water mainly from precipitation along with surface water that enters through adjacent rivers as its water source, while showing signs of fragility due to hydrological transformations [19]. Multiple environmental elements have reduced the size and caused damage to the marshland during various periods [20]. The Marshs suffer from degradation because of three essential causes, including extended dry periods, modified upstream water control, overdrawn subsurface water supplies, agricultural land expansion, and urban settlement advancement [21]. The decreasing marshlands create strong environmental impacts through reduced biodiversity and damaged habitats, and worsened water quality [22]. The patterns and quantities of time-period changes require analysis through both space and time using a spatial-temporal methodology [5].
The evaluation process of environmental resources becomes more efficient due to remote sensing technology applications on extensive scales [23-26]. Processing systems obtain crucial information through Landsat, Sentinel, and other satellite platforms to recognize changes in water bodies and observe vegetation patterns [27-31]. Scientists use trend mapping through GIS approaches to analyze change factors, thus enabling them to make predictions about marsh sustainability [32-34]. Previous data assessment provides researchers with the ability to perform environmental studies across time through remote sensing systems and historical data about present-day circumstances [5]. The development of effective policy decisions for wetland management depends on precise spatial and temporal data analysis methods, which should be utilized by decision-makers and conservationists [35, 36].
The analysis of remote sensing data becomes more precise when GIS technology utilizes its monitoring system to study wetlands [13, 37]. Scientists utilize GIS technology to obtain analytical tools that help identify environmental relationships that affect water areas [14, 15]. Through GIS tools, conservation planning receives support through generating thematic maps as well as performing spatial statistics while conducting suitability assessments [38]. The combination of remote sensing and GIS proves crucial for wetland conservation according to multiple scholarly studies [39-43].
Al-Dalmaj Marsh sustainability remains vital because it protects both its ecological system functions and provides necessary support to nearby communities that maintain their existence from agricultural activities and fishery industries, and access to freshwater from the wetland [19].
Wetlands degraded from improper management lead to major socio-economic problems by reducing crop output and causing abandonment of local resource-based economies, and producing increased risk from environmental events [44]. Decision-makers implement remote sensing with GIS systems to create strategic planning of unstable areas restoration programs, which improves water resource operations and moves toward sustainable land use systems [3, 45]. Real-time data monitoring enabling strategic improvements of management techniques [46].
The past studies conducted on Al-Dalmaj Marsh were also restricted to the poor resolution of image usage, and there was no temporal monitoring, due to which the changes to be observed are long-term or seasonal. Most of the previous studies failed to couple several indices, such as NDVI and NDWI, and use more superior classification methods, such as SVM, which decreases the adequacy of land cover evaluations. Moreover, the influence of the upstream water management policies and the local human impact traditionally remained ignored. The mapping of dynamic vegetation health with water bodies has not received the requisite focus either.
The article gives coverage to these shortcomings since it presents the integrated indices and high-resolution Sentinel-2 images with machine learning classification. The objective of this investigation entails tracking temporal and spatial developments of Al-Dalmaj Marsh in Iraq through remote sensing and GIS analyses to support environmental conservation. The study uses SVM, NDWI, alongside NDVI to evaluate water body and vegetation cover transformations across different periods of time.
The research demonstrates the immediate necessity to implement sustainable water policies and ecological programs for marsh restoration to control ongoing degradation.
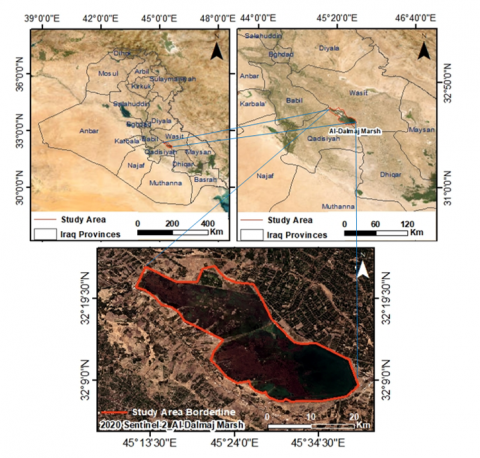
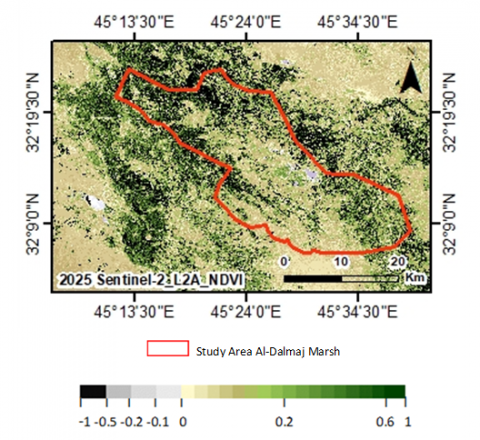
Al-Dalamj Marsh occupies an area that spans from latitudes 31°49' to 32°38' N and longitudes 44°56' to 45°44' E in the southwestern parts of Wasit Governorate and eastern and southeastern regions of Al-Diwaniyah Governorate [20]. Figure 1 shows the study area of Al-Dalmaj Marsh in Iraq.
Figure 1. Study area of Al-Dalmaj Marsh in Iraq
This water reservoir exists officially between Wasit Province and Al-Qadisiyah Province. This area incorporates both ponds and shallow water areas, which remain shallower than one meter deep.
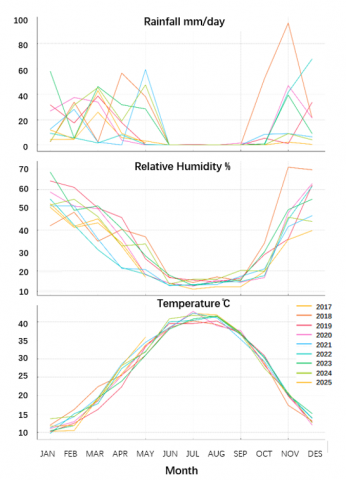
Fluidity in Dalmaj Marsh water level emerges because the Ministry of Water Resources regulates the main estuary's flow, while the lake depends on rainfall for water supply [10]. Climate and hydrological statistics in the study region have been downloaded from an online source via the NASA/POWER Application. In order to analyze the changes, monthly and annual climate and hydrological data from 01/07/2017 to 30/05/2025 were introduced as a chart in Figure 2. The location of the dataset is determined on the map as Latitude 32.149, and Longitude 45.612 inside the marsh area. Al-Dalmaj Marsh demonstrates explicit seasonality, and the highest extent of water coverage in the marsh is usually observed in spring when the rainfall and upstream flow are higher.
Water levels go down drastically during the summer and early fall, revealing much of the marsh. Such seasonal variation exerts influence on the availability of habitat, biodiversity, and the general ecological dynamics of the wetland.
Iraq's wetlands require immediate adoption of innovative monitoring methods because they face ongoing environmental risks that demand an enhanced understanding of marshland transformations.
The development of sustainable environmental practices in Al-Dalmaj needs strategic cooperation from government institutions, as well as environmental protection agencies and residential communities in the region. The assessment of Al-Dalmaj Marsh spatiotemporal modifications through remote sensing technologies and GIS systems remains vital for preserving the area's environmental resources. Al-Dalmaj Marsh can benefit significantly from GIS through its ability to establish wetland boundaries alongside land use change assessment and forecasting different management outcomes.
Figure 2. Climate and hydrological statistics in study region
The study methodology is based on using Sentinel-2 satellite images with mapping classifications of the study area based on several indices, such as NDWI and NDVI, using artificial intelligence. In addition to using the SVM classification process in ArcGIS software.
3.1 Data collection and technical roadmap
We based on high-resolution Sentinel-2 images of 10 m with a datum of WGS-1984. Four sensing dates have been distinguished within the examined images of Sentinel-2 with the lowest cloud cover rate, as shown in the table below. Table 1 represents the Al-Dalmaj Marsh datasets. The study technical roadmap is shown in Figure 3.
Table 1. Al-Dalmaj Marsh datasets
|
Source |
Date |
Cloud |
Resolution |
Datum |
|
Sentinel-2 |
05/11/2017 |
0.095 |
10 m |
WGS-84 |
|
Sentinel-2 |
13/02/2020 |
0.006 |
10 m |
WGS-84 |
|
Sentinel-2 |
20/10/2023 |
0.058 |
10 m |
WGS-84 |
|
Sentinel-2 |
11/02/2025 |
0.922 |
10 m |
WGS-84 |
Figure 3. The study technical roadmap
3.2 Data processing
The combination of geographic information systems and corresponding technologies has become more prevalent in Iraq to evaluate ongoing environmental transformations in marshland areas resulting from mismanaged water resources and Geopolitical disputes. Remote sensing technology proved successful in measuring changes in water levels and vegetation health, and land cover alterations, as established by previous Mesopotamian marshes studies. The establishment of an advanced monitoring system for Al-Dalmaj Marsh needs similar analysis methods to analyze natural and human-triggered environmental interactions.
The proper monitoring of spatial and temporal changes in Al-Dalmaj Marsh serves to understand the environmental sustainability of this delicate ecosystem. Analysis of the marshland based on independent and human-caused factors makes use of Sentinel-2 satellite data combined with NDWI and NDVI indices and SVM classification techniques.
Sentinel-2 image preprocessing functions as a necessary step that leads to improved analysis accuracy. The principal objective of image enhancement involves processing specific images to create outputs that better fulfill designated application requirements as opposed to raw image content [47]. The European Space Agency (ESA) provides Level-1C Top of Atmosphere (TOA) reflectance images that undergo radiometric and atmospheric corrections through the implementation of the Sen2Cor processor to generate Bottom of Atmosphere (BOA) reflectance results. The preprocessing ensures both georeferencing the images to WGS 84 / UTM Zone 38N and executing cloud masking to remove atmospheric effects.
The Scene Classification Layer (SCL) included in the Level-2A product is used to conduct the cloud masking. It distinguishes clouds, cloud shadows, and cirrus with the help of predefined classes, giving the possibility of excluding affected pixels. Such an action increases the reliability of classification by correcting unclear surfaces of land or water analyzed.
Surface water extent changes can be assessed through the implementation of the Normalized Difference Water Index (NDWI). The NDWI requires two types of data from Sentinel-2 imagery:
$N D W I=\frac{(B 03-B 08)}{(B 03+B 08)}$ (1)
where, B03 represents the green band and B08 the near-infrared band.
The applied thresholding method differentiates water areas from other regions through its classification process with a dark blue color.
NDVI requires two sensors to evaluate vegetation health and coverage through the following formula:
$N D V I=\frac{(B 08-B 04)}{(B 08+B 04)}$ (2)
The analysis depends on two spectral bands: B08 signifies the Near-Infrared spectrum, while B4 reflects the red spectrum. The density of vegetation corresponds with higher NDVI values, whereas sparser vegetation causes lower values. NDVI time-series analysis shows vegetation growth patterns as well as stress indicators and decline indicators that link to water accessibility, while showing the effects of present land usage practices.
Support Vector Machine (SVM) serves as the method to classify land cover because it performs supervised machine learning on various surface types such as water bodies, vegetation, bare soil, and urbanized areas.
In this study, we relied on the GIS-based Train Support Vector Machine Classifier from the Segmentation and Classification tool of the GIS toolbox. Al-Dalmaj Marsh was classified using two major classes, water and non-water areas, as the SVM classification. The samples to be used in training were directly chosen out of the satellite imagery, and the water samples were taken out of the bright green areas on the photos that clearly indicated open water, whereas the non-water samples were taken in the surrounding vegetation, bare soil, and other areas. The classification was to maximize the separability of the two classes, and sufficient representative pixels of both classes were used as the number of training samples to accomplish accurate water-non-water discrimination.
A performance evaluation of the SVM classifier depends on the kappa coefficient and overall accuracy metrics. The equation of SVM can be reported as:
$f(x)=\operatorname{sign}\left(\sum_i^r \propto_i y_i k\left(x, x_i\right)+b\right)$ (3)
To represent each of the $r$ training cases with their class description $\left(y_i\right)$ the spectral response uses the vector $\left(x_i\right)$. This spectral response includes Lagrange multipliers $\propto_i(i=1-r)$ as well as the kernel's item $k\left(x, x_i\right)$ and the value ($b$) indicates the distance between the beginning point and the hyperplane space.
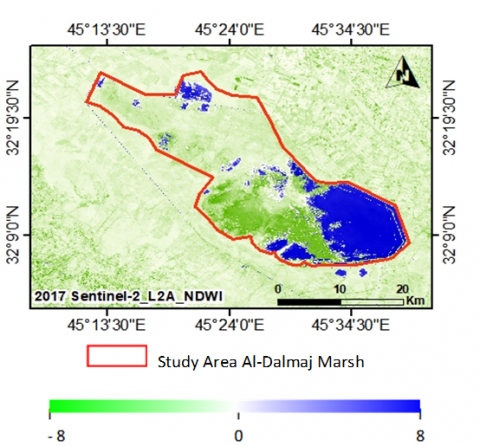
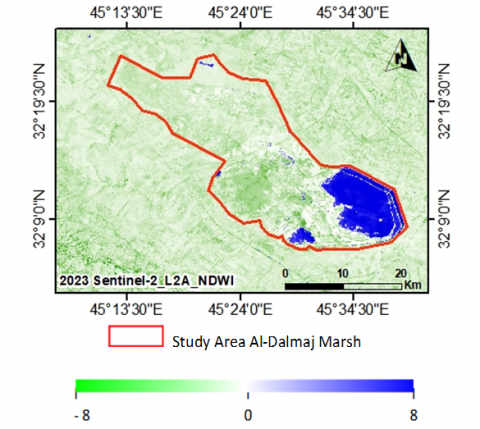
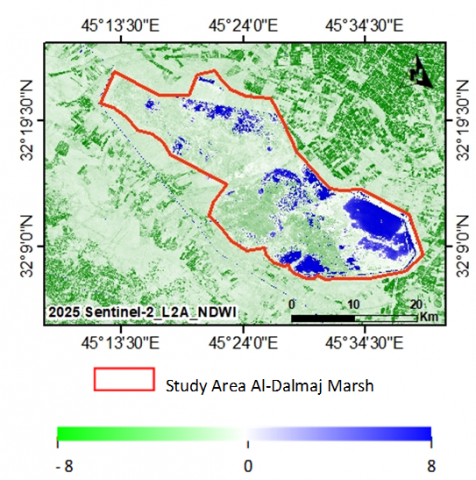
NDWI maps of Al-Dalmaj Marsh for four different periods, 2017, 2020, 2023, and 2025, were mapped as shown in Figure 4. The Sentinel-2 imagery provides fundamental data for creating maps that show how water is distributed throughout the marsh area over successive time intervals.
Observations from the NDWI maps in water areas in Al-Dalmaj Marsh appear limited in 2017 (Figure 4(a)) because extensive portions of the marsh territory exhibit low NDWI values, while blue areas representing water remain small and clustered in particular sections.
(a) 2017 Map
(b) 2020 Map
(c) 2023 Map
(d) 2025 Map
Figure 4. NDWI maps of Al-Dalmaj Marsh
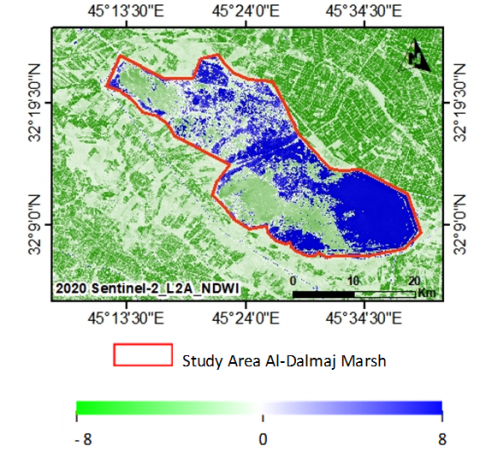
The area of water distribution in Figure 4(b) of 2020 has experienced a considerable expansion compared to the previous year. The wide areas with high NDWI values in the marsh reflect either better water availability or seasonal changes.
The water extent observed in Figure 4(c) of 2023 shows lower coverage when compared to Figure 4(b) of 2020. The measured NDWI values show a decrease in water extent, which can be explained by climatic factors or changes in inflow, or human-caused disturbances.
The water-covered area persists at a reduced level during the period of 2025 (Figure 4(d)), just like in 2023. The decreasing water availability presented through this trend points toward natural environmental conditions or poor water management practices in that region.
The analysis reveals that 2020 was the year the marsh reached maximum water coverage, which then decreased in 2023 and further reduced again in 2025.
Yearly declines of NDWI values suggest one or more obstacles, including lower water supply, and both climate change effects and human disturbances in the ecosystem.
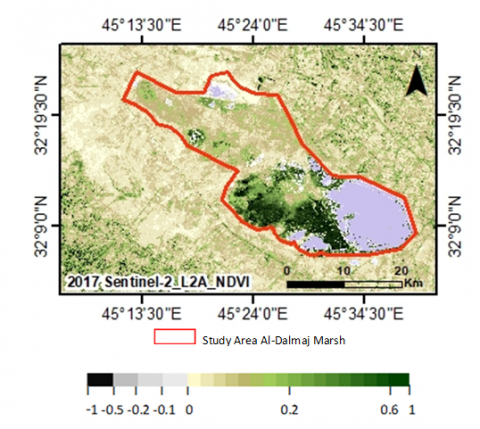
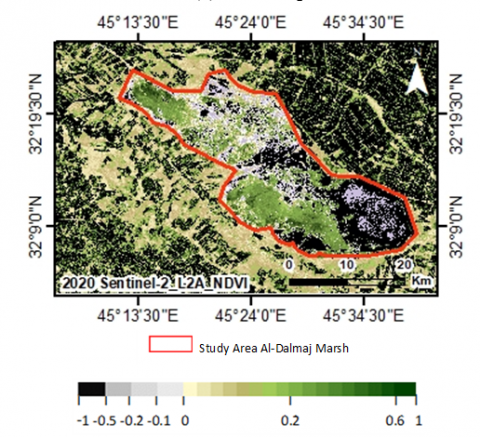
Figure 5 presents the shifting of Al-Dalmaj Marsh NDVI maps across the years from 2017 to 2020, 2023, and 2025. NDVI serves as a vital marker for vegetative health because it shows that higher NDVI values of green shaded areas (0.2 to 1.0) indicate healthy vegetation. Pixels show bare soil and water together with broken vegetation areas when their values fall within the yellow and brown color spectrum (-1.5 to 0.1).
A limited vegetation area extends from the marsh borders to the surrounding green regions (Figure 5(a) of 2017).
The NDVI values indicate unhealthy vegetation conditions as well as sparse vegetation across most of the observed areas.
The year 2020 (Figure 5(b)) shows noticeable vegetation expansion.
High concentrations of dark green colors indicate that vegetation has become healthier within the analyzed area, which might be caused by suitable environmental conditions and better access to water resources.
Multiple dark areas on the map depict high-density vegetation located between elevated and low-elevation areas.
The analysis from Figure 5(c) displays decreased vegetation in 2023. Certain regions that displayed vegetation growth in 2020 show decreased green areas. The possible sources of this change include drought events, together with land deterioration and depleted water levels.
(a) 2017 Map
(b) 2020 Map
(c) 2023 Map
(d) 2025 Map
Figure 5. NDVI maps of Al-Dalmaj Marsh
The data from Figure 5(d) shows additional vegetation reduction in 2025. Numerous sections of the ground exhibit brown/yellow coloration, suggesting that the vegetation is suffering stress or has been entirely lost.
Environmental changes and incorrect management of water resources, combined with human activities including land use expansion, reduce vegetation cover at the location.
Water extent patterns that researchers observed correspond to the effects of political water disputes and environmental climate changes in the region [6, 17]. Based on study [8], water resource management or conservation initiatives during 2025 might have helped stabilize the marsh's hydrological equilibrium based on the slight enhancement in water extent measurements. Current trends support sustained surveillance and environmentally sustainable managerial practices to maintain the region [15].
A high point of vegetation cover occurred during 2020, yet it steadily decreased from 2023 through 2025. The decline of NDVI matches the reduction of water detected in the marsh through the NDWI maps.
In the case of NDWI, the threshold of zero is usually used to categorize the water bodies, as the positive values of the threshold are typically associated with the presence of water, whereas the negative values are associated with vegetation or soil. Conversely, NDVI values near zero or negative are associated with bare land and water, whereas the values above 0.2 are usually associated with vegetation cover. In Al-Dalmaj Marsh maps, NDWI indicates the presence of open water in blue, and NDVI distinguishes the vegetation and the non-vegetated surfaces, which are green in color. GIS mapping has been used in presenting NDWI and NDVI maps. The threshold was also visually analysed based on satellite images. NDWI > 0 is used to identify water areas with the help of the clear spectral gap, whereas NDVI > 0.2 represents healthy vegetation. This is a sure way of classifying the dynamics of the marsh over time.
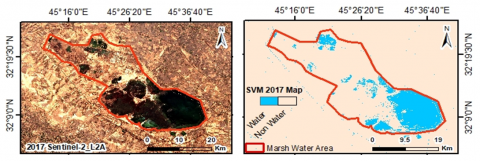
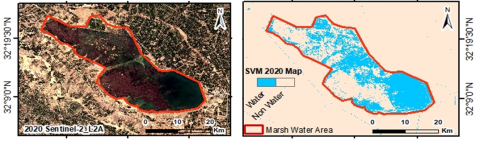
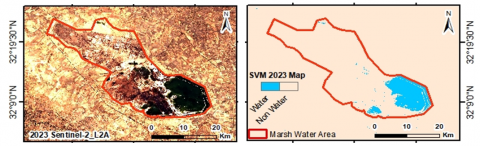
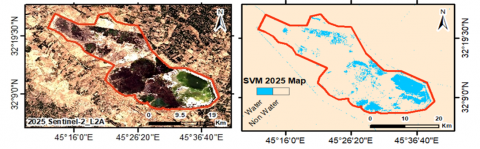
Table 2 represents SVM classification results. Figure 6 represents the SVM map of Al-Dalmaj Marsh.
The area has been classified into water area and non-water area. The results indicated the same NDWI and NDVI results of Water reduction from the year 2020 to 2025.
Table 2. SVM classification results of Al-Dalmaj Marsh
|
No. |
Year |
Area km2 |
Change Rate % |
|
1 |
-2017 |
190 |
_ |
|
2 |
2017-2020 |
270 |
+42 |
|
3 |
2020-2023 |
125 |
-54 |
|
4 |
2023-2025 |
60 |
-52 |
|
5 |
2017-2025 |
60 |
-68 |
Based on the SVM classification results in Table 2, the water area of Al-Dalmaj Marsh has shown considerable variations and an affected long-term decline between 2017 and 2025.
In 2017, the marsh recorded area stood at 190 km2, but by 2020 it had expanded significantly to 270 km2, representing a growth of approximately 42%. Such a temporary increase can be attributed to increased rainfall or better inflows. The growth was not sustainable, however, and the amount of water area decreased significantly, by over fifty percent between 2020 and 2023, to just 125 km2. This is a drastic cut of up to 54%, which demonstrates high susceptibility of the marsh to low precipitation, water demand, and potential lack of management of water inflows. The negative slope was not the end as the lake lost another 52% of its surface area between 2023 and 2025, falling down to 60 km2. Such ongoing shrinkage unveils a picture of the growing water shortage and environmental stress, which is probably due to regional drought, climate change, and elevated levels of water pumping into agriculture and domestic use. Considering the whole time frame of 2017 to 2025, Al-Dalmaj Marsh had lost approximately 68 percent of its water territory, which highlights the gravity of the water resources problem in Iraq. The change shows the rate at which a water body may fluctuate between growth and extreme contraction and highlights the necessity of sustainable water management policies and conservation policies.
(a) 2017 Map
(b) 2020 Map
(c) 2023 Map
(d) 2025 Map
Figure 6. SVM maps of Al-Dalmaj Marsh
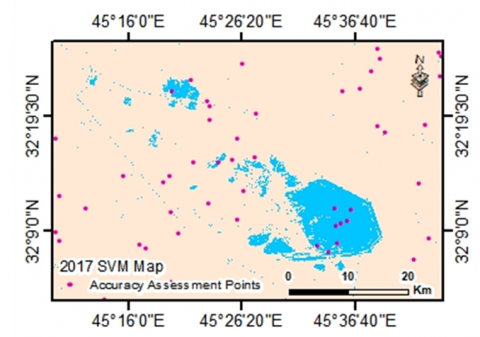
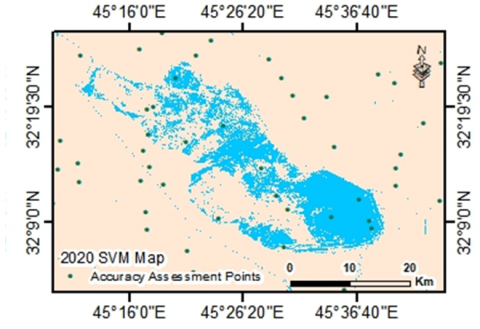
An accuracy assessment has been applied to two maps of SVM 2017 and 2020 based on available data used from Google Earth Engine. The analysis of the assessment resulted in Table 3.
This table delivers accuracy metrics through User-Accuracy (U-A) and Producer-Accuracy (P-A) values to measure water and non-water categorizations at Al-Dalmaj Marsh in the years 2017 and 2020.
Table 3. Accuracy assessment results of Al-Dalmaj Marsh
|
2017 |
Class |
Water |
Non-Water |
Total |
U-A |
|
Water |
8 |
2 |
10 |
0.80 |
|
|
Non-Water |
0 |
96 |
96 |
1.00 |
|
|
Total |
8 |
98 |
106 |
0.00 |
|
|
P-A |
1 |
98 |
0 |
0.98 |
|
|
2020 |
Water |
8 |
2 |
10 |
0.80 |
|
Non-Water |
1 |
89 |
90 |
0.99 |
|
|
Total |
9 |
91 |
100 |
0.00 |
|
|
P-A |
0.89 |
0.98 |
0 |
0.97 |
(a) 2017 Accuracy points
(b) 2020 Accuracy points
Figure 7. Accuracy assessment maps of Al-Dalmaj Marsh
U-A stands for the level of reliability that pixel classifications demonstrate. High U-A indicates that most of the areas classified as water or non-water have correct assignments. Lower U-A values represent incorrect classification since assigned pixels stem from different classes. The classification of reference (ground truth) pixels reflects the accuracy level measured by P-A. A high P-A value points to the correct identification of most pixels between water and non-water categories. A lower P-A value demonstrates that both classification mistakes exist simultaneously (water pixels classified as non-water and non-water pixels classified as water). Figure 7 shows the accuracy assessment maps of Al-Dalmaj Marsh in 2017 and 2020.
In the 2017 water classification class, the accuracy rate for categorizing water pixels measured 80% (U-Accuracy = 0.80). All water pixels in the reference data received perfect classification accuracy of 100%. The classifier failed to identify any water areas (high P-Accuracy) even though it identified 20% of pixels incorrectly identified as water or non-water, thus triggering gentle overestimation. While in the 2017 non-water classification class, the accuracy rate for non-water pixels demonstrated perfect results because every pixel correctly identified as non-water turned out to be genuine non-water space (U-Accuracy = 1.00; 100%). The reference non-water pixels received correct classification at a rate of 98%. Non-water area classification proved reliable since only minor mistakes occurred during the analysis.
In the 2020 water classification class, the categories assigned to water features showed 80% accuracy 2020 just like 2017, with similar water and non-water misclassifications. The pixels that correctly matched water features reached a rate of 89% (P-Accuracy = 0.89). A higher number of omission errors emerged relative to 2017, which resulted in classifying actual water areas as non-water, thus creating a minimal underestimation of water bodies. While in the 2020 non-water classification class, the measurements confirmed high accuracy because U-Accuracy achieved 0.99 (99%), which proved that almost all identified non-water pixels were correct. The classification performance was similar to 2017 because P-Accuracy reached 0.98, which corresponds to 98% accuracy. The classification precision for non-water regions remained very high, thus demonstrating high reliability.
The P-Accuracy fell from 100% in 2017 to 89% during 2020, leading to the classification of correct water pixels as non-water. Reduced water coverage, together with expanding vegetation and wetland areas, potentially contributed to water classification issues. The assessment of non-water regions maintained exceptional accuracy through U-Accuracy results, which remained higher than 98%. The analysis of non-water areas demonstrated high consistency through a P-Accuracy of 98%. The decrease in water features observed in SVM maps can adversely impact classification precision because it could be due to natural or human-caused water level fluctuations. The classification between water and vegetated surfaces might become inaccurate because of vegetation growth within wetland areas. The Kappa values were 0.88 and 0.82 for 2017 and 2020, respectively.
Through the confusion matrices and accuracy values associated with 2017 and 2020, a comparative analysis is the classification accuracy of the two years (2017 and 2020) was high, whereas the user accuracy (U-A) of water was constant, that is, 0.80. The accuracy of producer (P-A) of water reduced, however, from 1.00 in 2017 variables to 0.89 in 2020, meaning that there were increased omission errors in 2020. This can be due to hydrological changes or due to less obvious water features in 2020 imagery. Non-water classification was, however, exceedingly precise during both years. In general, there was a slight improvement in the classification performance with higher quality of images and hydrological clarity in 2017.
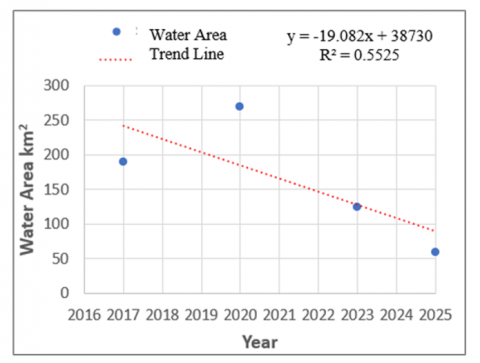
Moreover, Figure 8 represents the linear trend analysis of Al-Dalmaj Marsh. The trend also indicates a decreasing tendency of water area between 2020 and 2025. The curve of the water area R2 of Al-Dalmaj Marsh in the period between 2017 and 2025 has a value of about 0.55. This implies that the linear increase in time explains approximately 55 percent of the change in water area. The R2 value (0.55) shows a weak to moderate correlation between the independent and the dependent variable, i.e., only 55% of the variance in the dependent variable is explained by the model. The potential explanation behind a low R2 (0.55), in environmental research as in wetland research, values this low are usually prevalent because nature is so complicated.
Figure 8. Water area trend in Al-Dalmaj Marsh (2017-2025)
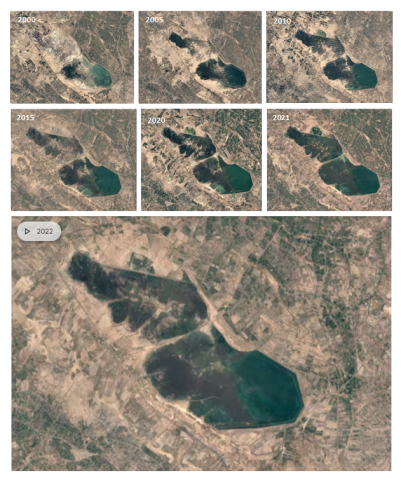
Figure 9. Temporal changes of Al-Dalmaj Marsh on Google Earth Map
Figure 9 was presented as temporal changes of Al-Dalmaj Marsh on the Google Earth Map.
The environmental and economic welfare of Al-Dalmaj Marsh suffers negatively because of reduced water levels and vegetative growth. The decrease in water levels creates a fragmented environment for aquatic species, together with migratory birds and wetland vegetation, leading to biodiversity decline. The reduction of water, along with vegetation in the marsh, harms many breeding and feeding bird species that keep the ecological balance stable. Fish residents require stable water levels to survive, so their numbers will decline, affecting area wildlife, together with fisheries in that region.
The foundation of stable soil and erosion protection, which roots offer, becomes weakened when plant vegetation completely disappears. A deficiency of plant life leaves the marsh exposed to desertification, which weakens its ability to sustain various ecosystems. The removal of vegetation prevents water quality from getting better since it reduces the water filtration ability and increases greenhouse gas emissions.
The economic consequences remain severe because marshlands provide both commercial fishing opportunities as well as agricultural activities and tourism revenue. A decline in water resources restricts farming output, which compels populations to either find new income sources or relocate. Wetland vegetation removal makes surrounding regions more exposed to severe weather hazards by impeding their natural flood regulatory capabilities.
The challenge of observing Al-Dalmaj Marsh stems from its dynamic wetland ecosystem because it responds to seasonal and extended climatic changes. Significant spatial along temporal changes in the marsh require researchers to adopt multi-temporal analysis methods across different time scales. Scientists obtain important information on wetland size transformations through analysis of remote sensing time series data. Complete explanations regarding marsh system deterioration processes emerge when climate factors join hydrological modeling and socio-economic data analyzed through GIS-based applications. Multiple disciplines working together enable scientists to make practical conservation strategies by uniting natural and human development requirements.
The combination of remote sensing technology with GIS enables researchers to gain essential perspectives about how Al-Dalmaj Marsh has evolved in space and time. Using NDWI and NDVI along with SVM classification methods yielded results showing that marsh water surface dimensions remained remarkably reduced in 2017, yet they slightly recovered by 2020. The research found that in 2017, the area of the water bodies reached approximately 190 km2, thus a high proportion of the water decreased (68 percent) until 2025. The analysis was conducted on NDVI and revealed the pronounced seasonal trend, where the vegetation indices were high in months when the plants were actively growing spring period. The classification accuracy was higher in 2017 because the images were clearer, and the hydrological conditions were stable. The time-path analysis revealed that the water area decreased between 2020 and 2025.
These results stress the high correlation between indicators of remote sensing and the hydrological dynamics of the marshlands.
The classification analysis confirms the research findings through accuracy testing. The water classification in 2017 demonstrated a user's accuracy rate of 0.80, combined with a producer’s accuracy rating of 1.00, which signifies accurate water detection with minimal wrong classifications. The classification agreement displayed strong results through a kappa coefficient of 0.88. In 2020, the water body showed small growth through the classification of 9 water pixels. The marsh revealed signs of susceptibility to hydrological changes together with poor water resource management, as the water body reduced from 2020 to 2025. Classification reliability weakened due to increased land cover transitions because the kappa coefficient dropped to 0.82.
Using remote sensing technology with GIS and classification methods produces beneficial research to monitor wetland ecosystems effectively. Sustainable water resource policies for protecting the Al-Dalmaj Marsh from degradation will become more effective through the data obtained from this study, as well as through the work of policymakers and environmental managers.
Predictive models built from hydrological and climate data will aid in forecasting changes in order to develop strategies for sustainable marsh management. The upstream water resource management needs government control for maintaining stable marsh hydrology by distributing water in a fair manner. Observational programs make use of Sentinel-2 along with other satellite imagery services to provide ongoing early detection of signs related to marsh deterioration.
To reduce seasonal and long-term water loss in the Al-Dalmaj Marsh, it is also advisable that the government reinforce management of water resources in the marsh. The introduction of a long-term monitoring system in the framework of remote sensing would allow monitoring the hydrological and ecological transformations on a continuous basis.
A sustainable water allocation policy that favors biodiversity as well as the livelihoods of the locals should be put in place. The accuracy of decision-making can be increased with the help of ground observations to supplement image-based monitoring. Lastly, there is a need for cross-sector cooperation so as to achieve integrated management and adjustable strategies of the wetlands.
|
B03 |
Band three / Green Spectrum |
|
B04 |
Band four / Red Spectrum |
|
B08 |
Band eight / Near-Infrared Spectrum |
|
BOA |
Bottom of Atmosphere |
|
ESA |
European Space Agency |
|
GIS |
Geographic Information Systems |
|
NDVI |
Normalized Difference Vegetation Index |
|
NDWI |
Normalized Difference Water Index |
|
NIR |
Near-Infrared |
|
P-A |
Producer-Accuracy |
|
RS |
Remote Sensing |
|
SCL |
Scene Classification Layer |
|
SVM |
Support Vector Machine |
|
TOA |
Top of Atmosphere |
|
U-A |
User-Accuracy |
|
UTM |
Universal Transverse Mercator |
|
WGS-84 |
World Geodetic System - 1984 |
|
Mathematical symbols |
|
|
b |
Hyperplane space from start points |
|
$\propto_{\mathrm{i}}(i=1$ to $r)$ |
Lagrange multipliers |
|
k(x, xᵢ) |
Kernel's item |
|
r |
Training cases |
|
xi |
Vector |
|
yi |
Class description |
[1] Newson, M. (2008). Land, Water and Development: Sustainable and Adaptive Management of Rivers. (1st ed.) Routledge. https://doi.org/10.4324/9780203891919
[2] Chikomo, T. (2014). Community perceptions of environmental indicators for management of wetland important bird areas in Kenya (Doctoral dissertation). The University of Nairobi, Kenya.
[3] Mahmood, M.R., Abrahem, B.I., Jumaah, H.J., Alalwan, H.A., Mohammed, M.M. (2025). Drought monitoring of large lakes in Iraq using remote sensing images and normalized difference water index (NDWI). Results in Engineering, 25: 103854. https://doi.org/10.1016/j.rineng.2024.103854
[4] Farajzadeh, M., Khalid, N.J. (2023). Analysis of anthropogenic and climate change effects on Mesopotamian marshland-Iraq. Sustainable Earth Review, 3(2).
[5] Jumaah, H.J., Kalantar, B., Ueda, N., Sani, O.S., Ajaj, Q.M., Jumaah, S.J. (2021). The Effect of war on land use dynamics in Mosul Iraq using remote sensing and GIS techniques. In 2021 IEEE International Geoscience and Remote Sensing Symposium IGARSS, Brussels, Belgium, pp. 6476-6479. https://doi.org/10.1109/IGARSS47720.2021.9553165
[6] Eltaif, N.I., Gharaibeh, M.A., Fadhil Al-Quraishi, A.M. (2024). Impact of climate change on Iraq: Severe water scarcity and desertification. In Climate Change and Environmental Degradation in the MENA Region, pp. 279-303. https://doi.org/10.1007/698_2024_1100
[7] Wegler, M., Kuenzer, C. (2024). Potential of earth observation to assess the impact of climate change and extreme weather events in temperate forests—A review. Remote Sensing, 16(12): 2224. https://doi.org/10.3390/rs16122224
[8] Ndaka, F.E. (2025). A comprehensive survey on the natural resources of Iraq: Insight into possible regional development. Knowledge-Based Engineering and Sciences, 6(1): 38-63. https://doi.org/10.51526/kbes.2025.6.1.38-63
[9] Watson, C.J., Mazzei, R., Bourgeois, B., Smedbol, É., et al. (2024). Towards sustainable agricultural landscapes: Lessons from an interdisciplinary research-based framework applied to the Saint Lawrence floodplain. Basic and Applied Ecology, 80: 11-22. https://doi.org/10.1016/j.baae.2024.07.005
[10] Jabbar, S.N., Alasady, R.K.A. (2024). Assessment of water quality of the marsh of Dalmaj based on some physico-chemical parameters. IOP Conference Series: Earth and Environmental Science, 1371(2): 022015. https://doi.org/10.1088/1755-1315/1371/2/022015
[11] Murad, F.N., Yousif, S.A.R., Abojassim, A.A. (2024). Geological environmental study of Al-Dalmaj marsh area. International Journal of Geography, Geology and Environment 6(2): 138-145.
[12] Awad, A., Kadhum, S.A., Ishak, M.Y., Hathal, M.M., Hussein, H.M. (2023). Identifying hotspots of endangered wetland bird in the Marsh Al-Dalmaj/Iraq. https://doi.org/10.21203/rs.3.rs-3202170/v1
[13] Ameen, M.H., Jumaah, H.J., Khursheed, N.K. (2025). An analysis of hydrologic dynamics in Hamrin Lake, Iraq using remote sensing and GIS techniques. DYSONA-Applied Science, 6(1): 96-103. http://doi.org/10.30493/DAS.2024.478002
[14] Ghanbari, A., Jumaah, H.J. (2024). Monitoring surface water area changes of Najaf Sea in Iraq using RS and GIS for sustainable development. Advanced Engineering Days, 9: 323-325.
[15] Jumaah, H.J., Ameen, M.H., Kalantar, B. (2023). Surface water changes and water depletion of Lake Hamrin, Eastern Iraq, using Sentinel-2 images and geographic information systems. Advances in Environmental and Engineering Research, 4(1): 1-11. http://doi.org/10.21926/aeer.2301006
[16] Jumaah, H.J., Ameen, M.H., Mohamed, G.H., Ajaj, Q.M. (2022). Monitoring and evaluation Al-Razzaza lake changes in Iraq using GIS and remote sensing technology. The Egyptian Journal of Remote Sensing and Space Science, 25(1): 313-321. https://doi.org/10.1016/j.ejrs.2022.01.013
[17] Abed, S.A. (2014). Bio-ecological study of marbled teal Marmaronetta angustirostris in Hor Al-Dalmaj/Iraq. Doctoral dissertation, University of Baghdad.
[18] Al-Zaidy, K.J., Parisi, G., Abed, S.A., Salim, M.A. (2019). Classification of the key functional diversity of the marshes of southern Iraq marshes. Journal of Physics: Conference Series, 1294: 072021. https://doi.org/10.1088/1742-6596/1294/7/072021
[19] Salman, H.H., Jumaah, G.F. (2023). A plane of an integrated management of Al-Dalamj marsh. AIP Conference Proceedings, 2977: 040042. https://doi.org/10.1063/5.0182266
[20] Al-Jasimee, A.S., Hussein, H.M. (2023). Estimation of some heavy metals in the Dalmaj Marsh Water, Al-Diwaniya City, Iraq. Magazine of Al-Kufa University for Biology, 15(3): 147-154. https://doi.org/10.36320/ajb/v15.i3.12691
[21] Al-Azzawi, S.N. (2016). The deterioration of environmental and life quality parameters in Iraq since the 2003 American occupation of Iraq. International Journal of Contemporary Iraqi Studies, 10(1-2): 53-72. https://doi.org/10.1386/ijcis.10.1-2.53_1
[22] Fuller, M.R., Doyle, M.W., Strayer, D.L. (2015). Causes and consequences of habitat fragmentation in river networks. Annals of the New York Academy of Sciences, 1355(1): 31-51. https://doi.org/10.1111/nyas.12853
[23] Jiao, Z. (2024). The application of remote sensing techniques in ecological environment monitoring. Highlights in Science, Engineering and Technology, 81: 449-455.
[24] Sharma, S., Beslity, J.O., Rustad, L., Shelby, L.J., Manos, P.T., Khanal, P., Khanal, C. (2024). Remote sensing and GIS in natural resource management: Comparing tools and emphasizing the importance of in-situ data. Remote Sensing, 16(22): 4161. https://doi.org/10.3390/rs16224161
[25] Jamal Jumaah, H., Ghassan Abdo, H., Habeeb Hamed, H., Mohammed Obaid, H., Almohamad, H., Abdullah Al Dughairi, A., Saleh Alzaaq, M. (2023). Assessment of corona virus (COVID-19) infection spread pattern in Iraq using GIS and RS techniques. Cogent Social Sciences, 9(2): 2282706. https://doi.org/10.1080/23311886.2023.2282706
[26] Miller, R.B., Small, C. (2003). Cities from space: Potential applications of remote sensing in urban environmental research and policy. Environmental Science & Policy, 6(2): 129-137. https://doi.org/10.1016/S1462-9011(03)00002-9
[27] Wahla, S.S., Kazmi, J.H., Tariq, A. (2025). Mapping and monitoring of spatio-temporal land use and land cover changes and relationship with normalized satellite indices and driving factors. Geology, Ecology, and Landscapes, 9(1): 279-295. https://doi.org/10.1080/24749508.2023.2187567
[28] Jumaah, H.J., Rashid, A.A., Saleh, S.A.R., Jumaah, S.J. (2024). Deep neural remote sensing and sentinel-2 satellite image processing of Kirkuk City, Iraq for sustainable prospective. Journal of Optics and Photonics Research, 2(3): 172-180. https://doi.org/10.47852/bonviewJOPR42022920
[29] Cai, Y., Shi, Q., Liu, X. (2024). Spatiotemporal mapping of surface water using Landsat images and spectral mixture analysis on Google Earth Engine. Journal of Remote Sensing, 4: 0117. https://doi.org/10.34133/remotesensing.0117
[30] Bhaga, T.D., Dube, T., Shekede, M.D., Shoko, C. (2023). Investigating the effectiveness of Landsat-8 OLI and Sentinel-2 MSI satellite data in monitoring the effects of drought on surface water resources in the Western Cape Province, South Africa. Remote Sensing Applications: Society and Environment, 32: 101037. https://doi.org/10.1016/j.rsase.2023.101037
[31] Ogilvie, A., Poussin, J.C., Bader, J.C., Bayo, F., Bodian, A., Dacosta, H., Sambou, S. (2020). Combining multi-sensor satellite imagery to improve long-term monitoring of temporary surface water bodies in the Senegal river floodplain. Remote Sensing, 12(19): 3157. https://doi.org/10.3390/rs12193157
[32] Moisa, M.B., Karuppannan, S., Wong, Y.J., Khaddour, L.A. (2025). Urban agriculture land suitability assessment using AHP and geospatial analysis in Gondar Zuria, Ethiopia. DYSONA–Applied Science, 6(2025): 322-333. https://doi.org/10.30493/DAS.2025.478550
[33] Mohseni, U., Jat, P.K., Siriteja, V. (2025). Multi-criteria analysis-based mapping of the cyclone-induced pluvial flooding in coastal areas of India. DYSONA-Applied Science, 6(2): 309-321. https://doi.org/10.30493/DAS.2025.490282
[34] Adeeb, B., Omar, A.S., Jasim, A.T., Jumaah, H.J. (2025). Exploring the potential of latest fused techniques for floodplain inundation mapping and flood risk assessment. International Journal of Environmental Sciences, 11(4): 177-185.
[35] Jafarzadeh, H., Mahdianpari, M., Gill, E.W., Brisco, B., Mohammadimanesh, F. (2022). Remote sensing and machine learning tools to support wetland monitoring: A meta-analysis of three decades of research. Remote Sensing, 14(23): 6104. https://doi.org/10.3390/rs14236104
[36] Sizo, A., Noble, B.F., Bell, S. (2016). Strategic environmental assessment framework for landscape-based, temporal analysis of wetland change in urban environments. Environmental Management, 57: 696-710. https://doi.org/10.1007/s00267-015-0640-8
[37] Ameen, M.H., Azmi, M., Jumaah, H.J. (2025). Evaluating exposure to road traffic air and noise pollution: A comprehensive review of assessment methods. Tikrit Journal of Engineering Sciences, 32(2): 2020. https://doi.org/10.25130/tjes.32.2.9
[38] Malczewski, J. (2004). GIS-based land-use suitability analysis: A critical overview. Progress in Planning, 62(1): 3-65. https://doi.org/10.1016/j.progress.2003.09.002
[39] Atesoglu, A., Ozel, H.B., Varol, T., Cetin, M., Baysal, B.U., Bulut, F.S. (2025). Monitoring land cover/use conversions in Türkiye wetlands using collect earth. Journal of the Indian Society of Remote Sensing, 53(6): 1979-1994. https://doi.org/10.1007/s12524-024-02111-w
[40] Selmy, S.A.H., Moursy, A.R.A. (2025). Geospatial issues (remote sensing and GIS) of the wetlands. In Wetland Chemistry, pp. 27-57.
[41] Faouzi, B., Djemoui, C., Naima, B. (2024). Mapping the way to wetland conservation: A geomatic approach for the Oran region. Wetlands, 44(3): 31. https://doi.org/10.1007/s13157-024-01782-y
[42] Mahdavi, S., Salehi, B., Granger, J., Amani, M., Brisco, B., Huang, W. (2018). Remote sensing for wetland classification: A comprehensive review. GIScience & Remote Sensing, 55(5): 623-658. https://doi.org/10.1080/15481603.2017.1419602
[43] Guo, M., Li, J., Sheng, C., Xu, J., Wu, L. (2017). A review of wetland remote sensing. Sensors, 17(4): 777. https://doi.org/10.3390/s17040777
[44] Mumuni, A.S., Mensah, H., Asamoah, S., Simpeh, E.K. (2025). A systematic review on the causes and effects of urbanization on wetlands in Sub-Saharan Africa. Urbanization, Sustainability and Society, 2(1): 155-179. https://doi.org/10.1108/USS-10-2024-0063
[45] Hasan, K., Ajaj, Q.M. (2019). Landsat imagery and GIS-based evaluation and monitoring desertification process surrounding Kirkuk city Iraq. In Proceedings of the International Conference on Engineering Technologies (ICENTE’19), Konya, Turkey, pp. 25-27.
[46] Ajaj, Q.M., Awad, N.A., Jumaah, H.J., Rizeei, H.M. (2025). Air quality regression analysis over Iraq during severe dust periods using GIS and remotely sensed PM2.5. DYSONA-Applied Science, 6(2): 300-308. http://dx.doi.org/10.30493/DAS.2025.478260
[47] Thanoon, K.H., Shareef, A.F., Alsaif, O.A. (2022). Digital processing and deep learning techniques: A review of the literature. NTU Journal of Engineering and Technology, 1(3). https://doi.org/10.56286/ntujet.v1i3.223