Simona Di Fraia![]() | Nicola Massarotti
| Nicola Massarotti![]() | M. Rakib Uddin*
| M. Rakib Uddin*![]() | Laura Vanoli
| Laura Vanoli![]()
© 2025 The authors. This article is published by IIETA and is licensed under the CC BY 4.0 license (http://creativecommons.org/licenses/by/4.0/).
OPEN ACCESS
Global energy demand is rapidly increasing, with about 80% still met by fossil fuels, contributing to resource depletion and climate change. As a renewable alternative, agricultural biomass waste, specifically olive kernels (OK) and olive tree cuttings (OTC), appears to be promising for clean energy production. This study proposes a numerical model in Aspen Plus to simulate combined heat and power (CHP) generation via air gasification of OK and OTC. The gasification model is calibrated and validated by using experimental data available in the literature related to five different operating conditions, obtaining an average deviation of predicted syngas composition from experimental outcomes in the range of 1.23% to 13.26%. The developed model is then used to identify optimal gasification conditions, finding a temperature of 950℃ for OK and 900℃ for OTC at an equivalence ratio of at least 0.2. If globally available, OK and OTC were utilized this way in 2024, they could produce 20,375 MWh of electricity and 38,829 MWh of thermal energy, potentially cutting CO₂ emissions by 16 Mt/yr compared to the use of conventional energy sources.
olive kernel, olive tree cuttings, gasification, syngas, combined heat and power
Global olive oil demand is steadily rising due to its numerous health benefits, including anti-inflammatory and heart-protective effects [1]. As a result, land dedicated to olive cultivation increased from 8.35 to 10.4 million hectares between 2000 and 2024, with production growing from 2.57 to 3.38 Mt/yr [2]. The oil content in olive seeds varies between 20–30% of dry seed weight, depending on farming methods, climate, and harvest timing [3].
Olive oil production generates several residues:
The chemical composition and energy content of OK and OTC are affected by location and cultivation conditions, as well as climate and the maturity of olives at harvest [6]. The energy content of OK and OTC in terms of lower heating value (LHV) varies in the range of 16.30–20.58 and 12.30–20.58 MJ/kg, respectively [7, 8].
Sustainable management of OTC and OK is essential for environmental protection. Currently, these residues are commonly spread on land, composted, or processed through anaerobic digestion, combustion, pyrolysis, or gasification [6]. However, land spreading emits greenhouse gases (GHGs) due to microbial activity, and composting, while providing nutrients, is economically unviable because of nutrient imbalances and odor issues [9]. Concerning the energy recovery methods:
Gasification is a thermochemical process that converts the energy content of biomass into syngas under oxygen-lean conditions at temperatures above 600℃ [7]. The resulting syngas, containing CO, H₂, CO₂, CH₄, and other lighter hydrocarbons, can be used for combined heat and power (CHP) generation, chemical synthesis, or synthetic fuel production. Various gasifying agents like air, oxygen, steam, or their mixtures are used based on the desired product quality, with air being the most common due to its availability and low cost [12]. Temperature and equivalence ratio (ER) are key operating parameters in air gasification. For the sake of completeness, ER is the ratio between the actual air feed to the gasifier and the stoichiometric air required to ensure the complete combustion of biomass [10].
Several studies have explored the gasification of olive-based biomass residues to determine optimal conditions for syngas production using air as a gasifying agent.
However, experimental campaigns to optimize biomass gasification are time-consuming and costly [16]. For this reason, experimental activities can be coupled to modeling for efficient process optimization and the possibility of exploring different solutions to use the resulting syngas, i.e., to evaluate its potential for applications like CHP generation in internal combustion engines (ICEs).
Focusing on the modelling of biomass gasification, the commercial software Aspen Plus is one of the most commonly employed. As an example, Lampropoulos et al. [17] developed an Aspen Plus model for OK gasification at 834℃, determining optimal ER at 0.3 and a maximum moisture content of 18 wt.%. For olive waste gasification, the use of other tools has also been proposed:
The current study proposes the use of a numerical model developed in Aspen Plus V8.8 to evaluate energy recovery from OK and OTC via gasification combined with the use of the produced syngas in an ICE. Using a temperature-restricted chemical equilibrium approach, the model is calibrated and validated against experimental data from five operating conditions available in the literature [8]. Optimum gasification parameters for OK and OTC are identified through a sensitivity analysis, and the resulting GHG emission reduction from the proposed system is assessed.
2.1 Aspen Plus flowsheet
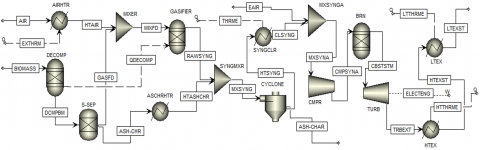
The Aspen Plus flowsheet illustrating the energy conversion of OK and OTC through gasification coupled with an ICE is presented in Figure 1.
Figure 1. Aspen Plus flow diagram to generate CHP from agricultural waste of OK and OTC
The gasification of OK and OTC in Aspen Plus involves four main steps: drying, pyrolysis, combustion, and reduction [16]. The feed stream BIOMASS (OK or OTC) enters the RYield reactor of block DECOMP at 400℃ for drying and pyrolysis, decomposing into conventional (gases, e.g., H₂, H₂O, O₂, N₂, S, and reactive carbon) and nonconventional (ash, char) components [20]. These are separated into two streams of conventional (GASFED) and nonconventional (ASH-CHR) components in the S-SEP block. Stream GASFED is mixed with heated air (adjusted by ER) and enters the RGibbs reactor of block GASIFIER for gasification reactions. ASH-CHR is mixed with the exit stream from the gasifier RAWSYNG after equalizing the temperature by passing through a heat exchanger (block ASCHRHTR) in a mixer and moving to a cyclone separator to separate the ash, char, and other solid particulate matter. The resulting clean syngas is cooled to 30 °C to enhance the ICE performance [21]. Recovered heat is reused for air preheating or other processes based on the production capacity.
The ICE is modeled in Aspen Plus using three sequential blocks: a compressor (CMPR) that increases air-syngas mixture pressure, a combustion chamber (BRN) that converts the chemical energy of syngas to thermal energy, and a turbine (TURB) that generates mechanical energy from thermal energy for power generation [21]. The ICE exhaust stream (TRBEXT) passes through two heat exchangers, HTEX and LTEX, to recover high-temperature (HT) and low-temperature (LT) thermal energy, respectively.
2.2 Model assumptions
The thermodynamic properties of conventional components are determined using the Peng–Robinson equation of state with Boston–Mathias alpha function (PR-BM) [20]. Enthalpy and density of non-conventional components such as OK, OTC, and Ash are calculated using the built-in coal models HCOALGEN and DCOALIGT, respectively, in Aspen Plus.
To reduce complexity, certain simplifying assumptions are applied to model gasification and cogeneration [20, 21]. Assumptions are as follows:
Several reactions are considered to simulate the conversion of the energy content of biomass into syngas, as illustrated in Table 1 with the heat of reaction (∆H) [20]. Other details on model development are presented in our previous publication [20].
Table 1. List of reactions considered during gasification model development with the heat of reaction [20]
|
Reaction No. |
Reaction Scheme |
Reaction Name |
∆H, KJ/mol |
|
R1 |
C + H₂O → H₂ + CO |
Water gas |
+131.0 |
|
R2 |
C + O₂ → CO₂ |
Carbon combustion |
-393.0 |
|
R3 |
C + 2H₂ → CH₄ |
Methanation |
-74.0 |
|
R4 |
CO + H₂O → H₂ + CO₂ |
Water Gas Shift |
-41.0 |
|
R5 |
C₂H₄ + 3O₂ → 2H₂O + 2CO₂ |
Ethene combustion |
-964.0 |
|
R6 |
C₂H₆ + 3.5O₂ → 3H₂O + 2CO₂ |
Ethane combustion |
-1560.0 |
|
R7 |
H₂ + 0.5O₂ → H₂O |
Hydrogen combustion |
-242.0 |
2.3 Evaluation of conversion process performances
Gasification process performance is evaluated by the assessment of syngas LHV, CGE, CCE, and net power ($\dot{P}_{\text {Net}}$) available from the transformation process, whereas cogeneration performance is estimated through electrical, thermal, and system efficiencies.
Syngas LHV depends on the composition and is estimated through Eq. (1) [22]:
$\begin{gathered}L H V_{\text {Syng }}\left(M J / \mathrm{Nm}^3\right)=0.108 y_{\mathrm{H}_2}+0.126 y_{\mathrm{CO}}+0.358 y_{\mathrm{CH}_4}\end{gathered}$ (1)
where, $y_{H_2}$, $y_{C D}$, and $y_{\mathrm{CH}_4}$ stand for the volume fraction of H₂, CO, and CH₄, respectively present in syngas.
CGE is defined as the ratio of the energy flow rate of syngas to the energy flow rate of the feed material in the gasifier and is calculated by using Eq. (2) [22]:
$C G E(\%)=\frac{L H V_{\text {Syng }} \cdot \dot{v}_{\text {Syng }}}{L H V_{B M} \cdot \dot{m}_{B M}} \cdot 100$ (2)
where, $L H V_{\text {Syng }}$ and $L H V_{B M}$ denote the LHV of syngas in MJ/Nm3 and biomass (feed materials) in MJ/kg, respectively, whereas $\dot{v}_{\text {Syng }}$ and $\dot{m}_{B M}$ stand for the volumetric flow rate of produced syngas in Nm3/h and the mass flow rate of feed materials in kg/h.
CCE is determined as the weight-based ratio of carbon flow between the product stream (syngas) and the reactant (feed materials) and is calculated by using Eq. (3) [22]:
$\operatorname{CCE}(\%)=\frac{12}{22.4} \cdot \frac{\dot{v}_{\text {Syng }}}{\dot{m}_{B M} \cdot C \% \cdot \sum_{i=1}^5 n_i \cdot y_i} \cdot 100$ (3)
where, $i$ denotes the carbon-containing component in the syngas, C% represents the weight fraction of carbon in the feed materials, $n_i$ refers to the carbon number, and $y_i$ indicates the volumetric fraction of the $i$ compound in the syngas (e.g., C1–C5).
$\dot{P}_{N e t}$ represents the difference between the total primary power available in the syngas and the energy supplied during syngas cooling, along with the energy required for air preheating to reach a specific gasification temperature, and is defined by Eq. (4):
$\dot{P}_{\text {Net }}=\dot{P}_{\text {Syng }}+\dot{P}_{\text {Syngcl }}-\dot{P}_{\text {Prht }}$ (4)
where, $\dot{P}_{\text {Syng }}$ and $\dot{P}_{\text {Syngcl }}$ represent the primary power (in kW) provided by syngas and syngas cooling, respectively, while $\dot{P}_{\text {Prht }}$ denotes the thermal power required (in kW) for air preheating to reach gasification temperature.
Electrical ($\eta_{e l}$), thermal ($\eta_{t h}$), and system ($\eta_{\text {sys}}$) efficiencies of the cogeneration systems are evaluated through Eqs. (5) to (7), respectively:
$\eta_{e l}(\%)=\frac{\dot{P}_{\text {Eff_el }}}{L H V_{\text {Syng }} \cdot \dot{v}_{\text {Syng }}} \cdot 100$ (5)
$\eta_{t h}(\%)=\frac{\dot{P}_{t h}}{L H V_{S y n g} \cdot \dot{v}_{S y n g}} \cdot 100$ (6)
$\eta_{s y s}(\%)=\frac{\dot{P}_{E f f_{-} e l}+\dot{P}_{S y n g c l}+\dot{P}_{t h}}{L H V_{B M} \cdot \dot{m}_{B M}+\dot{P}_{P r h t}} \cdot 100$ (7)
where, $\dot{P}_{\text {Eff_el }}$ represents the effective electric power output from the ICE (in kW), and $\dot{P}_{t h}$ is the total thermal power available, including both LT and HT thermal energy (in kW).
2.4 Data acquisition for model development
Operational data for the gasifier and ICE are taken from existing studies. Table 2 presents the properties and higher heating values (HHV) of OK and OTC, while Table 3 details the operating conditions of gasification and the resulting syngas properties [8, 20].
Table 2. Proximate and ultimate analysis of OK and OTC with HHV [8]
|
Properties |
OK |
OTC |
|
Proximate Analysis (wt.%) |
||
|
Moisture content |
4.59 |
4.84 |
|
Volatile matter |
75.56 |
78.31 |
|
Fixed carbon |
16.39 |
16.23 |
|
Ash content |
3.46 |
0.62 |
|
Ultimate Analysis (wt.%, dry basis) |
||
|
Carbon |
48.61 |
47.27 |
|
Hydrogen |
6.41 |
6.41 |
|
Oxygen |
41.52 |
45.70 |
|
Sulfur |
<0.05 |
<0.05 |
|
HHV (MJ/kg) |
20.39 |
19.13 |
Table 3. Overview of operating conditions and syngas compositions [8]
|
Parameters |
OK |
OTC |
||||
|
Test condition |
I |
II |
III |
IV |
V |
VI |
|
Temperature (℃) |
950 |
|||||
|
ER |
0.14 |
0.21 |
0.42 |
0.14 |
0.21 |
0.42 |
|
Feed flow rate (kg/h) |
1.00 |
|||||
|
Air flow rate (kg/h) |
0.85 |
1.27 |
2.55 |
0.80 |
1.20 |
2.40 |
|
Syngas Composition (Vol.%, Dry and N₂ free basis) |
||||||
|
H₂ |
30.24 |
31.38 |
28.59 |
25.55 |
28.81 |
21.47 |
|
CO |
18.8 |
18.6 |
18.96 |
18.56 |
16.93 |
19.38 |
|
CO₂ |
37.9 |
38.33 |
44.24 |
40.85 |
41.29 |
51.09 |
|
CH₄ |
11.05 |
10.51 |
6.85 |
12.48 |
11.14 |
6.55 |
|
C₂H₄ |
0.55 |
0.49 |
0.31 |
0.59 |
0.45 |
0.41 |
|
C₂H₆ |
1.46 |
1.46 |
1.05 |
1.78 |
1.63 |
1.10 |
Table 4. Operating parameters involved in the simulation of ICE [20]
|
Operating Parameters, Unit |
Value |
|
|
Temperature of the inlet syngas (℃) |
30.0 |
|
|
Temperature of the air (℃) |
20.0 |
|
|
Air–fuel ratio (-) |
1.11 |
|
|
Pressure of compression and combustion stages (bar) |
9.45 |
|
|
Energy losses during syngas combustion (% of syngas energy) |
10.0 |
|
|
Isentropic efficiency (%) |
Compression process |
85.0 |
|
Expansion process |
87.0 |
|
|
Mechanical efficiency (%) |
Compression process |
99.0 |
|
Expansion process |
||
|
Exhaust gas pressure (bar) |
1.0 |
|
|
Exhaust gas temperature (℃) |
338.0 |
|
|
Exhaust fume utilization temperature (℃) |
80.0 |
|
|
Cooling water temperature |
Inlet (℃) |
80.0 |
|
Exit (℃) |
90.0 |
|
The gasification model is calibrated using operating conditions and syngas composition from condition indicated as II for OK, while the other points reported in Table 3 are used for model validation.
The CHP system simulation is based on operational data of a cogeneration plant whose nominal electrical power is 20.0 kWel, based on biomass gasification. The operating parameters of this system are listed in Table 4 [20].
3.1 Gasification model: Calibration and validation
$\Delta T_{A p p r}$ (specific temperature at which individual gasification reactions are restricted) is predicted for each of the gasification reactions considered in Table 1, by applying a temperature-restricted chemical equilibrium approach, ensuring a 95% confidence level with respect to the experimental outcomes using the regression tool in Aspen Plus. $\Delta T_{A p p r}$ for each reaction with the fraction of carbon that contributes to the formation of char is illustrated in Table 5.
As illustrated in Table 5, 90 wt.% of carbon from biomass participates in gasification reactions.
Table 5. $\Delta T_{A p p r}$ to restrict the gasification reactions and the fraction of carbon that participates in char formation
|
Reaction No. |
$\Delta T_{A p p r}$ (℃) |
|
R1 |
-414.1 |
|
R2 |
-15.2 |
|
R3 |
-465.2 |
|
R4 |
-220.0 |
|
R5 |
41.2 |
|
R6 |
57.8 |
|
R7 |
299.2 |
|
Fraction of C participates in char formation |
0.10 |
The comparison between the syngas composition predicted through the model and the experimental one is shown in Figure 2 for the calibration step and in Figure 3 for validation.
Figure 2. Syngas composition: Comparison between numerical and experimental values (calibration step of OK gasification)
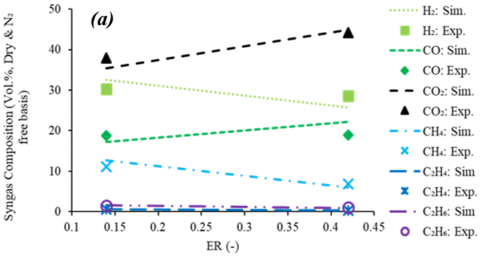
Figure 3. Syngas composition: comparison between numerical and experimental outcomes (model validation for the gasification of (a) OK and (b) OTC)
The developed gasification model closely matches experimental data, with an average deviation of 7.67 to 13.26% during validation, keeping individual syngas component deviations within ± 20%.
3.2 Sensitivity analysis
The influence of gasification temperature and ER on syngas composition, LHV, CGE, CCE, and $\dot{P}_{N e t}$ from the thermal conversion of the OK and OTC is evaluated (Figure 3). A feed flow rate of 1.0 kg/h is set to analyze the process.
3.2.1 Effect of temperature
The gasification temperature is varied between 700 and 1000℃ with a 50℃ increment, maintaining a constant ER of 0.21 to determine the optimal value. Figure 4 illustrates the impact of temperature on syngas composition, while Figure 5 depicts the variations in CGE and CCE, and Figure 6 illustrates the syngas LHV, and $\dot{P}_{N e t}$ during gasification of the OK and OTC.
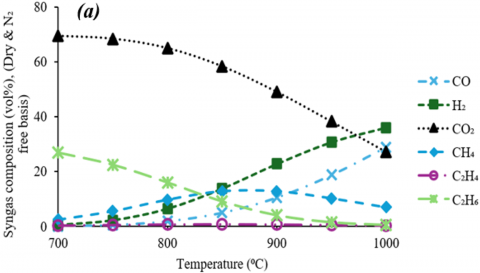
Figure 4. Variation of syngas composition with temperature during gasification of (a) OK and (b) OTC
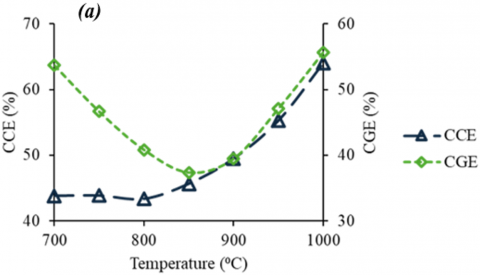
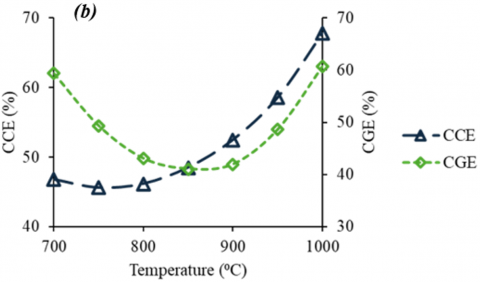
Figure 5. Effect of temperature on CCE and CGE during gasification of (a) OK and (b) OTC
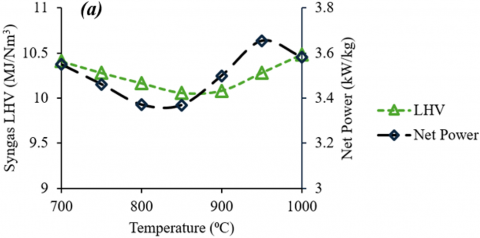
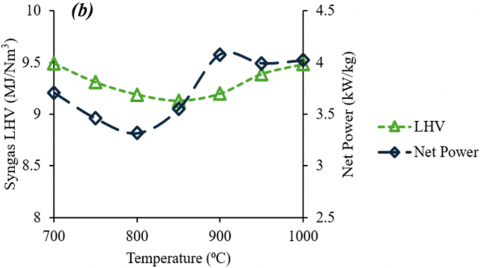
Figure 6. Effect of temperature on syngas LHV and $\dot{P}_{N e t}$ of (a) OK and (b) OTC
The trend of syngas composition at different temperatures is similar for both OK and OTC gasification. As temperature increases, CO and H₂ concentration rise due to enhanced endothermic reactions, while that of CO₂ and C₂H₆ decreases due to the suppression of exothermic reactions. CH₄ content increases up to 850℃, then declines, whereas C₂H₄ remains nearly constant, reflecting the differing temperature sensitivities of the involved reactions.
Also, CGE and CCE present a similar trend as the gasification temperature increases. CGE decreases slightly up to 850℃ due to the gradual increase of H₂ and CO content, then rises as their concentration climbs. Meanwhile, the syngas flow rate increases with temperature, causing a dilution effect related to the increase of CO₂, which initially lowers the CGE [8, 20]. In contrast, CCE continuously increases with temperature, as more carbon from the feedstock converts to syngas.
Syngas LHV decreases to 850℃, then increases for both OK and OTC. The higher performance obtained at lower temperatures for the gasification of OK could be attributed to its higher content of cellulose and hemicellulose, responsible for a lower thermal stability that facilitates rapid devolatilization and promotes secondary reactions such as steam reforming and water–gas shift, enhancing syngas production. In contrast, olive tree cuttings, being predominantly lignin-rich, decompose with slower kinetics, thereby limiting gasification efficiency and syngas yield.
The fluctuation of $\dot{P}_{N e t}$ with temperature is similar for both OK and OTC gasification. Thermal power for air preheating rises with temperature, while the energy in the product phase drops until 850℃, then climbs. Raising gasification temperature beyond 950℃ for OK and 900℃ for OTC becomes unprofitable, as the extra energy needed for air preheating outweighs the gains from syngas production.
The simulation results suggest that the optimum gasification temperature for syngas generation from OK and OTC is 950℃ and 900℃, respectively.
3.2.2 Effect of ER
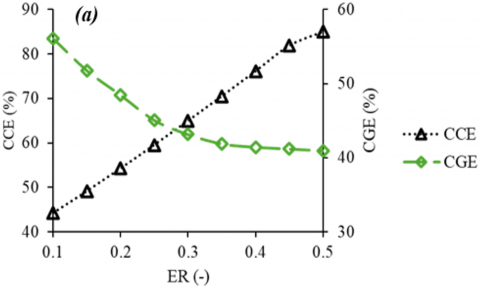
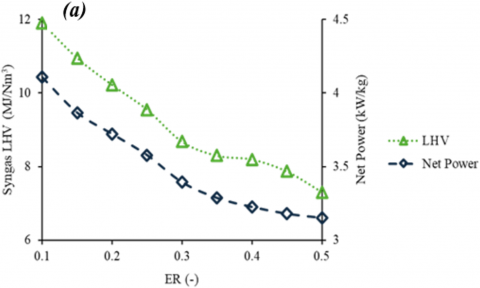
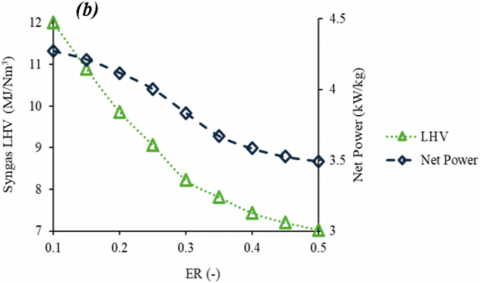
Then, the effect of varying ER from 0.10 to 0.50 with a step of 0.05 is examined at the identified optimum gasification temperature of 950℃ for OK and 900℃ for OTC. The findings are illustrated in Figure 7 for syngas composition, Figure 8 for CCE and CGE, and Figure 9 for syngas LHV and $\dot{P}_{N e t}$.
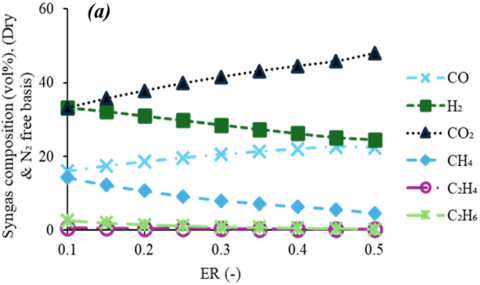
Figure 7. Effect of ER on syngas composition during gasification of (a) OK and (b) OTC
Figure 8. Effect of ER on CCE and CGE during gasification of (a) OK and (b) OTC
Figure 9. Effect of ER on syngas LHV and $\dot{P}_{N e t}$ of (a) OK and (b) OTC
The syngas composition changes similarly for both OK and OTC as ER increases. Concentrations of H₂, CH₄, and C₂H₆ decrease, while those of CO₂ and CO rise, with a more pronounced increase for CO2. A higher ER raises oxygen levels in the reactor, accelerating combustion, which boosts CO and CO₂ production while reducing other gases, a pattern explained by Le Chatelier’s principle [20, 22].
CCE and CGE present a similar pattern for both OK and OTC. CCE continuously increases, whereas CGE decreases with ER due to the forward movement of the oxidation reaction caused by the higher O₂ concentration in the reactor. Consequently, the energy content of the product gas decreases and CGE declines, but the migration of carbon content from the feed materials to the product phase increases, increasing CCE.
As ER increases, both syngas LHV and $\dot{P}_{N e t}$ decrease. This is due to:
The optimal value suggested for the ER for gasification of OK and OTC is at least 0.2. Indeed, despite an ER of 0.15, increases LHV, CGE, and $\dot{P}_{N e t}$ it risks incomplete gasification, leading to more tar, char, and contaminants [23]. This would increase the costs for syngas cleaning, making ER 0.2 a more practical and efficient operating point for reliable ICE performance and system longevity [16].
The observed variations in syngas composition, LHV, CCE, CGE, and $\dot{P}_{N e t}$ with changes in gasification temperature and ER in this study are consistent with trends reported in previous research on biomass gasification [16, 20-23].
3.3 Assessment of cogeneration performance
The CHP generation potential estimated through the proposed model is 1.70 kWh/kg (of which 0.58 kWh is electrical and the remaining is thermal energy) and 1.83 kWh/kg (here 0.63 kWh is electrical and 1.20 kWh is thermal energy) for OK and OTC, respectively. Electrical, thermal, and system efficiencies predicted for the cogeneration in the current studies are 34.3, 46.9, and 59.0%, respectively, for OK, whereas 29.8, 56.9, and 66.7% for OTC.
Based on the data of 2024 of global production of OK and OTC, the proposed system could generate 20,375 GWh of electricity and 38,829 GWh of thermal energy, potentially reducing equivalent CO₂ emissions by 7.97 Mt (electricity) and 7.84 Mt (thermal energy) compared to conventional natural gas-based CHP generation [3-5].
A numerical model developed in Aspen Plus is proposed to evaluate the CHP generation potential of residues from the olive sector to contribute to the decarbonization of this sector. The proposed solution for energy recovery is based on gasification coupled with an ICE that uses the produced syngas. The gasification model is developed by considering experimental data on syngas generation from OK and OTC available in the literature. A sensitivity analysis is conducted to identify the optimum operating points of temperature and ER, finding the values of 950℃ and 900℃, respectively, with an ER of at least 0.2 for both sources.
The predicted CHP generation potential of the global OK and OTC in 2024 is 59,205 GWh, which can reduce the equivalent CO₂ emissions of 15.81 Mt compared to the similar quantity of CHP generation through natural gas combustion. Thus, energy recovery from the agricultural residues of the OK and OTC through the proposed system could be a valuable contribution to the decarbonization of this sector.
Simona Di Fraia, M. Rakib Uddin and Laura Vanoli gratefully acknowledge the financial support of PRIN 2022 Project "AGRoIndustrial sector decarbonisation through energy recovery from waste biomass and integration with other RENEWables”, CUP I53D23001640006, financed by European Union – Next Generation EU, Ministero dell’Università e della Ricerca, Italia Domani Piano Nazionale di Ripresa e Resilienza Missione 4: Istruzione e ricerca.
|
Abbreviations |
|
|
CCE |
Carbon conversion efficiency |
|
CGE |
Cold gas efficiency |
|
CHP |
Combined heat and power |
|
ER |
Equivalence ratio |
|
GHG |
Greenhouse gas |
|
HHV |
Higher heating value |
|
ICE |
Internal combustion engine |
|
LHV |
Lower heating value |
|
PR-BM |
Boston–Matthias modified Peng-Robinson method |
|
OK |
Olive kernel |
|
OTC |
Olive tree cuttings |
|
Symbol |
|
|
C% |
Weight fraction of carbon |
|
$\dot{m}$ |
Mass flow rate |
|
n |
Number of components considered in syngas |
|
$\dot{P}$ |
Power |
|
$\dot{Q}$ |
Energy supply rate |
|
ΔT |
Limit of temperature |
|
$\dot{V}$ |
Volumetric flow rate |
|
y |
Volume percentage |
|
Greek symbols |
|
|
$\eta$ |
Efficiency |
|
$v$ |
Normalized drying rate |
|
Subscripts |
|
|
Appr |
Approach |
|
BM |
Biomass (feed materials) |
|
CH₄ |
Methane |
|
CO |
Carbon monoxide |
|
Eff-el |
Effective electrical |
|
el |
electrical |
|
gasf |
gasification |
|
H₂ |
Hydrogen |
|
$i$ |
Carbon containing compound |
|
prht |
Preheating |
|
syng |
Syngas |
|
syngcl |
Syngas cooling |
|
sys |
System |
|
th |
Thermal |
[1] Bilal, R.M., Liu, C., Zhao, H., Wang, Y., Farag, M.R., Alagawany, M., Hassan, F., Elnesr, S.S., Elwan, H.A.M., Qiu, H., Lin, Q. (2021). Olive oil: Nutritional applications, beneficial health aspects and its prospective application in poultry production. Frontiers in Pharmacology, 12: 723040. https://doi.org/10.3389/fphar.2021.723040.
[2] International Olive Council. (2024). World of live oil and table olives – data from December 2024. https://www.internationaloliveoil.org/world-market-of-olive-oil-and-table-olives-data-from-december-2024/#:~:text=Olive%20oil%20%E2%80%93%20Estimates%20for%20the%202024%2F25%20crop%20year&text=IOC%20member%20countries%20as%20a,on%20the%20previous%20crop%20year.
[3] Maestri, D., Barrionuevo, D., Bodoira, R., Zafra, A., Jiménez-López, J., Alché, J.D.D. (2019). Nutritional profile and nutraceutical components of olive (Olea europaea L.) seeds. Journal of Food Science and Technology, 56(9): 4359-4370. https://doi.org/10.1007/s13197-019-03904-5
[4] Lapuerta, M., Hernández, J.J., Rodríguez, J. (2007). Comparison between the kinetics of devolatilisation of forestry and agricultural wastes from the middle-south regions of Spain. Biomass and Bioenergy, 31(1): 13-19. https://doi.org/10.1016/j.biombioe.2006.05.003
[5] Sansoucy, R. (1985). Olive By-Products for Animal Feed. Food and Agriculture Organization of the United Nations, Rome. https://www.fao.org/4/x6545e/X6545E01.htm.
[6] Di Giacomo, G., Romano, P. (2022). Evolution of the olive oil industry along the entire production chain and related waste management. Energies, 15(2): 465. https://doi.org/10.3390/en15020465
[7] Aguado, R., Vera, D., Lopez-Garcia, D.A., Torreglosa, J.P., Jurado, F. (2021). Techno-economic assessment of a gasification plant for distributed cogeneration in the agrifood sector. Applied Sciences, 11(2): 660. https://doi.org/10.3390/app11020660
[8] Skoulou, V., Zabaniotou, A., Stavropoulos, G., Sakelaropoulos, G. (2008). Syngas production from olive tree cuttings and olive kernels in a downdraft fixed-bed gasifier. International Journal of Hydrogen Energy, 33(4): 1185-1194. https://doi.org/10.1016/j.ijhydene.2007.12.051
[9] Rahman, M.A., Shahazi, R., Nova, S.N.B., Uddin, M.R., Hossain, M.S., Yousuf, A. (2023). Biogas production from anaerobic co-digestion using kitchen waste and poultry manure as substrate—Part 1: Substrate ratio and effect of temperature. Biomass conversion and biorefinery, 13(8): 6635-6645. https://doi.org/10.1007/s13399-021-01604-9
[10] Backa, A., Čajová Kantová, N., Nosek, R., Patsch, M. (2025). Evaluating the combustion of various biomass pellets in a small heat source with underfeed pellet burner: Heat output, gas emission and ash melting behavior. Journal of the Energy Institute, 118: 101936. https://doi.org/10.1016/j.joei.2024.101936
[11] Guida, M.Y., Hannioui, A. (2016). A review on thermochemical treatment of biomass: Pyrolysis of olive mill wastes in comparison with other types of biomass. Progress in Agricultural Engineering Sciences, 12(1): 1-23. https://doi.org/10.1556/446.12.2016.1
[12] Tezer, Ö., Karabağ, N., Öngen, A., Çolpan, C.Ö., Ayol, A. (2022). Biomass gasification for sustainable energy production: A review. International Journal of Hydrogen Energy, 47: 15419-15433. https://doi.org/10.1016/j.ijhydene.2022.02.158
[13] Gálvez-Pérez, A., Martín-Lara, M.A., Calero, M., Pérez, A., Canu, P., Blázquez, G. (2021). Experimental investigation on the air gasification of olive cake at low temperatures. Fuel Processing Technology, 213: 106703. https://doi.org/10.1016/j.fuproc.2020.106703
[14] Vera, D., Jurado, F., Margaritis, N.K., Grammelis, P. (2014). Experimental and economic study of a gasification plant fuelled with olive industry wastes. Energy for Sustainable Development, 23: 247-257. https://doi.org/10.1016/j.esd.2014.09.011
[15] Skoulou, V., Koufodimos, G., Samaras, Z., Zabaniotou, A. (2008). Low temperature gasification of olive kernels in a 5-kW fluidized bed reactor for H2-rich producer gas. International Journal of Hydrogen Energy, 33: 6515-6524. https://doi.org/10.1016/j.ijhydene.2008.07.074
[16] Gomez Vásquez, R.D., Rhenals-Julio, J.D., Mendoza, J.M., Acevedo, J., Bula Silvera, A.J. (2025). Optimizing hydrogen production and efficiency in biomass gasification through advanced CFD modeling. Applied Thermal Engineering, 272: 126454. https://doi.org/10.1016/j.applthermaleng.2025.126454
[17] Lampropoulos, A., Zubillaga, I.G., Pérez-Vega, R., Ntavos, N., Fallas, Y., Varvoutis, G. (2020). Preliminary experimental results and modelling study of olive kernel gasification in a 2 MWth BFB Gasifier. Processes, 10(10): 2020. https://doi.org/10.3390/pr10102020
[18] Vera, D., Jurado, F., Carpio, J. (2011). Study of a downdraft gasifier and externally fired gas turbine for olive industry wastes. Fuel Processing Technology, 92: 1970-1979. https://doi.org/10.1016/j.fuproc.2011.05.017
[19] Borello, D., Pantaleo, A.M., Caucci, M., De Caprariis, B., De Filippis, P., Shah, N. (2017). Modeling and experimental study of a small scale olive pomace gasifier for cogeneration: Energy and profitability analysis. Energies, 10(12): 1930. https://doi.org/10.3390/en10121930
[20] Carotenuto, A., Di Fraia, S., Massarotti, N., Sobek, S., Uddin, M.R., Vanoli, L., Werle, S. (2023). Sewage sludge gasification process optimization for combined heat and power generation. Energies, 16(12): 4742. https://doi.org/10.3390/en16124742
[21] HajiHashemi, M.S., Mazhkoo, S., Dadfar, H., Livani, E., Naseri Varnosefaderani, A., Pourali, O., Nobar, S.N., Dutta, A. (2023). Combined heat and power production in a pilot-scale biomass gasification system: Experimental study and kinetic simulation using ASPEN Plus. Energy, 276: 127506. https://doi.org/10.1016/j.energy.2023.127506
[22] Uddin, M.N., Salam, M.A., Akhter, S., Yousuf, A., Biswas, A.K., Khan, B.A., Uddin, M.R. (2025). Conversion of municipal solid waste to green energy: Numerical studies. Waste Management Bulletin, 3(3): 100211. https://doi.org/10.1016/j.wmb.2025.100211
[23] Castillo Santiago, Y., Martínez González, A., Venturini, O.J., Yepes Maya, D.M. (2021). Assessment of the energy recovery potential of oil sludge through gasification aiming electricity generation. Energy, 215: 119210. https://doi.org/10.1016/j.energy.2020.119210