Fuad*![]() | Bagus Prasetyo Aji
| Bagus Prasetyo Aji![]() | Wahyu Isroni
| Wahyu Isroni![]() | Mochammad Riyanto
| Mochammad Riyanto![]() | Noorhidayah Binti Mamat
| Noorhidayah Binti Mamat![]() | Anjas Sasana Bahri
| Anjas Sasana Bahri![]()
© 2025 The authors. This article is published by IIETA and is licensed under the CC BY 4.0 license (http://creativecommons.org/licenses/by/4.0/).
OPEN ACCESS
This study quantified and compared the effects of underwater LED light color and intensity on fish behavior and shoal distribution during fixed lift-net operations. Four LED colors (blue, green, yellow, and white) and a kerosene Petromax lamp as a control were tested in 25 fishing trials in the coastal waters of Pasuruan, Indonesia. Fish aggregation and vertical distribution were recorded using an echosounder and analyzed based on light intensity gradients. Analysis of variance (ANOVA) revealed significant differences among light colors (F₄,₂₀ = 6.24, p < 0.05), with green LEDs producing the highest shoal proportion (75.7 ± 6.3%) and catch weight (28.52 ± 2.41 kg/trip). The relationship between light intensity and shoal proportion followed a logarithmic pattern (R² = 0.86), peaking at 1×10⁻⁸-1×10⁻⁷ W/cm². Moderate green illumination provided stable aggregation within 90 minutes and sustained >90% of maximum density. These results demonstrate that optimized green LED lighting enhances fish aggregation efficiency and catch performance, offering a practical and energy-efficient alternative to conventional kerosene lamps for sustainable light-based fisheries. This study provides quantitative evidence on the optimal spectral and intensity range for efficient and eco-friendly light-based fishing operations, contributing to the advancement of sustainable fishing technology.
fish behavior, LED light, underwater illumination, fish aggregation, fixed lift-net fishery
Fixed lift-net fisheries along the Madura Straits of Indonesia still rely heavily on kerosene-based Petromax lamps to attract fish schools at night. Despite their long-standing use, these lamps have several limitations, including low energy efficiency, safety hazards, and poor control of spectral composition. The inability to regulate light color and intensity restricts their suitability for stimulating the visual responses of target species, particularly pelagic fish that exhibit wavelength-specific behavior [1, 2]. Field assessments have highlighted the operational inefficiency and environmental drawbacks of fuel-based lamps compared with modern LED systems, which offer a more energy-efficient and environmentally friendly alternative with controllable spectral and intensity characteristics suitable for wavelength-specific fish attraction [3, 4].
Experimental and field studies conducted during the last decade demonstrate that both spectral composition and intensity of LED illumination strongly influence attraction, vertical distribution, and schooling cohesion of commercially important species [2, 5-7]. Furthermore, in situ trials indicate that LED configuration and intensity determine not only immediate attraction but also the spatio-temporal stability of shoals under operational fishing conditions [3, 7].
The phototactic response of fish is largely governed by retinal cone sensitivity to specific wavelengths; many teleosts possess cone pigments with peak absorbance within the green region of the spectrum (ca. 500–540 nm), which is also relatively well transmitted in coastal waters [2, 8-10]. Spectral tuning and intensity modulation are both critical because excessively bright or spectrally inappropriate illumination can cause photoreceptor saturation or avoidance behavior [3, 6, 11]. Recent retinal and behavioural assays corroborate that green-wavelength LEDs can produce strong phototactic responses in pelagic species while minimizing retinal stress when operated at moderate intensities [1, 12, 13].
Therefore, this study was conducted to quantify and compare the effects of LED light color and intensity on the vertical distribution and aggregation proportion of fish shoals during fixed lift-net operations. The objective was to identify the most effective spectral and intensity combination to enhance fish attraction, improve catch efficiency, and reduce energy consumption. The results are expected to contribute to the optimization of LED-based fishing technologies and to support the transition toward sustainable and low-emission fisheries.
2.1 Study site
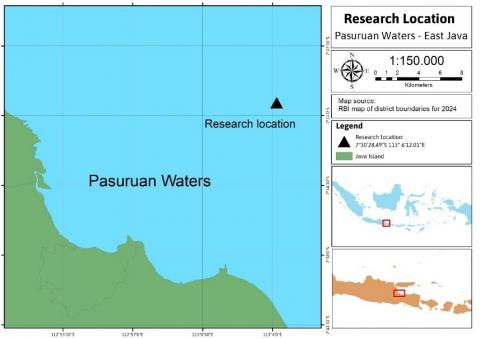
The experiment was conducted using a fixed lift-net (bagan tancap) located in the coastal waters of Pasuruan, East Java, Indonesia (Figure 1). The study was performed in two stages: (i) determine fish distribution data against LED light color (August - October 2024); (ii) fish school distribution data against light intensity (November 2024 - January 2025). The fishing trials were carried out using a fixed lift-net constructed of bamboo with a frame dimension of 10 × 10 m and an average net depth of 13 m. The site lies approximately 4 nautical miles from the shoreline, corresponding to a one-hour boat travel from the nearest landing site. Each experiment was conducted during nocturnal calm sea conditions and similar lunar phases to minimize environmental variability.
Figure 1. Location of the fixed lift-net used for the experiment in Pasuruan coastal waters
2.2 Experimental design
The experiment on light intensity was conducted to evaluate the response of fish aggregation under varying underwater radiance ranges produced by different LED colors. The study employed directly measured underwater light intensities rather than nominal luminous power. Each LED color -blue, green, yellow, and white- was operated to produce specific irradiance gradients measured in watts per square centimeter (W/cm2). The Petromax lamp served as a broad-spectrum control. The measured light intensity ranges used in this study are shown in Table 1. Each light source was positioned at a depth of 0.3 m below the echosounder transducer and centrally aligned under the lift-net frame to ensure uniform illumination. The Petromax lamp was suspended 2.5 m above the surface and lowered to 1.0 m before hauling (Figure 2). Each treatment was replicated five times (n = 5) under identical environmental and lunar conditions.
Figure 2. The configuration of (a) the power source (battery), (b) the Echosounder monitor, (c) the Transducer, and (d) the Underwater LED light
Table 1. Technical specifications of the LED lamps used in the experiment
|
Color |
Peak Wavelength (nm) |
Intensity Range (W/cm2) |
Operating Voltage (V) |
Current (A) |
Deployment Depth (m) |
Replication (n) |
Manufacture |
|
Blue |
460-470 |
1×10⁻⁶ - 10×10⁻⁶ 1×10⁻⁷ - 10×10⁻⁷ 1×10ˉ⁸ - 10×10⁻⁸ 1×10ˉ⁹ - 10×10⁻⁹ |
1.0 |
0.5 |
0.3 |
5 |
Prototype |
|
Green |
520-540 |
1×10⁻⁷ - 10×10⁻⁷ 1×10ˉ⁸ - 10×10⁻⁸ 1×10ˉ⁹ - 10×10⁻⁹ 1×10ˉ10-10×10⁻10 |
1.0 |
0.5 |
0.3 |
5 |
Prototype |
|
Yellow |
580-600 |
1×10⁻⁷ - 10×10⁻⁷ 1×10ˉ⁸ - 10×10⁻⁸ 1×10ˉ⁹ - 10×10⁻⁹ 1×10ˉ10-10×10⁻10 |
1.0 |
0.5 |
0.3 |
5 |
Prototype |
|
White |
400-700 |
1×10⁻⁷ - 10×10⁻⁷ 1×10ˉ⁸ - 10×10⁻⁸ 1×10ˉ⁹ - 10×10⁻⁹ 1×10ˉ10-10×10⁻10 |
1.0 |
0.5 |
0.3 |
5 |
Prototype |
|
Petromax (control) |
Broad spectrum |
1×10⁻⁷ - 10×10⁻⁷ 1×10ˉ⁸ - 10×10⁻⁸ 1×10ˉ⁹ - 10×10⁻⁹ |
LPG fuel |
- |
Surface |
5 |
Local |
2.3 Data collection
2.3.1 Fish shoal distribution
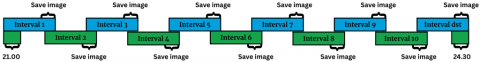
Vertical fish distribution was recorded using a Garmin 585 echosounder equipped with a 50/200 kHz dual-beam transducer. The transducer was installed 30 cm above the LED lamp at the center of the lift-net frame. The system continuously monitored fish aggregation from the surface to 12 m depth. Each observation session lasted 180 minutes, divided into 18 intervals of 10 minutes each. Fish echo data from the final two minutes of each interval were stored for subsequent analysis (Figure 3).
Figure 3. Time sequence of fish distribution observations and data storage intervals during night fishing experiments
2.3.2 Light field measurement
Underwater light intensity was measured using an ILT-5000 radiometer equipped with a calibrated photodiode sensor. Measurements were conducted at 120 intersection points within the 10 × 10 × 13 m lift-net grid to quantify both horizontal and vertical irradiance gradients. The resulting irradiance values were classified into logarithmic ranges (10-6-10-10 W/cm2) consistent with those presented in Table 1, which summarizes the technical specifications and operational ranges of each light source (blue, green, yellow, white LEDs, and Petromax lamp).
The obtained intensity data were further processed to construct three-dimensional irradiance contour maps using Surfer 13 software, providing a quantitative representation of underwater light distribution. These contour maps were subsequently used in conjunction with echosounder data to analyze the vertical aggregation pattern of fish shoals relative to light intensity.
2.4 Data processing and validation
Raw echosounder images were validated and pre-processed to remove background noise and non-biological echoes. Each echogram was converted into grayscale format, and unwanted reflections, including surface reverberation and thermocline artifacts, were filtered through contrast and brightness adjustments to enhance the visibility of biological backscatter layers. The validated echograms were then transformed into transparent layers and spatially aligned with irradiance contour maps derived from ILT-5000 measurements.
The overlay process was conducted by matching the coordinate grid of the lift-net frame and the echosounder depth with the corresponding irradiance contours, ensuring accurate spatial correspondence between fish shoal distribution and underwater light intensity gradients.
Quantitative image analysis was conducted using ImageJ software, where binary segmentation and Otsu thresholding were applied to delineate fish shoal areas. The proportional shoal area (Pi) was calculated as Pi = (pi/pt) × 100 for each 10-minute observation interval, where pi represents the shoal area and pt the total reference area.
Three-dimensional irradiance contour maps were constructed using Surfer 13 to visualize spatial light distribution and integrate it with the shoal aggregation layers. This image-based workflow enabled both visual and quantitative validation of fish aggregation behavior in relation to underwater light fields. Figure 4 presents the complete analytical workflow, including data validation, spatial overlay, and extraction of proportional shoal areas.
The vertical distribution of fish shoals was grouped according to light intensity ranges: 1×10⁻⁷-1×10⁻⁶, 1×10⁻⁸-1×10⁻⁷, 1×10⁻⁹-1×10⁻⁸, and 1×10⁻¹⁰-1×10⁻⁹ W/cm2, following the classification by study [7].
Figure 4. Analytical workflow of overlaying light intensity and fish shoal distribution images to determine vertical aggregation patterns and the proportional area of the fish cluster
2.5 Statistical analysis
Statistical analysis was conducted using SPSS v26.0 to evaluate the effects of light color treatments on fish aggregation and catch performance. The dependent variable included: (1) the proportion of fish shoal area (%), derived from image-based analysis, and (2) the catch weight (kg/trip) obtained from lift-net operations. The independent variable was light color, consisting of five levels: blue, green, yellow, white LEDs, and Petromax control.
For each treatment, data were obtained from five independent replicates, each representing the mean value derived from 18 observation intervals (10 min per interval). Accordingly, 25 data points (5 treatments × 5 replicates) were included in the analysis.
One-way ANOVA was used to test for significant differences among treatments, followed by Tukey’s HSD post hoc test for pairwise comparisons at α = 0.05. Data normality and variance homogeneity were verified using the Shapiro-Wilk and Levene tests. Non-normal data were log-transformed before analysis, and results are expressed as mean ± SD.
A total of 25 experimental trials were conducted under five light treatments (blue, green, yellow, white, and Petromax). Across all treatments, the vertical aggregation and catch rates exhibited clear differences in relation to both light color and intensity. The overall light intensity detected at 6 m depth ranged between 1×10⁻⁶ and 1×10⁻⁹ W/cm².
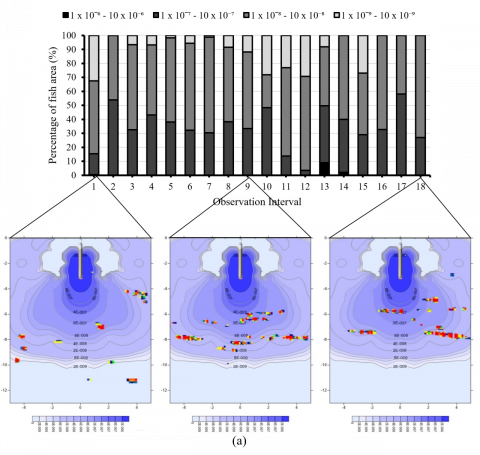
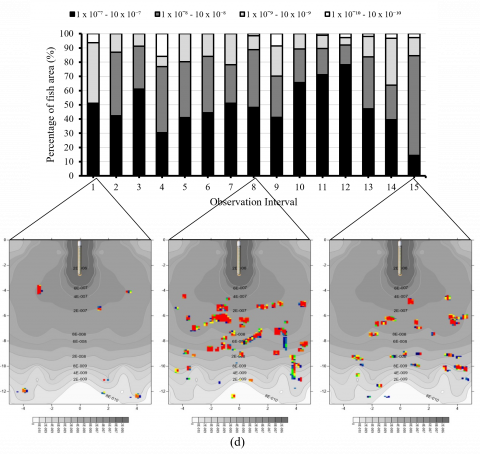
3.1 Vertical distribution under different LED colors
Fish shoal responses varied significantly among the four LED colors (Figure 5). The green LED consistently produced the highest aggregation proportion, with a mean shoal area of 75.7 ± 6.3%, followed by yellow (64.9 ± 5.8%), blue (54.4 ± 4.2%), and white (50.0 ± 5.4%). The Petromax control produced lower aggregation (63.7 ± 5.9%) but showed a wider vertical dispersion (Table 2).
A one-way ANOVA confirmed significant differences in shoal proportion among light colors (F₄,₂₀ = 6.24, p = 0.002). Tukey’s HSD post hoc test indicated that aggregation under green LED light was significantly higher (p < 0.05) than under blue, yellow, and white LEDs, whereas differences between yellow and Petromax lamps were not statistically significant (p > 0.05).
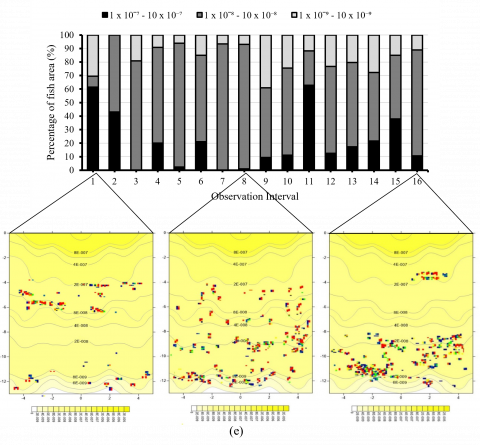
Most fish aggregation occurred at depths of 5–9 m, corresponding to the 1×10⁻⁸–1×10⁻⁷ W/cm² light intensity range (Figure 6). The vertical concentration was more compact under green light, while shoals under yellow and white lights were scattered and less stable.
Figure 5. Vertical aggregation profiles of fish shoals under different LED light colors (a) blue LED light; (b) green LED light; (c) yellow LED light; (d) white LED white; (e) Petromax
Figure 6. Mean vertical distribution of fish shoals by depth and light intensity range
Table 2. Average fish shoal proportion under different light colors
|
Light Source |
Depth Concentration |
Mean Shoal Proportion (%) ± SD |
Average Percentage of Fish Shoal |
Significance Group (Tukey HSD) |
|
Green LED |
5-9 |
75.7 ± 6.3 |
75.7% |
a |
|
Yellow LED |
5-9 |
64.9 ± 5.8 |
64.9% |
b |
|
Petromax |
5-12 |
63.7 ± 5.9 |
63.7% |
b |
|
Blue LED |
4-9 |
54.4 ± 4.2 |
54.4% |
c |
|
White LED |
7-10 |
50.0 ± 5.4 |
50.0% |
c |
Different letters indicate statistically significant differences at p < 0.05 (Tukey HSD).
3.2 Fish catch performance
Catch composition analysis revealed a similar species spectrum across all treatments, but with varying quantities (Figure 7). The green LED treatment yielded the highest mean total catch of 28.52 ± 2.41 kg/trip, followed by blue (25.03 ± 1.58 kg/trip), yellow (21.06 ± 2.32 kg/trip), white (17.85 ± 1.44 kg/trip), and Petromax control (15.88 ± 1.94 kg/trip).
Statistical comparison by ANOVA confirmed that catch weight differed significantly among light treatments (F₄,₂₀ = 8.32, p < 0.001). Tukey’s test showed that green LED catch was significantly higher (p < 0.05) than that of yellow, white, and Petromax lamps, while the difference with blue LED was marginal (p = 0.07).
Dominant species included mackerel (Rastrelliger kanagurta), scad (Selaroides leptolepis), and anchovy (Stolephorus sp.), representing 65–72% of the total catch. Green and blue LEDs attracted a higher proportion of pelagic schooling species (anchovy, scad, and trevally), whereas white and yellow LEDs drew more benthopelagic species (squid, mullet, and pony fish) (Table 3).
Figure 7. Comparison of catch composition and total catch weight under various light colors
Table 3. Comparison of mean catch weight and dominant species under different light colors
|
Light Source |
Mean Catch (kg/trip) ± SD |
Dominant Species (relative %) |
Statistical Group |
|
Green LED |
28.52 ± 2.41 |
Rastrelliger kanagurta (25%), Selaroides leptolepis (20%), Stolephorus sp. (11%) |
a |
|
Blue LED |
25.03 ± 1.58 |
R. kanagurta (33%), S. leptolepis (27%) |
ab |
|
Yellow LED |
21.06 ± 2.32 |
R. kanagurta (28%), Loligo sp. (10%), S. leptolepis (21%) |
b |
|
White LED |
17.85 ± 1.44 |
R. kanagurta (28%), S. leptolepis (18%), Stolephorus sp. (16%) |
c |
|
Petromax |
15.88 ± 1.94 |
R. kanagurta (31%), S. leptolepis (28%), Loligo sp. (8%) |
c |
3.3 Fish shoal intensity and temporal stability
Temporal variation in fish aggregation was recorded for 18 observation intervals between 21:00 and 24:30 (Figure 3). Fish began responding to light within 20–30 minutes after illumination, and aggregation intensity increased progressively during the first 60–80 minutes.
Under green LED light, shoal density increased rapidly and stabilized after approximately 90 minutes, maintaining more than 90% of its maximum density until the end of observation. Blue and yellow LEDs reached stability after 100–120 minutes, while white LED and Petromax treatments showed fluctuating shoal densities throughout the experiment.
These results indicate that the green LED treatment produced the most stable aggregation pattern over time, consistent with its higher overall aggregation proportion presented in Figure 6 and Table 2.
3.4 Relationship between Light Intensity and Aggregation Proportion
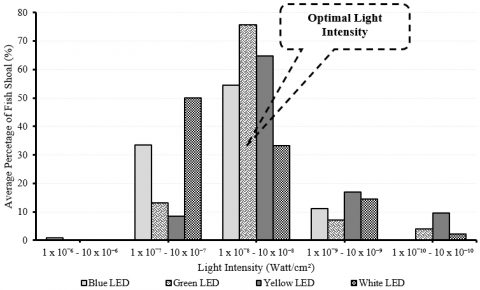
A clear logarithmic relationship was observed between light intensity and fish-shoal proportion (R² = 0.86; Figure 8). Aggregation increased rapidly from 1×10⁻¹⁰ to 1×10⁻⁸ W/cm², peaking around 1×10⁻⁸–1×10⁻⁷ W/cm², and declined at higher intensities. This pattern was consistent across all LED colors, with the highest response recorded for green LED illumination.
The optimum light intensity for aggregation was estimated at (1.0–3.0) × 10⁻⁸ W/cm², corresponding to depths of 6–8 m, where fish remained most concentrated before hauling operations.
Figure 8. Relationship between underwater light intensity and the proportion of fish aggregation under blue, green, yellow, and white LED lights
The present study demonstrated that the color and intensity of underwater LED illumination exert a significant influence on the spatial distribution and aggregation behavior of fish shoals under fixed lift-net operations. Among the tested light sources, green LEDs produced the highest aggregation proportion and catch weight, suggesting that this wavelength most effectively stimulated phototactic responses in pelagic fish species.
4.1 Mechanisms underlying fish attraction to green light
The superior performance of green LEDs can be explained by the spectral sensitivity of fish retinal photoreceptors. Most marine teleosts possess double cones containing visual pigments with peak absorbance between 500–540 nm, corresponding to green light wavelengths that penetrate seawater efficiently [2, 6]. This spectral region maintains high photon density at intermediate depths, enhancing visual contrast and energy-efficiency detection under mesopelagic conditions [2, 3]. Consequently, the dominant species observed in this study-Rastrelliger brachysoma and Selaroides leptolepis-were able to detect and orient toward green illumination, resulting in stable aggregation and consistent catch performance.
In contrast, blue light, despite its deeper penetration, often induces weaker aggregation in coastal turbid environments due to reduced retinal sensitivity and increased scattering [1, 9, 10, 14]. White and yellow light sources generate mixed spectra that can cause glare or photoreceptor saturation, reducing contrast detection and altering orientation behavior [10, 11]. These findings align with recent experimental observations showing higher attraction rates of pelagic fish under narrow green spectra compared with other LED colors [12, 13].
4.2 Influence of light intensity on aggregation depth and stability
A clear logarithmic relationship was observed between light intensity and fish aggregation (R² = 0.86), peaking within the range of 1×10⁻⁸ and 1×10⁻⁷ W/cm². This intensity range represented an optimal threshold where illumination remained perceptible yet non-aversive to fish visual receptors. Aggregation decreased at higher intensities, likely due to avoidance behavior or phototactic inhibition caused by excessive light exposure [3, 11, 15, 16].
Temporal analysis indicated that fish shoals under green LEDs stabilized after approximately 90 minutes, maintaining over 90% of maximum density, while shoals under other light colors fluctuated irregularly. This stability indicated that moderate green illumination created a visually comfortable and energetically favorable environment for schooling, thereby reducing stress and random dispersion [2, 17].
4.3 Ecological and operational implications
Ecologically, the predominance of pelagic schooling species (Rastrelliger kanagurta, Selaroides leptolepis, Stolephorus sp.) under green and blue LEDs indicated wavelength-specific behavioral responses linked to diurnal foraging and retinal adaptation [3, 4]. Green illumination overlapped with the spectral range used for prey detection and intraspecific communication among these taxa, thereby enhancing feeding efficiency [2, 18, 19].
From an operational perspective, LED systems provide substantial energy savings compared with kerosene-based Petromax lamps. Field trials in both small-scale and industrial fisheries have shown that LED arrays can reduce power consumption by 60–80% while maintaining or improving catch efficiency [12, 13]. Furthermore, the use of narrow-band green LEDs has been associated with selective attraction of target pelagic species, reducing bycatch of demersal organisms and promoting more sustainable fishing practices [3, 11, 20, 21]. These combined benefits support the transition toward low-emission, eco-efficient fishing operations in tropical coastal waters.
4.4 Study limitations and recommendations
This study was limited to a single fishing ground and gear type (fixed lift-net), conducted under relatively uniform environmental conditions. Variations in season, turbidity, and species composition may influence fish responses to illumination. Future investigations should encompass multiple seasons and fishing grounds, integrated with physiological assessments such as electroretinogram analysis or in situ tracking, to quantify species-specific phototactic thresholds and behavioral variability under operational conditions [1, 11].
Despite these limitations, the results provide valuable insight for optimizing LED deployment strategies in light-based fisheries. Implementing moderate-intensity green LEDs positioned 0.3 m below the transducer is recommended to maximize aggregation efficiency and catch yield while minimizing energy consumption and ecological disturbance.
This study confirmed that the color and intensity of underwater light significantly influence fish aggregation behavior and catch performance in fixed lift-net operations. Among the tested light sources, the green LED produced the highest aggregation proportion (75.7 ± 6.3%) and catch weight (28.52 ± 2.41 kg/trip), followed by blue, yellow, white LEDs, and Petromax lamps.
The fish aggregation exhibited a logarithmic relationship with light intensity (R² = 0.86), reaching its maximum within the 1×10⁻⁸–1×10⁻⁷ W/cm² range at depths of 5–9 m. Green illumination induced the fastest and most stable temporal response, with shoal density stabilizing after approximately 90 minutes and maintaining over 90% of its peak concentration thereafter. These results indicate that moderate green illumination offers optimal visual stimulation for pelagic schooling species such as Rastrelliger brachysoma and Selaroides leptolepis.
The findings highlight the practical potential of green LED lighting as an energy-efficient and species-selective alternative to kerosene-based lamps in coastal fisheries. Implementation of moderate-intensity green LEDs could improve catch yield, reduce fuel consumption, and minimize ecological disturbance, supporting sustainable and low-carbon fishing practices. Further studies encompassing multiple seasons, fishing grounds, and species assemblages are recommended to validate these results and refine operational guidelines for light-based fisheries management.
The authors gratefully acknowledge the support provided by the Faculty of Fisheries and Marine Science, Universitas Brawijaya, Indonesia, for facilitating field experiments and laboratory analysis. Appreciation is also extended to the local fishermen of Pasuruan for their cooperation during the experimental trials and data collection.
[1] Susanto, A., Suuronen, P., Gorgin, S., Irnawati, R., et al. (2022). Behavioral response and retinal adaptation of Blue swimming crab (Portunus pelagicus) exposed to LED lights–LED light as a potential artificial attractant in trap fishing. Fisheries Research, 250: 106274. https://doi.org/10.1016/j.fishres.2022.106274
[2] Carleton, K.L., Escobar-Camacho, D., Stieb, S.M., Cortesi, F., Marshall, N.J. (2020). Seeing the rainbow: Mechanisms underlying spectral sensitivity in teleost fishes. Journal of Experimental Biology, 223(8): jeb193334. https://doi.org/10.1242/jeb.193334
[3] Melli, V., Krag, L.A., Herrmann, B., Karlsen, J.D. (2018). Investigating fish behavioural responses to LED lights in trawls and potential applications for bycatch reduction in the Nephrops-directed fishery. ICES Journal of Marine Science, 75(5): 1682-1692. https://doi.org/10.1093/icesjms/fsy048
[4] Nguyen, K.Q., Winger, P.D. (2019). Artificial light in commercial industrialized fishing applications: A review. Reviews in Fisheries Science & Aquaculture, 27(1): 106-126. https://doi.org/10.1080/23308249.2018.1496065
[5] Jang, J.C., Choi, M.J., Yang, Y.S., Lee, H.B., Yu, Y.M., Kim, J.M. (2016). Dim-light photoreceptor of chub mackerel Scomber japonicus and the photoresponse upon illumination with LEDs of different wavelengths. Fish Physiology and Biochemistry, 42(3): 1015-1025. https://doi.org/10.1007/s10695-015-0193-z
[6] Utne-Palm, A.C., Breen, M., Løkkeborg, S., Humborstad, O.B. (2018). Behavioural responses of krill and cod to artificial light in laboratory experiments. PloS One, 13(1): e0190918. https://doi.org/10.1371/journal.pone.0190918
[7] Yu, M., Liu, C., Zhang, L., Tang, Y. (2022). Application of light-emitting diodes (LEDs) fishing lights to improve catch rates of small-scale trammel net fishery in the Yellow Sea, China. Frontiers in Marine Science, 9: 1036979. https://doi.org/10.3389/fmars.2022.1036979
[8] Kelber, A. (2016). Colour in the eye of the beholder: Receptor sensitivities and neural circuits underlying colour opponency and colour perception. Current Opinion in Neurobiology, 41: 106-112. https://doi.org/10.1016/j.conb.2016.09.007
[9] Caves, E.M., Davis, A.L., Nowicki, S., Johnsen, S. (2024). Backgrounds and the evolution of visual signals. Trends in Ecology & Evolution, 39(2): 188-198. https://doi.org/10.1016/j.tree.2023.09.006
[10] Fogg, L.G., Cortesi, F., Gache, C., Lecchini, D., Marshall, N.J., de Busserolles, F. (2023). Developing and adult reef fish show rapid light-induced plasticity in their visual system. Molecular Ecology, 32(1): 167-181. https://doi.org/10.1111/mec.16744
[11] Bassi, A., Love, O.P., Cooke, S.J., Warriner, T.R., Harris, C.M., Madliger, C.L. (2022). Effects of artificial light at night on fishes: A synthesis with future research priorities. Fish and Fisheries, 23(3): 631-647. https://doi.org/10.1111/faf.12638
[12] Abdulkadir, I., Rumagia, F., Wulandari, T.L., Yusuf, M., Darmawati. (2025). The application of LED-RGB lights on fish aggregating devices in Ternate. Egyptian Journal of Aquatic Biology and Fisheries, 29(3): 947-956.
[13] Li, F., Hua, C., Zhu, Q. (2025). Evaluating the illumination performance of LED fishing lamps with different configurations in Pacific saury fishery. PLoS One, 20(8): e0328676. https://doi.org/10.1371/journal.pone.0328676
[14] Secondi, J., Scriba, M.F., Mondy, N., Lengagne, T. (2023). Artificial light at night decreases the pupillary light response of dark-adapted toads to bright light. Integrative Zoology, 18(5): 867-875. https://doi.org/10.1111/1749-4877.12693
[15] Jesus, J., Teixeira, A., Natário, S., Cortes, R. (2019). Repulsive effect of stroboscopic light barriers on native salmonid (Salmo trutta) and cyprinid (Pseudochondrostoma duriense and Luciobarbus bocagei) species of Iberia. Sustainability, 11(5): 1332.
[16] Xu, J., Sang, W., Dai, H., Lin, C., Ke, S., Mao, J., Wang, G., Shi, X. (2022). A detailed analysis of the effect of different environmental factors on fish phototactic behavior: Directional fish guiding and expelling technique. Animals, 12(3): 240. https://doi.org/10.3390/ani12030240
[17] Lafoux, B., Moscatelli, J., Godoy-Diana, R., Thiria, B. (2023). Illuminance-tuned collective motion in fish. Communications Biology, 6(1): 585. https://doi.org/10.1038/s42003-023-04861-8
[18] Cortesi, F., Mitchell, L.J., Tettamanti, V., Fogg, L.G., de Busserolles, F., Cheney, K.L., Marshall, N.J. (2020). Visual system diversity in coral reef fishes. Seminars in Cell & Developmental Biology, 106: 31-42. https://doi.org/10.1016/j.semcdb.2020.06.007
[19] Marshall, J., Carleton, K.L., Cronin, T. (2015). Colour vision in marine organisms. Current Opinion in Neurobiology, 34: 86-94. https://doi.org/10.1016/j.conb.2015.02.002
[20] Senko, J.F., Peckham, S.H., Aguilar-Ramirez, D., Wang, J.H. (2022). Net illumination reduces fisheries bycatch, maintains catch value, and increases operational efficiency. Current Biology, 32(4): 911-918. https://doi.org/10.1016/j.cub.2021.12.050
[21] Yochum, N., Karlsen, J.D., Senko, J.F., Wang, J.H., et al. (2024). Guidelines for evaluating artificial light to mitigate unwanted fisheries bycatch. Reviews in Fisheries Science & Aquaculture, 32(4): 612-656. https://doi.org/10.1080/23308249.2024.2359417