Abbas Hadi Abbas*![]() | Mohanad J. M-Ridha
| Mohanad J. M-Ridha![]()
© 2025 The authors. This article is published by IIETA and is licensed under the CC BY 4.0 license (http://creativecommons.org/licenses/by/4.0/).
OPEN ACCESS
Bioelectrochemical devices called microbial desalination cells (MDCs) use electroactive microorganisms to produce energy while also desalinating water and cleaning effluent. This research paper aims to treat municipal wastewater anaerobically and desalinate groundwater for Samarra city and generate electricity simultaneously by using lab lab-scale air cathode microbial desalination cell (AMDC) with continuous operation. The three chambers that make up the MDC are made of Perspex tubes and have corresponding volumes of 2833 mL, 1416 mL, and 2833 mL for the anode, desalination, and cathode chambers. The cathode and anode electrodes were both 90 mm × 90 mm × 3 mm graphite plates. Two 25 L plastic tanks were used, one sealed for actual wastewater and the other for actual brackish groundwater. The air pump is set up to supply oxygen to the cathode chamber. The system was operated continuously using an uninterruptible power supply (UPS). A multimeter is also used to measure the electricity using a resistor box of (10-10000 Ω). The system was operated for three runs with Hydraulic retention time (HRT) of 3, 1.5, 0.75 days for wastewater and 1.5, 0.75, 0.375 days for groundwater at flow rates of 0.65, 1.3, and 2.6 mL/min, respectively, with wastewater and groundwater recycle of 100%. the results showed the maximum chemical oxygen demand (COD) removal of wastewater were 77.1, 76.84, and 77.52%, average 62.91, 58.28 and 67.05%, standard deviation 17.19, 16.17 and 8.69, while maximum TDS groundwater removal were 22.74, 19.44, and 29.775% average 18.16, 15.90 and 18.20%, standard deviation 6.33, 2.28 and 10.65 while the maximum generated current were 0.232, 0.300, and 0.536 mA, average 0.17, 0.21 and 0.41 mA, standard deviation 0.039, 0.045 and 0.112 for Run1, Run2 and Run3 respectively at external resistance of 500 Ω. The higher coulombic efficiency, CE, follows the higher HRT, which was 3 days, while no significant difference in CE for HRTs, 1.5 days and 0.75 days. Polarization curves for the three runs showed a maximum power density of 7.674 mW/m2 and a current density of 30.74 mA/m2. The internal resistances were 1000, 1000, and 500 Ω for Run1, Run2, and Run3, respectively.
municipal wastewater, AMDC, COD, coulombic efficiency, Samarra, HRT
Increasing challenges in disposing of wastewater and deteriorating water resources are two major issues growing over the last decades. The pure water supplies would decrease considerably in the near future due to climate change and inappropriate management of wastewater disposal. Hence, the utilization of low-cost wastewater treatment processes or seawater desalination has drawn great attention. Although desalination of saline water is a potential method to produce drinking water, it is not usually recommended since it is so expensive and requires a high energy supply [1-3]. Desalination processes can be classified according to their energy input requirements: reverse osmosis requires 2-7.5 kWh/m3, multi-effect distillation requires 5-28 kWh/m3, mechanical vapor compression requires 7-17 kWh/m3, and multi-stage flash distillation requires 10-48 kWh/m3 [4]. First, it is predicted that there will be a significant increase in the number of saltwater desalination facilities during the next decade, as this method can be utilized to reduce water stress. Alternative desalination methods that use less power are of considerable interest because the current commercial options, such as electrodialysis (ED), electro-deionization (EDI), thermal desalination, and reverse osmosis (RO), are quite energy demanding [5, 6]. For wastewater treatment, activated sludge requires (0.33–0.60 kW/m3), trickling filter processes (0.18–0.42 kW/m3), lagoon (0.09–0.291 kW/m3), and advanced water treatments (0.31–0.40 kW/m3) are all crucial wastewater treatment procedures [2]. Thus, the pursuit of conventional waste treatment methods, alternative energy sources, and tried-and-true water desalination processes has accelerated globally [7, 8].
At Tsinghua University, microbial desalination cells (MDCs), a novel technology for power generation, desalination, and wastewater treatment, were initially created from microbial fuel cells (MFCs) [9]. Similar in concept to water electrodialysis, the MDC is a device that uses bacteria as a catalyst to convert wastewater's chemical energy into electrical power through electrochemical reactions. In order to accomplish desalination, MDC uses an extra chamber that holds salty water between the anode and the cathode. Ion exchange membranes divide the three chambers, enabling the extraction of salt ions. Extended works, such as stacked resin-packed MDC (SR-MDC), have been reported one after the other since MDC was initially created by researchers [9, 10]. The operation of MDCs to desalinate water is based on the idea of bacterial electrolytes, also called exoelectrogens. Exoelectrogens are microorganisms that break down organic matter in wastewater, using the electrons they create to power an anode. To keep the electrical charge balanced, this causes protons to accumulate in the anode chamber, which attracts chloride ions (Cl-) from the desalination chamber. To transfer cations (Na+) from the desalination to the cathode chamber, the process uses electrons supplied at the anode surface to reduce oxidized species (electron acceptors) on the cathode. These methods accomplish three main goals: treating wastewater, generating power, and desalinating saltwater. It is common practice to use Eqs. (1) and (2) to depict the redox reactions in MDC [11, 12].
At the anode:
Substrate $+\mathrm{nH}_2 \mathrm{O} \rightarrow \mathrm{nCO}_2+4 \mathrm{ne}^{-}+4 \mathrm{nH}^{+}$ (1)
At the cathode:
$\mathrm{O}_2+4 \mathrm{ne}^{-}+4 \mathrm{nH}^{+} \rightarrow 2 \mathrm{H}_2 \mathrm{O}$ (2)
Different lab-scale designs of MDC have been explored, such as air cathode, biocathode, capacitive, electrolyte recirculation, photosynthetic, osmotic, stacked, bipolar membrane, ion-exchange, resin-packed, and upflow configurations [13].
In air cathode MDCs, oxygen acts as the electron acceptor at the cathode. The catholyte's dissolved oxygen (cathode chamber) is reduced during the reduction reaction of oxygen (ORR). This reaction is essential for maintaining charge balance, electrons moving from the anode to the cathode due to oxygen, and the reaction ensures proper desalination and energy production [14]. Because it is free, renewable, and ecologically beneficial, and available air has seen extensive application in MDCs [13].
Research on the microbial community, electricity generation, and removal of salt and nitrogen in microbial desalination cells that use air cathodes for treatment of saline-alkaline soil-washing waters was conducted by Xu et al. [15]. Using an air cathode microbial desalination cell (AMDC), which was successfully started by inoculating anaerobic sludge into the anode of a microbial desalination cell, researchers investigated coastal saline-alkaline soil-washing water and the impact of salinity on AMDC performance. The findings revealed that both the desalination cycle and rate progressively decreased with decreasing salinity, but salt removal progressively rose; at 5 g/L salinity, the maximum salt removal was 98.00 ± 0.12%. Although there was no statistically significant variation in the largest removal efficiency, the average coulomb efficiency varied significantly across salinity conditions, and the COD removal efficiency improved as the operation cycle lengthened. As a result, factors such as running time, electric field activity, osmotic pressure, salinity, microbiological activity, etc., all work together to affect salt removal and coulomb efficiency. In contrast, when the same substrate is inoculated into the anode chamber, there are no discernible changes in the COD elimination effect. The AMDC experiment ended with a salt removal rate of 99.13 ± 2.1% when water used to cleanse the desalination chamber's coastal saline-alkaline soil was added.
In 2011, Jacobson et al. [16] investigated how to remove salt efficiently using an upflow microbial desalination cell that runs on a continuously running system and uses an air cathode. In order to remove salt, they created an upflow microbial desalination cell (UMDC) that operates continuously. Over the course of its four months of operation, the UMDC continuously produced bio-electricity and eliminated salts. With an initial salt concentration of 30 g total dissolved solids (TDS)/L, the UMDC removed almost 99% of NaCl from a salt solution with a hydraulic retention time (HRT) of 4 days and a current production of approximately 62 mA. Beyond that, the desalination process obtained a TDS removal rate of either 5.25 g TDS L-1 d-1 (wastewater volume) or 7.50 g TDS L-1 d-1 (salt solution volume), which meets the criteria for drinking water. At 1 and 4 days of HRT, the charge transfer efficiency was 98.6% or 81%, respectively. A peak power density of 30.8 W/m3 was achieved by the UMDC.
In 2016, Zuo et al. [17] examined a modularized filtration air cathode microbial desalination cell for enhanced wastewater treatment and self-driven desalination. A modularized filtration air cathode MDC (FMDC) was constructed in this study using Pt carbon cloths as the cathode and nitrogen-doped carbon nanotube membranes as the filter material. The dilute volume output achieved 82.4%, with the salinity removal reaching 93.6% and chemical oxygen demand (COD) reaching 97.3%, respectively, when real wastewater flowed from the anode to the cathode and then to the middle membrane stack. Boiler additional or industrial cooling was possible with the final dilute conductivity of 68 ± 12 μS/cm and turbidity of 0.41 NTU. Nutrients and other chemicals may be recoverable, as concentrate production was only 17.6% and nearly all phosphate and salt, as well as the majority of nitrogen, were collected. In light of these findings, the modularized F-MDC may find use in enhanced treatment of municipal wastewater and be self-driven.
MDC faces the following challenges: low power generation, membrane fouling and scaling, high internal resistance, biofilm instability and microbial community control, pH imbalance between chambers, high material and operating costs, complicated configuration and scale-up issues, low desalination rate and efficiency, limited long-term stability, use of complex feeds and real wastewater, and lack of standardization and modeling.
MDCs use a spontaneous desalination technique that doesn't require outside power. It simply requires electricity generated by microorganisms that are exoelectrogenic. Exoelectrogens (such as Shewanella, Geobacter, etc.) that grow on the carbonaceous anode in the anode compartment use the organic-rich wastewater as a metabolic substrate. Through metabolic processes that generate electrons that are transported to the anode by bacterial nanowire stacks, cytochrome C, etc., the connected anodic bacteria oxidise the organic materials in wastewater. The biogenerated electrons are then sent to the cathode via an external circuit and load, where they undergo reduction by oxidising agents and electron acceptors (such as oxygen) found in the catholyte. For the cathodic process, electrical currents travel from the bioanode to the cathode, creating a potential gradient between the electrodes. Consequently, the current potential forces the ions (cations and anions) in the centre compartment (desalination chamber) to move through the membranes to the surrounding chambers. This phenomenon results in the desalination [11].
This study aimed to systematically evaluate the impact of HRT on the performance of a continuous-flow AMDC treating real wastewater and groundwater from the city of Samarra, focusing on the synergistic relationship between COD/TDS removal, coulombic efficiency, and power generation, and to explore the feasibility of operating the cathode without a buffer.
2.1 MDC design
The Perspex tube with a diameter of 19 cm was used to produce the continuous air cathode microbial desalination cell (AMDC). The desalination chamber had a capacity of 1.416 L, while the symmetrical anode and cathode chambers each contained 2.833 L. Membrane International, USA, provided the two ion-exchange membrane types that were used: an anion exchange membrane (AEM, model AMI-7001) and a cation exchange membrane (CEM, model CMI-7000). The CEM separated the cathode and desalination chambers, while the AEM separated the anode and desalination chambers.
On either side of the AMDC, two perforated Perspex plates were sandwiched between the membranes (AEM and CEM). 60 cm² was the membrane's surface area. To ensure membrane hydration and expansion, membranes were soaked in a 5% NaCl solution for 24 hours prior to being rinsed with distilled water, as directed by the supplier.
As electrodes, two graphite plates measuring 9 cm × 9 cm × 0.3 cm were employed. The electrodes were connected to an external resistance by copper cables with sealed terminals. The system was operated continuously using an uninterruptible power supply (UPS). To control and monitor external resistance, a resistor box (10 Ω, 100 Ω, 500 Ω, 1000 Ω, 5000 Ω, and 10,000 Ω) and a digital multimeter (Aswar, AS-M860D series) were used in parallel.
Two 25 L plastic tanks were used, one sealed for actual wastewater and the other for actual brackish groundwater. The two tanks were connected to a peristaltic pump model BT600S with a pump head of two channels (made in China) for pumping the wastewater to the anode chamber and brackish water to the desalination chamber with the required flow rate continuously. Anode and desalination chambers' effluent pipes were connected to 2 L plastic bottles for collecting and recycling effluent wastewater and groundwater.
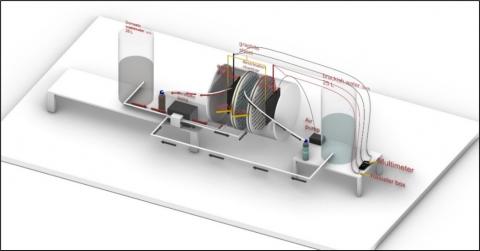
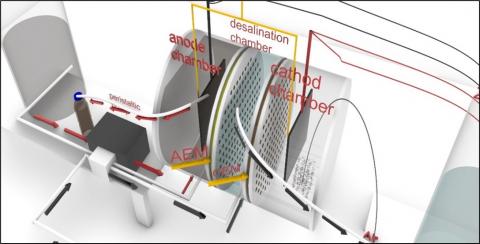
The input and outflow ports on each chamber had a diameter of 0.5 cm. An air pump (RS 610, China; air discharge of 3.5 L/min) could be used to provide dissolved oxygen through the cathode chamber's inlet. To preserve anaerobic conditions, the anode compartment was sealed from the surrounding air. Figure 1(a, b, and c) displays a schematic plan and an image of the AMDC system employed in this investigation.
(a)
(b)
(c)
Figure 1. (a) Photo of the AMDC system; (b) a schematic diagram of the AMDC system; (c) enlarged schematic diagram of the AMDC system used in this study
2.2 Measurements of water quality
The dissolved oxygen (DO) in the anolyte, catholyte, and desalination chamber, as well as the chemical oxygen demand (COD), total dissolved solids (TDS), pH, and temperature in the desalination chamber, were all measured using Standard Methods for the Examination of Water and Wastewater [18]. Equipment used included the COD Photometer (HANNA, Model HI97106), the COD Thermo-Reactor (HANNA, Model HI839800-02), the TDS/pH/Temperature meter (HANNA, Model HI9811–51), and the D.O. meter (HANNA, Model HI9146). All of the gadgets were made by HANNA Instruments in Romania.
2.3 Calculations of power and coulombic efficiency
The following formulas were used to determine power density:
$\mathrm{P}=\left(\mathrm{V}_{\text {cell }}\right)^2 /\left(\mathrm{R}_{\text {ext }} \times \mathrm{A}_{\text {An }}\right)$ (3)
$\mathrm{I}=\mathrm{V}_{\text {cell }} / \mathrm{R}_{\text {ext }}$ (4)
where, I is the current (A), $\mathrm{R}_{\mathrm{ext}}$ is the external resistance ($\Omega$), $\mathrm{V}_{\text {cell }}$ is the cell voltage (V), P is the power density (W/m2), and $\mathrm{A}_{\mathrm{An}}$ is the anode surface area (m2) [19].
Coulombic efficiency (CE) is the percentage of electrons that are recovered from the substrate as electrical current, and it was computed as follows:
$\mathrm{CE}=\frac{\mathrm{MI}}{\mathrm{Fb} \mathrm{q} \Delta \mathrm{COD}} \times 100 \%$ (5)
where, M is the molecular weight of oxygen (32 g/mol); I is the electric stream in amperes; Faraday's constant (F) is 96,485 C/mol; q is the volumetric flow rate in L/s; $\triangle \mathrm{COD}$ is the difference between the influent and effluent COD given as (g/L); and b is the electron numbering mutual per mole of oxygen (4 mol e-/mol O2) [20].
2.4 Experimental work
To assess AMDC's performance, three continuous runs were carried out, as Run1 used real wastewater (Anolyte), with an initial COD of 709 mg/L (HRT = 3 days), with 100% wastewater recycle, and initial groundwater TDS of 4220 mg/L (HRT = 1.5 days), flow rate = 0.65 mL/min. Run2 used real wastewater (Anolyte) with an initial COD of 1179 mg/L, (HRT = 1.5 days) with 100% wastewater recycle, and initial groundwater TDS of 3960 mg/L (HRT = 0.75 days), flow rate = 1.3 mL/min. Run3 used real wastewater (Anolyte) with an initial COD of 743 mg/L (HRT = 0.75 days) with 100% wastewater recycle, and initial groundwater TDS of 3560 mg/L (HRT = 0.375 days), flow rate = 2.6 mL/min. Anaerobic sludge was directly used from the Samarra wastewater treatment plant as inoculum and bacterial seeding with a ratio of 10% of the anode chamber volume. Without a buffer solution, deionized water was utilized as the catholyte.
3.1 Anolyte COD removal and coulombic efficiency
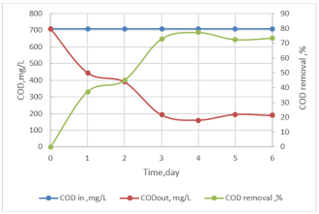
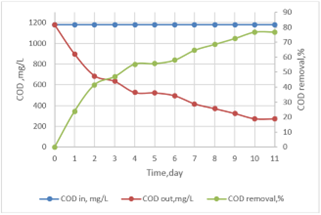
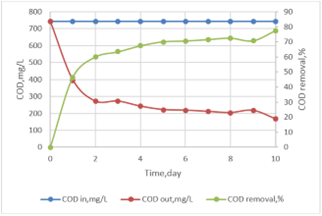
HRT mainly controls the duration (retention time) at which all the reactions occur in the chambers of the MDC cell [21]. As shown in Figures 2-4, the maximum COD removal was 77.1%, 76.84%, and 77.52%, average 62.91%, 58.28% and 67.05%, standard deviation 17.19, 16.17, and 8.69, for HRT 3, 1.5, and 0.75 days, respectively. from these results, there are no significant differences in COD removal efficiencies among the three HRTs. According to certain research, hydraulic retention time (HRT) has no effect on COD reduction in MDCs [22, 23]. This may be attributed to the microbial community structure adapted. Studies offered some support for this assertion. In Luo et al.’s [22] research, in roughly 8 days, a notable 52% COD removal from wastewater with a starting COD content of 2744 ± 16 mg/L was accomplished; nevertheless, in the subsequent investigation of Luo et al. [23], Even after 8 months of operation, the percentage COD elimination increased by only 3% (from 52 to 55%). A similar finding was also made by Qu et al. [24] in their investigation of multiple MDCs. There was only a 1% difference in COD decrease between the two HRTs in that trial. There was just a 1% difference between the COD reductions from 48 and 24 hours of HRT: 60 ± 2% and 59 ± 2%, respectively. HRT may therefore not have as much of an impact on COD decreases as other parameters, such as the baseline COD concentration [24, 25].
The quantity of electrons that may be obtained from the substrate to generate an electrical current is known as the coulombic efficiency. It is defined as the ratio of the electrons that the substrate really received to the electrons that the bacterium theoretically obtained based on the elimination of COD [26].
Figure 2. COD influent, effluent, and removal for anolyte, Run1
Figure 3. COD influent, effluent, and removal for anolyte, Run2
Figure 4. COD influent, effluent, and removal for anolyte, Run3
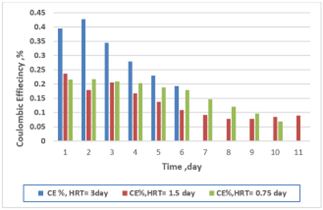
Figure 5 shows the profile of coulombic efficiency, CE%, for the three runs. the higher CE fellows had the higher HRT, which was 3 days, while no significant difference in CE for HRT, 1.5 days, and 0.75 days. Sorgato et al. [27] stated that in HRT 12, 8, and 4 hours, the CE was 5.44, 2.23, and 1.12%, respectively. Yamane et al. [28] showed that at HRT 3, 6, 12, and 18 h, the CE was 13 ± 3.3%, 14 ± 3.2%, 19 ± 2.7% and 12 ± 3.4%, respectively, with also notice that no essential differences in CE. A limited quantity of oxidized substrates was accessible as electron donors for power generation, despite the fact that Sorgato et al. [27] imply that a high number of substrates may be used for anaerobic biodegradation. Therefore, low densities of anode-respiring microorganisms in the anodic biofilm, which result from bacterial competition for space and decreased power density, can be the cause of a low CE. Furthermore, the CE has an inverse relationship with the COD removal and substrate flow rate [29, 30].
Figure 5. Coulombic efficiencies with respect to HRT
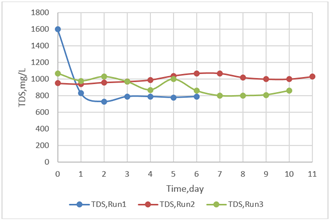
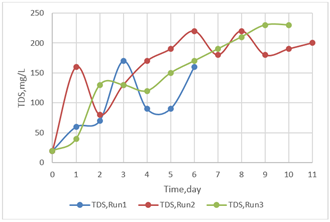
3.2 TDS removal
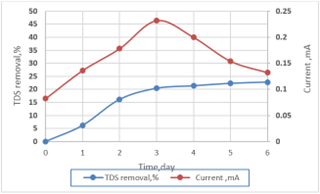
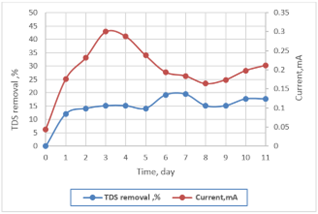
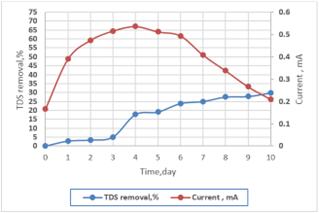
Figures 6-8 show the TDS removal with respect to HRT and current generation. The maximum TDS removal for Run1, Run2, and Run3 were 22.74, 19.44, and 29.77%, average 18.16, 15.90, and 18.20%, standard deviation 6.33, 2.28, and 10.65, while the maximum generated current was 0.232, 0.300, and 0.536 mA, average 0.17, 0.21, and 0.41 mA, standard deviation 0.039, 0.045, and 0.112, respectively. This corresponds with the study of Luo et al. [23] of air cathode MDC with desalination efficiency of 29% and 13% [31]. Low TDS removal may be attributed to low current generation. Numerous parameters, including membrane surface area, microbial oxidation and oxygen reduction, wastewater and salt solution volumes, HRTs of wastewater and salt solution, and more, influence the TDS removal rate. Since a longer retention time will allow more salts to be involved in the current generation, and subsequently be eliminated. The HRT of salt solution has a significant impact on the removal of TDS [16]. Higher power densities in the MDC can result from a shorter HRT, according to Imoro et al. [25]. This is due to the fact that a shorter HRT can lessen the buildup of fermentation products, which can impede the growth of microorganisms and the production of energy. According to Ping and He [32], desalination performance increases with decreasing HRT and decreasing internal resistance [31].
Figure 6. TDS removal with current for Run1, HRT = 1.5 day
Figure 7. TDS removal with current for Run2, HRT = 0.75 day
Figure 8. TDS removal with current for Run3, HRT = 0.375 day
3.3 Power generation and polarization curves
Figure 9 shows the current and power densities for the three continuous runs at an external resistance of 500 Ω. The maximum results of current and power density for Run1 (HRT = 3 days), were 14.32 mA/m2, 1.66 mW/m2, for Run2 (HRT = 1.5 days) 18.51 mA/m2, 2.77 mW/m2, and for Run3 (HRT = 0.75 days) 33.086 mA/m2 and 8.9 mW/m2. These results corresponded with the study of Castellano-Hinojosa et al. [33] and Sharma and Li [34]. At shorter HRT, the wastewater discharge increases, which means more substrate is provided to microorganisms per unit time, while at longer HRT allows microorganisms to have excessive time to degrade substrate. Sharma and Li [34] attributed the low power density at long HRT was probably caused by the deficiency of organic substrates. However, Castellano-Hinojosa et al. [33] ascribed the low power in longer HRT to cell metabolism declines and/or electrode fouling brought on by cell death or disintegration at a longer HRT.
Figure 9. Current and power density for the three runs
They attributed the lower HRT-favored increases in the abundance of bacterial communities, and that exoelectrogenic bacteria may have a greater ability to colonize anodes than other microbial communities, which favors rapid electron transfer at lower HRT.
Polarization curves are essential in describing the performance of AMDC systems. Polarization curves are an effective method for describing and analyzing the performance of PMDC systems. Maximum available current and power were generated when the external and internal resistances were equal [35].
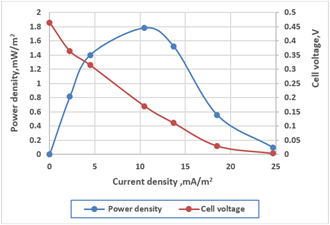
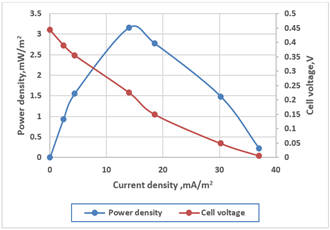
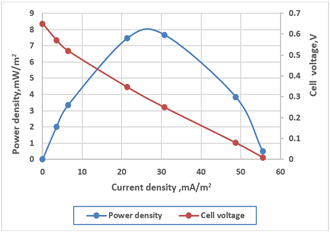
All polarization curves were obtained using external resistances in the range of 10-10000 Ω. The plots of polarization curves are given in Figures 10-12. Table 1 presents the maximum current and power densities obtained from the corresponding polarization curves. The obtained internal resistance for Run1, Run2, and Run3 were 1000,1000, and 500 Ω, respectively.
Table 1. Maximum power density and internal resistance from polarization curves for three runs
|
Run |
HRT, Day |
Maximum Current Density, mA/m2 |
Maximum Power Density, mW/m2 |
Cell Voltage, V |
Internal Resistance, Ω |
|
1 |
3 |
10.493 |
1.78 |
0.17 |
1000 |
|
2 |
1.5 |
13.95 |
3.152 |
0.226 |
1000 |
|
3 |
0.75 |
30.74 |
7.674 |
0.249 |
500 |
Figure 10. Polarization curve for Run1
Figure 11. Polarization curve for Run2
Figure 12. Polarization curve for Run3
From Figures 10-12 and Table 1, the highest possible power density of 7.674 mW/m2 as well as a current density of 30.74 mA/m2 were accomplished at an internal resistance of 500 Ω, indicating that the system operated most efficiently under those conditions with HRT = 0.75 day. The low power density may be attributed to the high internal resistance of the cathode due to the lack of a buffer.
3.4 Temperature, pH, and dissolved oxygen concentration monitoring
During this study temperature and pH of anolyte wastewater, groundwater, and catholyte for Run1, Run2, and run3, respectively, and also dissolved oxygen (D.O.) for catholyte to the three runs were monitored. Table 2 shows the ranges of these parameters.
Table 2. Temperature, pH, and dissolved oxygen ranges with respect to three runs
|
Parameter |
Run1 |
Run2 |
Run3 |
||||||
|
Anolyte |
Brackish |
Catholyte |
Anolyte |
Brackish |
Catholyte |
Anolyte |
Brackish |
Catholyte |
|
|
Temp., °C |
25-27.9 |
24.7-27.6 |
25.0-27.8 |
19.1-28.6 |
19.0-28.6 |
18.9-28.4 |
26.2-31.7 |
26-31.4 |
26.5-31.4 |
|
pH |
7.6-8.0 |
7.4-7.8 |
7.7-8.3 |
7.3-7.8 |
7.4-8.1 |
7.5-8.0 |
7.5-8.1 |
7.3-8.0 |
7.2-8.1 |
|
D.O., mg/L |
|
|
6.24-7.18 |
|
|
6.29-7.91 |
|
|
6.05-6.77 |
From Table 2, the wastewater (anolyte) temperature was (25-27.9), (19.1-28.6), and (26.2-31.7)℃, respectively. At the ideal mesophilic temperature (35-40℃), more COD elimination. The COD removal efficiency increased from 62 to 84% when the temperature was raised from 20 to 40℃. With a COD removal efficacy of over 60% at lower temperatures (20℃) and thermophilic temperatures (>40℃), MFC demonstrated its capacity to operate over a larger temperature range. A reduced rate of organic matter breakdown at lower working temperatures (20-30℃) could account for less COD removal [36]. With respect to the groundwater temperature, low temperature led to low desalination removal. Ragab et al. [37] reported that desalination removal was 32.5, 26.5, and 16.5% at 45, 27, and 12℃, respectively, and that corresponds with this study.
The catholyte dissolved oxygen concentration was in agreement with the study of Imoro et al. [38]. Which were D.O. 7.60 ± 1.0 mg/L at 28 ± 1.10℃ and D.O. 7.70 ± 1.51 mg/L at 28 ± 1.19℃.
pH of anolyte and catholyte during the operation of three runs were within acceptable limits and was corresponding with the study of Jaroo et al. [39] whom stated that the pH decreased when H+ ions accumulated in the anode chamber as a result of bacteria biodegrading the substrate, while the pH rose when H+ ions were depleted in the cathode chamber as a result of oxygen stimulation. According to studies, MDCs do best in a pH range of 6.5 to 8.0, which is regarded as neutral to slightly alkaline. The development and activity of the electrogenic bacteria in the anode chamber may be inhibited by acidic circumstances if the pH falls below 6.0, which would lower the overall rate of electron transfer and power generation. Conversely, if the pH rises too high (over 8.5), minerals like calcium carbonate and magnesium hydroxide may precipitate and block the anode chamber, decreasing the electrode conductivity and water flow rate. Thus, in order to guarantee optimum performance and output, it's critical to maintain the ideal pH range in MDCs [31].
3.5 TDS in anolyte and catholyte
Figure 13 shows a decrease in anolyte TDS for Run1 and Run3, and a slight increase in TDS for Run2 with respect to initial anolyte TDS, and Figure 14 shows an increase in catholyte TDS with time evolution. The decrease in anolyte TDS and the increase in catholyte TDS corresponded with the study of Pradhan et al. [40]. A decrease in anolyte TDS occurs due to migration of cations from anolyte to catholyte and also consumption in the anodic oxidation reaction. while increasing in anolyte TDS was in agreement with the study of Majumder et al. [41]. Pradhan et al. [40] attributed the increase in anolyte TDS was due to the migration of anions from the desalination chamber to the anode chamber via AEM. Also, the increase in catholyte was due to the transport of cations from the desalination chamber toward the cathode chamber by CEM.
Figure 13. TDS in anolyte with time evolution
Figure 14. TDS in catholyte with time evolution
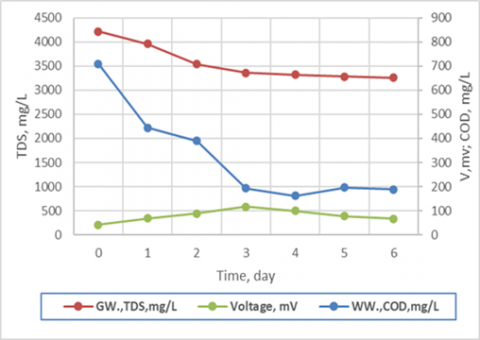
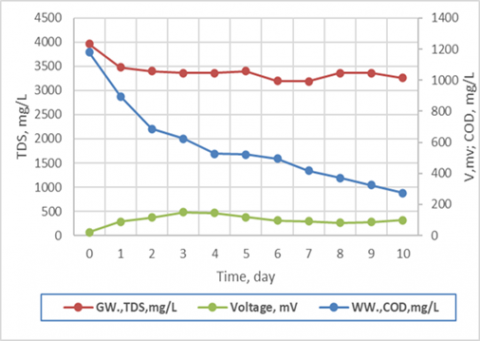
3.6 MDC long-term performance
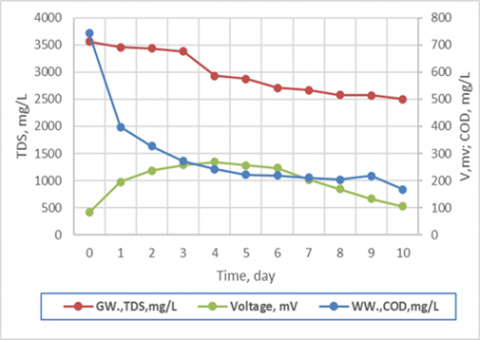
Figures 15-17 show a timeseries for wastewater COD, groundwater TDS, and generated voltage for Run1, Run2, and Run3, respectively.
Figure 15. Wastewater COD, groundwater TDS, and generated voltage for Run1
Figure 16. Wastewater COD, groundwater TDS, and generated voltage for Run2
Figure 17. Wastewater COD, groundwater TDS, and generated voltage for Run3
For Run1, COD decreases from 709 to 189 mg/L, TDS decreases from 4220 to 3260 mg/L during six days of operation, while generated voltage increases from 41 to 116 mV during three days, then decreases to 66 mV at the six days. For Run2, COD decreases from 1179 to 273 mg/L, TDS decreases from 3960 to 3260 mg/L during eleven days of operation, while generated voltage increases from 22 to 150 mV during three days, then decreases to 106 mV at the eleventh day. For Run3, COD decreases from 743 to 167 mg/L, TDS decreases from 3560 to 2500 mg/L during ten days of operation, while generated voltage increases from 83 to 269 mV during four days, then decreases to 105 mV at the ten days. Generally, MDC performance reduces with time as a result of electrode degradation, biofouling, and salt accumulation.
Microbial desalination cells (MDCs), a cutting-edge green technology, combine brackish water desalination, wastewater treatment, and renewable energy production into a single, eco-friendly system. By using the metabolic activity of electroactive microorganisms to oxidize organic molecules, these systems produce electrons at the anode. By facilitating the transfer of salts through ion-exchange membranes, the generated electrical potential aids in the desalination of salt water.
The lab-scale AMDC was operating in continuous mode conditions for the treatment of actual municipal wastewater and desalination of real groundwater of Samarra city in Iraq. Air was used in the cathode chamber with distilled water as catholyte without a buffer solution to avoid the use of chemicals for economic and environmental issues.
Three runs with three HRTs were used to assess the three-chamber AMDC system: 3, 1.5, and 0.75 days for the anode chamber and three HRTs: 1.5, 075, and 0.375 days for the desalination chamber with a recycle of 100%. To evaluate COD removal, TDS removal, and electricity generation.
Wastewater COD removal for the three runs was 77.1%, 76.84%, and 77.52% and it is concluded that there are no significant differences in COD removal efficiencies among the three HRTs.
Groundwater TDS removal for the three runs was 22.74%, 19.44%, and 29.77% and it is concluded that Lower HRT leads to a higher desalination rate.
Higher generation power density is concluded in the polarization curve, which is 7.674 mW/m2, and achieved in Lower HRT. Low desalination rate with low power generation in this study is observed. and based on this, future studies are recommended to improve the results (such as optimizing membrane structure, using catalysts, studying membrane pollution control strategies, etc.
The authors would like to thank the University of Baghdad for supporting this work.
[1] Ebrahimi, A., Yousefi Kebria, D., Najafpour Darzi, G. (2017). Enhancing biodegradation and energy generation via roughened surface graphite electrode in microbial desalination cell. Water Science and Technology, 76(5): 1206-1214. https://doi.org/10.2166/wst.2017.280
[2] Abd-almohi, H.H., Alismaeel, Z.T., M-Ridha, M.J. (2022). Broad-ranging review: Configurations, membrane types, governing equations, and influencing factors on microbial desalination cell technology. Journal of Chemical Technology & Biotechnology, 97(12): 3241-3270. https://doi.org/10.1002/jctb.7176
[3] Ismail, Z.Z., Ibrahim, M.A. (2015). Brackish water desalination coupled with wastewater treatment and electricity generation. Journal of Engineering, 21(5): 35-44. https://doi.org/10.31026/j.eng.2015.05.03
[4] Zahid, M., Savla, N., Pandit, S., Thakur, V.K., Jung, S.P., Gupta, P.K., Prasad, R., Marsili, E. (2022). Microbial desalination cell: Desalination through conserving energy. Desalination, 521: 115381. https://doi.org/10.1016/j.desal.2021.115381
[5] Shehab, N.A., Amy, G.L., Logan, B.E., Saikaly, P.E. (2014). Enhanced water desalination efficiency in an air-cathode stacked microbial electrodeionization cell (SMEDIC). Journal of Membrane Science, 469: 364-370. https://doi.org/10.1016/j.memsci.2014.06.058
[6] Sadeq, A.M., Ismail, Z.Z. (2024). Microalgae growth in a biocathode-photosynthesis microbial desalination cell: molecular characterization, modeling study, and performance evaluation. Iraqi Journal of Chemical and Petroleum Engineering, 25(1): 1-12. https://doi.org/10.31699/IJCPE.2024.1.1
[7] Ali, Q.A., Alhares, H.S., Abd-almohi, H.H., M-Ridha, M.J., Mohammed, S.J., Jabbar, Z.H. (2024). Enhancing microbial desalination cell performance for water desalination and wastewater treatment: Experimental study and modelling of electrical energy production in open and closed-circuit modes. Journal of Chemical Technology & Biotechnology, 99(1): 294-306. https://doi.org/10.1002/jctb.7538
[8] Ismail, Z.Z., Jaeel, A.J. (2013). Sustainable power generation in continuous flow microbial fuel cell treating actual wastewater: Influence of biocatalyst type on electricity production. The Scientific World Journal, 2013(1): 713515. https://doi.org/10.1155/2013/713515
[9] Cao, X., Huang, X., Liang, P., Xiao, K., Zhou, Y., Zhang, X., Logan, B.E. (2009). A new method for water desalination using microbial desalination cells. Environmental Science & Technology, 43(18): 7148-7152. 1 https://doi.org/10.1021/es901950j
[10] Xu, C., Lu, J., Zhao, Z., Lu, X., Zhang, Y., Cheng, M., Zhang, J. (2020). Simultaneous bioelectricity generation, desalination, organics degradation, and nitrogen removal in air–cathode microbial desalination cells. SN Applied Sciences, 2(2): 212. https://doi.org/10.1007/s42452-020-1939-5
[11] Al Balushi, N.J., Nayak, J.K., Rahman, S., Ahmad, S., Al-Mamun, A. (2022). A comprehensive study on air-cathode limitations and its mitigation strategies in microbial desalination cell—A review. Energies, 15(20): 7459. https://doi.org/10.3390/en15207459
[12] Jaeel, A.J., Al-wared, A.I., Ismail, Z.Z. (2016). Prediction of sustainable electricity generation in microbial fuel cell by neural network: effect of anode angle with respect to flow direction. Journal of Electroanalytical Chemistry, 767: 56-62. https://doi.org/10.1016/j.jelechem.2016.02.015
[13] Al-Mamun, A., Ahmad, W., Baawain, M.S., Khadem, M., Dhar, B.R. (2018). A review of microbial desalination cell technology: Configurations, optimization and applications. Journal of Cleaner Production, 183: 458-480. https://doi.org/10.1016/j.jclepro.2018.02.054
[14] Kim, Y., Logan, B.E. (2013). Microbial desalination cells for energy production and desalination. Desalination, 308: 122-130. https://doi.org/10.1016/j.desal.2012.07.022
[15] Xu, C., Lu, J., Zhao, Z., Zhang, Y., Zhang, J. (2020). Electricity generation, salt and nitrogen removal and microbial community in aircathode microbial desalination cell for saline-alkaline soil-washing water treatment. Water, 12(8): 2257. https://doi.org/10.3390/w12082257
[16] Jacobson, K.S., Drew, D.M., He, Z. (2011). Efficient salt removal in a continuously operated upflow microbial desalination cell with an air cathode. Bioresource Technology, 102(1): 376-380. https://doi.org/10.1016/j.biortech.2010.06.030
[17] Zuo, K., Wang, Z., Chen, X., Zhang, X., Zuo, J., Liang, P., Huang, X. (2016). Self-driven desalination and advanced treatment of wastewater in a modularized filtration air cathode microbial desalination cell. Environmental Science & Technology, 50(13): 7254-7262. https://doi.org/10.1021/acs.est.6b00520
[18] APHA-AWWA-WEF, Standard Methods for the Examination of Water and Wastewater, 23rd ed. American Public Health Association, 2017.
[19] Ismail, Z.Z., Habeeb, A.A. (2015). Pharmaceutical wastewater treatment associated with renewable energy generation in microbial fuel cell based on mobilized electroactive biofilm on zeolite bearer. Journal of Engineering, 21(7): 35-44. https://doi.org/10.31026/j.eng.2015.07.03
[20] Radeef, A.Y., Najim, A.A. (2024). Microbial fuel cell: The renewable and sustainable magical system for wastewater treatment and bioenergy recovery. Energy 360, 1: 100001. https://doi.org/10.1016/j.energ.2024.100001
[21] Jingyu, H., Ewusi-Mensah, D., Norgbey, E. (2017). Microbial desalination cells technology: A review of the factors affecting the process, performance and efficiency. Desalination and Water Treatment, 87: 140-159. https://doi.org/10.5004/dwt.2017.21302
[22] Luo, H., Xu, P., Roane, T.M., Jenkins, P.E., Ren, Z. (2012). Microbial desalination cells for improved performance in wastewater treatment, electricity production, and desalination. Bioresource Technology, 105: 60-66. https://doi.org/10.1016/j.biortech.2011.11.098
[23] Luo, H., Xu, P., Ren, Z. (2012). Long-term performance and characterization of microbial desalination cells in treating domestic wastewater. Bioresource Technology, 120: 187-193. https://doi.org/10.1016/j.biortech.2012.06.054
[24] Qu, Y., Feng, Y., Liu, J., He, W., Shi, X., Yang, Q., Lv, J., Logan, B.E. (2013). Salt removal using multiple microbial desalination cells under continuous flow conditions. Desalination, 317: 17-22. https://doi.org/10.1016/j.desal.2013.02.016
[25] Imoro, A.Z., Mensah, M., Buamah, R. (2021). Developments in the microbial desalination cell technology: A review. Water-Energy Nexus, 4: 76-87. https://doi.org/10.1016/j.wen.2021.04.002
[26] Ebrahimi, A., Najafpour, G., Kebria, D. (2016). Effect of batch vs. continuous mode of operation on microbial desalination cell performance treating municipal wastewater. Hydrogen, Fuel Cell & Energy Storage, 3(4): 281-290. https://doi.org/10.22104/ijhfc.2016.473
[27] Sorgato, A.C., Jeremias, T.C., Lobo, F.L., Lapolli, F.R. (2023). Microbial fuel cell: Interplay of energy production, wastewater treatment, toxicity assessment with hydraulic retention time. Environmental Research, 231: 116159. https://doi.org/10.1016/j.envres.2023.116159
[28] Yamane, T., Yoshida, N., Sugioka, M. (2021). Estimation of total energy requirement for sewage treatment by a microbial fuel cell with a one-meter air-cathode assuming Michaelis–Menten COD degradation. RSC Advances, 11(33): 20036-20045. https://doi.org/10.1039/D1RA03061B
[29] Radeef, A.Y., Ismail, Z.Z. (2022). Reclamation of actual automobile wash wastewater combined with energy recovery in 3D-microbial fuel cell packed with acid-activated multi walled carbon nanotubes coated anode. Separation and Purification Technology, 286: 120455. https://doi.org/10.1016/j.seppur.2022.120455
[30] Radeef, A.Y., Ismail, Z.Z. (2018). Biotreatment of actual potato chips processing wastewater with electricity generation in microbial fuel cell. Journal of Engineering, 24(12): 26-34. https://doi.org/10.31026/j.eng.2018.12.03
[31] Mohammadi, M., Fazeli, F., Baghsheikhi, M. (2024). Enhancing water desalination and power generation in microbial desalination cells: A comprehensive review of effective parameters and structural types for optimal performance. Journal of Power Sources, 602: 234267. https://doi.org/10.1016/j.jpowsour.2024.234267
[32] Ping, Q., He, Z. (2014). Effects of inter-membrane distance and hydraulic retention time on the desalination performance of microbial desalination cells. Desalination and Water Treatment, 52(7-9): 1324-1331. https://doi.org/10.1080/19443994.2013.789406
[33] Castellano-Hinojosa, A., Gallardo-Altamirano, M.J., Pozo, C., González-Martínez, A., González-López, J. (2024). Hydraulic retention time drives changes in energy production and the anodic microbiome of a microbial fuel cell (MFC). Journal of Water Process Engineering, 59: 104966. https://doi.org/10.1016/j.jwpe.2024.104966
[34] Sharma, Y., Li, B. (2010). Optimizing energy harvest in wastewater treatment by combining anaerobic hydrogen producing biofermentor (HPB) and microbial fuel cell (MFC). International Journal of Hydrogen Energy, 35(8): 3789-3797. https://doi.org/10.1016/j.ijhydene.2010.01.042
[35] Sadeq, A.M., Ismail, Z.Z. (2023). Sustainable application of tubular photosynthesis microbial desalination cell for simultaneous desalination of seawater for potable water supply associated with sewage treatment and energy recovery. Science of the Total Environment, 875: 162630. https://doi.org/10.1016/j.scitotenv.2023.162630
[36] Behera, M., Murthy, S.S.R., Ghangrekar, M.M. (2011). Effect of operating temperature on performance of microbial fuel cell. Water Science and Technology, 64(4): 917-922. https://doi.org/10.2166/wst.2011.704
[37] Ragab, M., Elawwad, A., Abdel-Halim, H. (2019). Evaluating the performance of microbial desalination cells subjected to different operating temperatures. Desalination, 462: 56-66. https://doi.org/10.1016/j.desal.2019.04.008
[38] Imoro, A.Z., Mensah, M., Buamah, R. (2021). A factorial study of the effect of rhamnolipid and stirring on the electricity production, desalination, and wastewater treatment efficiencies of a five-chamber microbial desalination cell. Journal of Renewable Energy and Environment, 8(2): 54-60. https://doi.org/10.30501/jree.2020.243765.1137
[39] Jaroo, S.S., Jumaah, G.F., Abbas, T.R. (2021). The operation characteristics of air cathode microbial desalination cell to treat oil refinery wastewater. IOP Conference Series: Earth and Environmental Science, 877(1): 012002. https://doi.org/10.1088/1755-1315/877/1/012002
[40] Pradhan, H., Jain, S.C., Ghangrekar, M.M. (2015). Simultaneous removal of phenol and dissolved solids from wastewater using multichambered microbial desalination cell. Applied Biochemistry and Biotechnology, 177(8): 1638-1653. https://doi.org/10.1007/s12010-015-1842-5
[41] Majumder, S., BM, S.M., BM, P. (2023). Impact of different electrodes, mediators, and microbial cultures on wastewater treatment and power generation in the microbial desalination cell (MDC). Water Science & Technology, 88(12): 3194-3225. https://doi.org/10.2166/wst.2023.406