Muhammad Apriliansyah Rahmadhani![]() | Ermatita*
| Ermatita*![]() | Deris Stiawan
| Deris Stiawan![]()
© 2025 The authors. This article is published by IIETA and is licensed under the CC BY 4.0 license (http://creativecommons.org/licenses/by/4.0/).
OPEN ACCESS
The General Election (PEMILU) in Indonesia utilizes the Recapitulation Information System (SIREKAP) to accelerate and improve the accuracy of vote counting. However, the system often fails to recognize numbers on C1 sheets due to handwriting variations, low image quality, and visual disturbances. This study develops a Convolutional Neural Network (CNN) to classify digits 0–9 and the letter X, which are frequently misread. The dataset was collected from 300 respondents who rewrote numbers with seven variations: bold, right italic, left italic, crumpled paper, subscript, superscript, and upside down. A total of 3,850 images were generated and divided into 70% training, 15% validation, and 15% testing. Four CNN configurations were compared: standard, with L1 regularization, L2 regularization, and Elastic Net (L1+L2). The standard CNN achieved 94.92% training accuracy, 72.91% validation, and 69.88% testing. The L1 model showed overfitting with 91.99% training but only 59.72% testing accuracy. L2 regularization improved results with 92.47% training and 75.84% testing accuracy. Elastic Net achieved the best balance, reaching 95.51% training, 71.74% validation, and 77.89% testing accuracy. These findings highlight the effectiveness of Elastic Net in enhancing generalization and reducing misclassification, thereby supporting more reliable election vote recapitulation.
Convolutional Neural Network, Recapitulation Information System (SIREKAP), handwritten digit recognition, L1 regularization, L2 regularization, Elastic Net
The vote counting process in the Indonesian General Election (PEMILU) is a crucial stage in the democratic system, as it determines the final outcome of the people’s representation in government institutions. One of the key components of this process is the C1 form, an official document that records vote counts directly from each Polling Station (TPS). This form serves as the primary source for data entry into the General Elections Commission (KPU) electronic system, the Recapitulation Information System (SIREKAP). [1]. The system is designed to enhance the efficiency and transparency of the national vote recapitulation by using the C1 form as the main reference for digitizing handwritten vote data, which can be supported by CNN-based recognition methods to improve accuracy [2].
However, in practice, several challenges are frequently encountered during technical implementation, hindering the accuracy and reliability of the vote digitization process. One of the main issues is the system’s failure to recognize the numbers recorded on the C1 form [3]. This problem generally arises from both technical and non-technical factors, such as inconsistent handwriting by officers, low-quality printouts or scans, and visual artifacts including scratches, ink stains, creases, or inadequate lighting during image capture [3]. These conditions make it difficult for the system to correctly interpret the numbers, potentially resulting in errors in the vote recapitulation and directly affecting the validity and integrity of the election [4].
The misinterpretation of numbers on the C1 form is not merely a technical challenge but also undermines public confidence in the election results. When the system fails to recognize a number, corrections must be performed manually by officials, which consumes additional time and effort and introduces the risk of inconsistencies due to human intervention. Therefore, developing a technology-driven solution capable of addressing this problem automatically and accurately, even under complex visual conditions, is essential [4].
Convolutional Neural Networks (CNNs) are a deep learning method that has proven highly effective in digital image processing and visual pattern recognition. CNNs are specifically designed to extract hierarchical features from images, ranging from simple edges and lines to more complex structures such as numbers and letters. Previous studies have demonstrated the effectiveness of CNNs in handwritten character recognition, including digit classification using the MNIST dataset [5], recognition of Arabic script [6], and modern OCR applications on noisy documents [7]. In the electoral context, CNNs have been increasingly applied to improve the accuracy of document digitization, particularly in processing voting result forms in several countries [8]. This highlights the relevance of applying CNNs in the context of SIREKAP to address the challenge of misreading numbers on C1 forms [9-12].
This study was carried out by developing and training a CNN model using handwritten data designed to replicate the appearance of digits 0–9 and the letter X, which are often misread by SIREKAP. The dataset was collected from 300 respondents, each producing seven variations of writing styles—bold, right italic, left italic, subscript, superscript, reversed, and crumpled paper—with 550 samples for each variation, resulting in a total of 3,850 images. The primary objective of this research is to reproduce the characteristics of handwritten numbers that are prone to recognition errors, enabling the CNN model to classify digits more accurately, minimize the need for manual correction, and ultimately enhance the integrity and efficiency of Indonesia’s election vote recapitulation system [13-16].
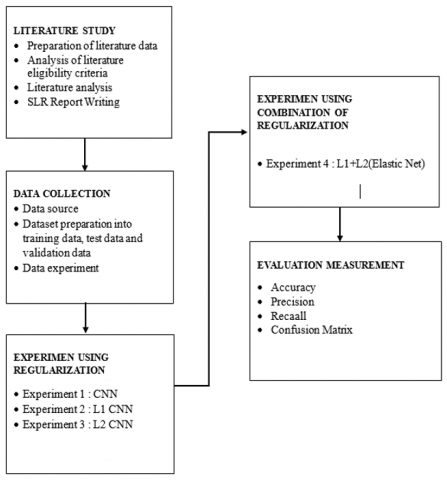
This research began with a structured literature review to establish a strong theoretical foundation on the Convolutional Neural Network (CNN) method and the application of regularization techniques in image processing [17-20]. The next stage involved collecting image data representing unreadable numbers in the Recapitulation Information System (SIREKAP), which was then systematically processed and divided into three subsets: training, testing, and validation [21-25]. Furthermore, the experimental process was carried out in two main phases. The first phase examined individual CNN regularization techniques, namely L1 regularization and L2 regularization, to observe their respective effects on model performance. The second phase involved testing a combination of the two techniques using the Elastic Net (L1+L2) approach, with the objective of identifying the configuration that produces the most optimal results [26-30]. Model performance for each configuration was comprehensively evaluated using several assessment metrics, including accuracy, precision, recall, and visual analysis through a confusion matrix. This stepwise approach is intended to provide a clear understanding of the effectiveness of regularization techniques in enhancing the CNN’s ability to recognize and classify numbers in C1 form images that are otherwise difficult for the system to read [31-36]. These stages are illustrated in Figure 1.
Figure 1. Research method
Figure 1 above shows a systematic flowchart depicting the research process from beginning to end. Each stage is structured sequentially, from the literature review to the evaluation process, with a primary focus on the application and comparison of various regularization techniques in CNN models. This flowchart helps provide a visual understanding of the structure of the work performed during the experiment and how each stage relates to the research objectives.
Literature study is the initial foundation of the research on the classification of illegible numbers in the Recapitulation Information System (SIREKAP) on sheet C1 with a deep learning approach, starting with the collection and analysis of literature related to number classification methods and CNN architecture using the Systematic Literature Review (SLR) approach to ensure scientific validity. The literature data preparation stage involves determining search keywords such as classification CNN, deep learning handwriting recognition, and "form recognition neural network" in the IEEE Xplore, SpringerLink, Scopus, and Google Scholar databases. The initial literature obtained was then screened based on eligibility criteria through title and abstract review to ensure relevance to the topic, followed by an in-depth analysis of existing CNN methods and architectures. The final result is a comprehensive SLR report that serves as the basis for selecting the most relevant techniques for the experiment and establishing an evidence-based decision-making framework.
The dataset in this study was collected through a process of rewriting numbers that the Recapitulation Information System (SIREKAP) previously failed to recognize on the C1 election form. Since the original data were difficult to obtain due to their illegibility, respondents were instructed to recopy the numbers exactly as they appeared on the C1 form. The writing was designed to replicate the authentic characteristics of election documents. To simulate real-world conditions, the numbers were written on A4 paper using various tools, such as pens, colored markers, and colored pencils, to produce variations in stroke, thickness, and color resembling those found in field documents. A total of 300 respondents participated, each writing the digits 0–9 and the letter X in seven variations: bold (550 samples), right-slanted (550 samples), left-slanted (550 samples), crumpled paper (550 samples), subscript (550 samples), superscript (550 samples), and reversed (550 samples), yielding a total of 3,850 samples. All handwritten text was scanned using a standard scanner, saved as images, and each digit was cropped from the writing box to resemble the extracted images from C1 forms. The files were stored in JPG format with a resolution of 64 × 64 pixels. Once collected, the dataset was divided into three subsets:70% for training, 15% for validation, and 15% for testing. This division was intended to balance model development and evaluation while minimizing the risk of overfitting.
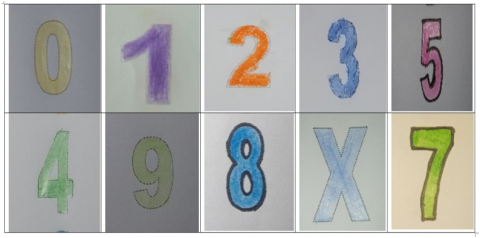
Visually, regarding the data used in this study, several sample images from the collected dataset are shown below. These images demonstrate the variety of written forms of numbers and letters produced by respondents, including differences in stroke type, slant, and writing style, which are important characteristics in the training process of pattern recognition models.
Figure 2. Bold number
Figure 2 shows bold numbers in different colors, where varying ink stroke thickness causes the number lines to widen and blend into the background. Different colors, such as black, blue, red, green, or yellow, also affect the contrast of the scan or photo. This results in images with higher noise levels, less clear number boundaries, and potential segmentation failures, often causing the SIREKAP system to incorrectly recognize the numbers even though they are still visually readable by humans.
Figure 3. Right italic numbers
Figure 3 shows that right-slanted numbers are often unreadable by the SIREKAP system because the slant of the writing causes the number's shape to deviate from the standard patterns the system has learned. For example, a right-slanted "1" can resemble a slash, or a left-slanted "7" can look like a "1" with an added stroke. These changes in orientation cause the line, angle, and curve features to align with the training database, making it difficult for the system to extract the correct pattern. Furthermore, the slant angle can also affect the segmentation process, making numbers appear longer or closer together, creating visual distortions that reduce recognition accuracy.
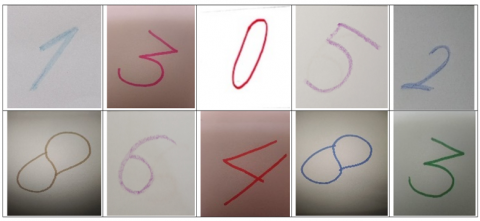
Figure 4. Left italic numbers
Figure 4 shows that numbers skewed to the left are often unreadable by the SIREKAP system because the change in orientation causes the number pattern to deviate significantly from the standard shape used in the system's training process. The left skewing causes vertical, horizontal, and curved lines to appear displaced, so key features of the number such as the angle in a "4" or the curves in "3" and "6”do not align with the system's recognized pattern. Furthermore, the visual distortion caused by the skewing can make the numbers appear denser or overlapping, making segmentation difficult. Other factors such as lighting during scanning or differences in ink thickness further add noise, ultimately preventing the system from correctly recognizing the numbers.
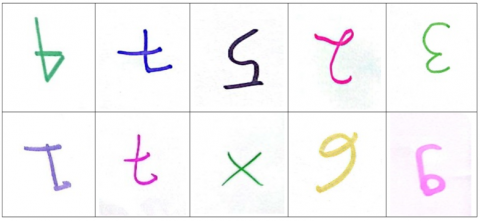
Figure 5 shows that upside-down numbers are often unreadable by the SIREKAP system because their visual orientation is completely distorted from the standard shapes trained in the pattern recognition system. For example, an upside-down 6 can resemble a 9, a 3 looks like the letter Ɛ, or a 5 looks like the letter S. These changes in orientation cause features such as lines, curves, and angles to mismatch their normal representations in the training dataset. As a result, the system struggles to extract the correct pattern, resulting in confusion in classification, or even failing to recognize the number altogether. Furthermore, when the upside-down condition is combined with variations in ink color, stroke thickness, or low scan quality, noise levels increase, increasing the chance of recognition errors.
Figure 5. Reverse numbers
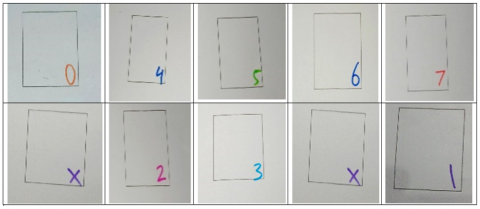
Figure 6. Subscript numbers
Figure 6 shows that subscript numbers are often illegible in the SIREKAP system because they are written below the normal line of text, so the system detects them as additional text or noise, rather than as main characters. Furthermore, the smaller size of subscripts than normal numbers cause fine line details and is difficult for segmentation algorithms to capture. When this condition is exacerbated by poor scan quality or paper tilt, the system has even more difficulty distinguishing subscript numbers from the background. As a result, subscript numbers are often overlooked, misread, or not recognized at all.
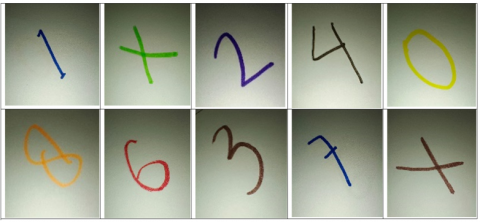
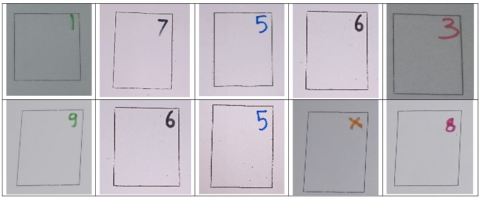
Figure 7. Super script numbers
Figure 7 shows that superscript numbers are often illegible in the SIREKAP system because their position above the normal writing line makes it difficult for the system to recognize them as primary numbers. This protruding position causes the number area to be misaligned with the other characters, so the segmentation algorithm often ignores it. Furthermore, the relatively small size of the superscript makes the line appear thin when scanned or photographed, reducing the visual detail needed for classification. In poor lighting conditions or with differences in ink contrast, superscript numbers can potentially be interpreted as noise or additional markings, causing the system to fail to read them.
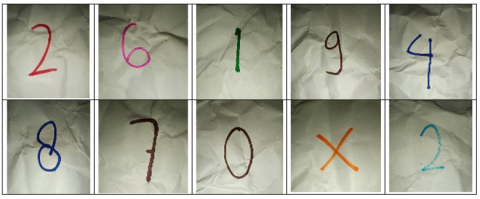
Figure 8. Numbers on crumpled paper
Figure 8 shows that numbers on crumpled paper are often unreadable by the SIREKAP system because the uneven surface of the paper causes shadows and creases that interfere with the scan results. The creases can cut off or partially cover the lines of the numbers, distorting the original shape of the numbers. Furthermore, light falling on the crumpled paper creates uneven contrast, making it difficult for the system to distinguish between ink strokes and crease patterns. As a result, the system can misrecognize the numbers or even fail to read them altogether, even though humans can still visually distinguish the shape of the numbers.
Various forms of writing the numbers 0 to 9 and the letter X were collected from 300 respondents, each with 550 samples, for a total of 3,850 samples in various writing styles, such as bold, right-slanted, left-slanted, subscript, superscript, reversed, and even writing on crumpled paper. These variations reflect the real-world conditions that may occur when filling out the C1 Election Form in the field, including disturbances in the shape, tilt, or physical condition of the paper. This visualization aims to provide an understanding of the challenges faced by the Recapitulation Information System (SIREKAP) in recognizing handwriting, as well as serve as an important basis for training artificial intelligence models to recognize handwriting patterns with a high level of accuracy. After the dataset was collected, the data was divided into three parts: 70% for model training, 15% for validation, and 15% for testing. This division was designed to maintain a balance between training and testing while minimizing the risk of overfitting.
4.1 Overview of the Convolutional Neural Network (CNN) architecture
A Convolutional Neural Network (CNN) is a deep learning architecture specifically designed to process image data by gradually extracting important features. The process begins with an input image that passes through a convolutional layer to generate feature maps, followed by pooling to reduce dimensionality while retaining important information. This process is repeated several times to create a simpler yet more information-rich image representation. The resulting feature maps are then converted into vectors through a flattening process, then processed by a fully connected layer for classification. Ultimately, the CNN is capable of recognizing complex patterns in images, such as the number "6," as in Figure 9.
Figure 9. Architecture CNN
Figure 9 shows the Convolutional Neural Network (CNN) architecture used in this study to recognize numbers in digital images in a step-by-step and detailed manner. The process begins with an input image measuring 64×64 pixels with 3 color channels (RGB), which then enters the first convolutional layer. In this layer, several filters or kernels are applied to extract basic features from the image such as lines, edges, and textures, resulting in 64×64 feature maps. The resulting feature maps then go through a pooling process (usually max pooling) which aims to reduce the data dimension to 32×32 while retaining important information. The pooling results are then processed by a second convolutional layer that extracts more complex and specific features, resulting in 16×16 feature maps, which are further reduced through pooling to 8×8. All of these feature maps are then flattened into one-dimensional vectors, which serve as input to the fully connected layer. In this layer, all neurons are connected and tasked with integrating all feature information to determine the final class of the image. Finally, the output layer produces a prediction of the number with the highest probability. in this case, the network recognizes the image as 6.
After the dataset was prepared and divided into training, validation, and testing data, a series of experiments were conducted using a Convolutional Neural Network (CNN) model to evaluate the effect of various regularization techniques on the performance of the classification model. In this experiment, three main configurations were tested separately, namely a standard CNN model without regularization as a baseline, a CNN model using regularization L1 regularization is used to reduce model complexity while encouraging the formation of weight sparsity, namely a condition where most of the weight values are zero so that only the most relevant features are retained. Meanwhile, L2 regularization is used to prevent overfitting by suppressing excessively large weight values, thus making the model more stable and able to generalize well. Each configuration is tested using the same data to ensure a fair and objective comparison. All models are then thoroughly evaluated using several key performance metrics: accuracy to measure the overall prediction accuracy, precision to assess accuracy in the positive class, recall to measure the model's sensitivity in detecting the true class, and a confusion matrix to provide a detailed picture of the distribution of correct and incorrect predictions in each class. This approach is designed to gain a more comprehensive understanding of the contribution of each regularization technique to model performance. Testing the performance of CNN models with various regularization configurations is shown in Table 1. Results of CNN Models with and without Regularization.
Table 1. CNN model results with and without regularization
|
Model |
Training (%) |
Validation (%) |
Testing (%) |
|
CNN Standard |
94.92 |
72.91 |
69.88 |
|
CNN With L1 Regularization |
91.99 |
55.34 |
59.72 |
|
CNN With L2 Regularization |
92.47 |
69.84 |
75.84 |
Based on the results in Table 1, it can be concluded that CNN models with different approaches show varying performance in recognizing data patterns. The standard CNN model without regularization recorded a training accuracy of 94.92%, while validation accuracy only reached 72.91% and testing accuracy was 69.88%. This indicates a tendency towards overfitting, where the model is very good at learning the training data but is less able to generalize to the validation and testing data. Meanwhile, the CNN model with L1 regularization showed a high training accuracy of 91.99%, but experienced a drastic decrease in validation (55.34%) and testing (59.72%) accuracy, indicating underfitting. This condition occurs because the nature of L1 which encourages excessive weight sparsity, so that some important features are actually overlooked and reduce the model's generalization ability. On the other hand, the CNN model with L2 regularization shows a more balanced performance, with a training accuracy of 92.47%, validation 69.84%, and testing 75.84%, indicating that L2 is quite effective in reducing overfitting while retaining important information in the model. Of the three models, CNN with L2 is the most stable alternative because it is able to provide a balance between learning ability and generalization, although there is still room for improvement to further improve validation and testing accuracy. Accuracy and loss graphs can be seen in Figures 10 and 11.
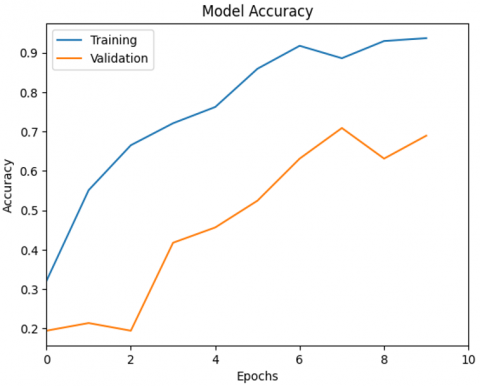
Figure 10. Model accuracy CNN with L2 regularization
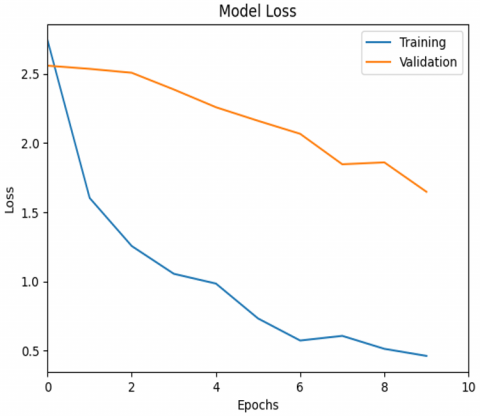
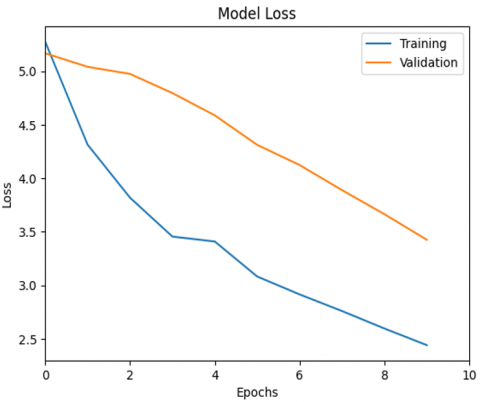
Figure 11. Model loss CNN with L2 regularization
Figure 10 shows a graph of model accuracy during the training and validation process over 10 epochs. It can be seen that training accuracy consistently increases from the beginning to the end of the epoch, reaching a value close to 0.95, indicating that the model is able to learn well from the training data. Meanwhile, accuracy also shows a significant increase, although the value is lower than the training accuracy. At some points, such as in the 7th and 8th epochs, a slight dip is observed in the validation curve, which could be an early indication of overfitting. However, overall, the increasing trend in both curves indicates that the model has a fairly good generalization ability to data that has not been seen before. This graph provides an important visualization in evaluating the stability and performance of the model during the training process.
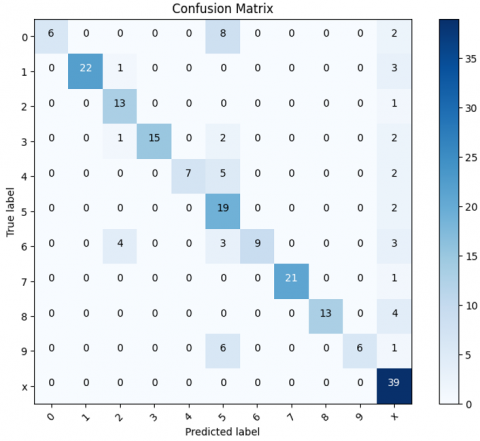
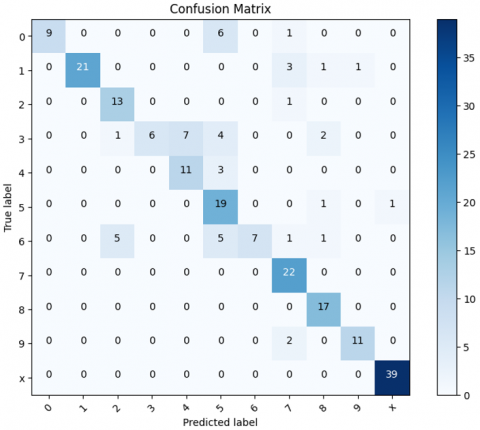
Figure 12. Confusion martrix CNN with L2 regularization
Figure 11 shows a graph of the model's loss values during the training and validation processes over a period of 10 epochs. The loss value on the training data shows a sharp decline at the beginning and continues to decrease consistently as the number of epochs increases, indicating that the model successfully minimizes prediction errors on the training data. Meanwhile, the loss on the validation data also shows a gradual decline, albeit at a slower rate than the loss on the training data. The widening difference between the training and validation curves in the final epochs may indicate the emergence of overfitting symptoms, which occurs when the model adapts too much to the training data, resulting in decreased performance on new data. However, the overall decrease in loss values, both on the training and validation data, indicates that the training process is running well and the model has sufficient generalization potential. This graph is important for evaluating the stability and effectiveness of the model in learning from data and for the results of the confusion matrix of the CNN model with L2 regularization can be seen in Figure 12.
Based on Figure 12 confusion matrix in Figure 9, class 0 was predicted correctly 6 times but there were still 8 cases of misprediction to class 4 and 2 cases to class X, which likely occurred because the number 0 with its imperfect shape looks similar to the number 4 or a cross line like the letter X. Class 1 was predicted correctly 22 times with one error to class 2 and three errors to class X. Class 2 was predicted correctly 13 times with one error to class 3. Class 3 was predicted correctly 15 times but still two times wrong to class 4 because the open curve of number 3 makes it look similar to number 4. Class 4 was predicted correctly 7 times but five times wrong to class 3 and two times to class X. Class 5 was predicted correctly 19 times with one error to class X. Class 6 was predicted correctly 9 times but four times wrong to class 4 and three times to class 5, thus indicating the model's difficulty in distinguishing numbers with similar curves. Class 7 was predicted correctly 21 times with one error to class X so it can be said to be quite stable. Class 8 was predicted correctly 13 times but four times incorrectly to class X. Class 9 was predicted correctly 6 times but six times incorrectly to class 4 and once to class X which shows the number 9 with a certain shape that can resemble the number 4 or a cross. Class X was predicted correctly 39 times without error so it remains the class that is most easily recognized by the model. This shows that although L2 regularization is effective in stabilizing weights and reducing overfitting, challenges in distinguishing similar characters remain. Overall, this model is quite reliable in classifying, but still has room for improvement, especially in terms of accuracy on characters that are prone to confusion.
Further experiments were conducted combining L1 and L2 regularization into a single modeling approach known as Elastic Net, in an attempt to address the weaknesses found in using L1 and L2 separately. In previous experiments, the use of L1 regularization resulted in a model that tended to underfit due to excessive sparsity pressure, resulting in many important weights being zeroed and resulting in low accuracy on both validation and test data. Meanwhile, the use of L2 regularization demonstrated more stable performance, but was not fully able to distinguish between characters with visually similar shapes, which led to misclassification in some classes. Therefore, in this experimental phase, a combination of the two regularization techniques was carried out in the hope of utilizing the advantages of each method: L1 regularization for efficient feature selection and L2 regularization for weight stabilization and control over model complexity. By applying Elastic Net, the model is expected to achieve a balance between high accuracy, good generalization ability, and minimal misclassification of similar characters. This approach was tested with specific parameter configurations adjusted through the training process, and the results were then evaluated using accuracy metrics, a confusion matrix, and visual analysis of model predictions. The performance testing of the combined L1 regularization and L2 regularization model in the form of Elastic Net is shown in Table 2. Results of L1+L2 Elastic Net.
Table 2. L1+L2 Elastic Net results
|
Model |
Training (%) |
Validation (%) |
Testing (%) |
|
L1+L2 Elastic Net |
95.51 |
71.74 |
77.89 |
The results were obtained from the combination of L1 and L2 regularization using the Elastic Net approach. This model achieved the highest training accuracy of 95.51%, along with significant improvements in validation accuracy 71.74% and testing accuracy 77.89% compared to the other models. The integration of L1 and L2 enables the model to perform feature selection efficiently through the effect of L1, while maintaining weight stability through the effect of L2. As a result, the Elastic Net produced the most balanced and reliable model for use with previously unseen data. Overall, the findings indicate that the choice of regularization technique has a substantial impact on the generalization ability of a CNN model. Although the model without regularization appeared superior in terms of validation and testing accuracy, its weak training performance suggests learning deficiencies. In contrast, the Elastic Net proved to be the most effective configuration, delivering consistently high performance across all metrics while avoiding both overfitting and underfitting. The accuracy and loss curves of the L1+L2 Elastic Net model are presented in Figure 13 and Figure 14.
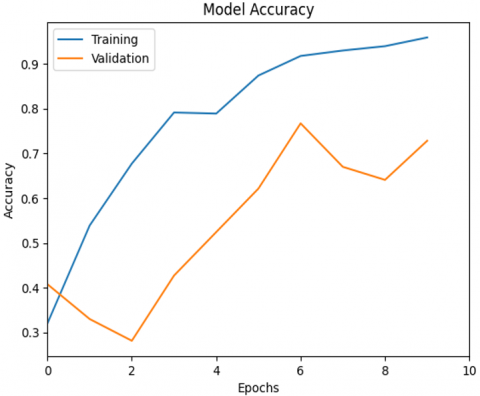
Figure 13. Model accuracy L1+L2 Elastic Net
Figure 13 above shows a graph of model accuracy on training and validation data over 10 epochs. It can be seen that accuracy on the training data has increased significantly and consistently, indicating that the model is getting better at recognizing patterns in the training data. On the other hand, accuracy on the validation data fluctuates, especially after the 6th epoch, indicating that the model is starting to lose its generalization ability to untrained data. However, there is a general increase in validation accuracy compared to the initial training, indicating a learning process. The difference in accuracy between training and validation in the final epoch is quite large, indicating potential overfitting. This graph is important for evaluating whether the model is learning effectively and balancing between training and validation data.
Figure 14. Model loss L1+L2 Elastic Net
Figure 14 above depicts the loss model graph applied with combined L1 regularization and L2 regularization, known as Elastic Net, in the loss model on the training and validation data for 10 epochs. It can be seen that the loss value on the training data experienced a consistent and significant decrease from the beginning to the end of the epoch, indicating that the model successfully learned the patterns from the training data well. Meanwhile, the loss on the validation data also showed a fairly steady downward trend, although slower than the training data, and did not show any noticeable increase. This indicates that the model does not experience significant overfitting, as performance on unseen data continues to improve over time. The use of Elastic Net has been shown to have a positive effect in balancing L1 regularization (which encourages sparsity) and L2 regularization (which prevents model weights from becoming too large), resulting in a model that is not only accurate on the training data but also has good generalization ability to new data. This combination is very useful in machine learning scenarios that are prone to overfitting, especially when the number of features is relatively large or the data is not completely clean. The results of the confusion matrix can be seen in Figure 15.
Based on the confusion matrix results in Figure 15, it can be concluded that the CNN model with L1 + L2 (Elastic Net) regularization shows quite promising classification performance on the numerical and symbolic data used. The confusion matrix shows that most of the model predictions are on the main diagonal, which indicates correct predictions of the actual labels. This model is able to recognize several classes very well, such as the letter X which is predicted with perfect accuracy without error, while Class 0: 9 is correct, there are a few errors to classes 6 and 9, the number 0 sometimes looks like 6 or 9 if the stroke is not perfect. Class 1: 21 is correct, but is incorrectly predicted to be 6 (3 cases), 8 (1 case), 9 (1 case), the thin/slanted number 1 can resemble the strokes of other numbers. Class 2: 13 is correct, incorrectly becomes 3 and 4, the number 2 is often confused with 3/4 because the curved shape is similar. Grade 3: 7 correct, but 6 times wrong to 2 and 4, the number 3 is often similar to 8 or 2 if not closed. Grade 4: 11 correct, but 2 times wrong (3 cases) the stroke shape of the number 4 sometimes looks like the number 2 when written in italics. Grade 5: 19 correct, wrong to 6 and 8, the number 5 often looks like 6 because the circle is not clear. Grade 6: 22 correct, but 5 times wrong to 5 and 8, the number 6 is exchanged with 5 because the structure is almost the same. Grade 7: 22 correct, quite stable, there is 1 error to 1. Grade 8: 17 correct, wrong to 0 and 6, the number 8 is very similar to 0/6 if the circle is not clear. Grade 9: 11 correct, but 2 times wrong to 6, the number 9 is similar to 6 if the orientation is reversed. This indicates that the model has a strong and balanced classification ability in recognizing patterns from various handwritten characters.
Figure 15. Confusion matrix L1+L2 Elastic Net
Evaluation and performance measurement are crucial steps in the machine learning model development process, as they aim to assess the model's ability to recognize patterns and accurately classify previously unseen data. In this study, model performance was evaluated using precision, recall, and f1-score metrics, which provide a comprehensive overview of prediction accuracy, model sensitivity to positive data, and the balance between the two. The evaluation was conducted on a test dataset consisting of 3,850 samples, covering all target classes: the numbers 0 to 9 and the letter X.
Table 3 shows the model's performance in classifying each character class, namely numbers 0 to 9 and the letter X. In general, the model shows good results with high precision in almost all classes, even reaching 1.00 in classes 0, 1, and 6. Class 0 has a recall of 0.78 so that most samples can be recognized correctly and produces an F1-score of 0.72. Classes 2, 7, 8, and X show very good performance with recall values approaching or reaching 1.00 resulting in high F1-scores of 0.79, 0.85, 0.87, and 0.99, respectively. Classes 3 and 6 also show quite good performance with recalls of 0.71 and 0.86, respectively, resulting in F1-scores of 0.77 and 0.82, indicating the model's ability to recognize most samples in both classes. Class 5 has a precision of 0.81 and a recall of 0.90, indicating a good prediction balance, although the F1-score is still lower than other classes. Overall, the model is able to classify characters with consistent accuracy, but there is still room for improvement, especially by increasing the F1-score in classes with relatively low performance, such as classes 4 and 5, to optimize model sensitivity.
Table 3. Evaluation L1+L2 (Elastic Net)
|
Class |
Precision |
Recall |
F1-score |
|
0 |
1.00 |
0.78 |
0.72 |
|
1 |
1.00 |
0.81 |
0.89 |
|
2 |
0.68 |
0.93 |
0.79 |
|
3 |
0.83 |
0.71 |
0.77 |
|
4 |
0.61 |
0.79 |
0.69 |
|
5 |
0.81 |
0,90 |
0.66 |
|
6 |
1,00 |
0.86 |
0.82 |
|
7 |
0.73 |
1.00 |
0.85 |
|
8 |
0.77 |
1.00 |
0.87 |
|
9 |
0.92 |
0.85 |
0.88 |
|
X |
0.97 |
1.00 |
0.99 |
Table 4. Comparative results of classification models
|
Model |
Training (%) |
Validation (%) |
Testing (%) |
|
CNN Standard |
94.92 |
72.91 |
69.88 |
|
CNN with L1 regularization |
91.99 |
55.34 |
59.72 |
|
CNN with L2 regularization |
92.47 |
69.84 |
75.84 |
|
CNN with L1+L2 Elastic Net |
95.51 |
71.74 |
77.89 |
Table 4 compares the performance of four CNN model configurations: the standard CNN, CNN with L1 regularization, CNN with L2 regularization, and CNN with the combined L1+L2 (Elastic Net) approach across the training, validation, and testing stages. The standard CNN achieved a training accuracy of 94.92%, validation accuracy of 72.91%, and testing accuracy of 69.88%, reflecting strong learning capability but limited generalization during testing. The CNN with L1 regularization obtained a lower training accuracy of 91.99% and experienced a substantial decline in validation (55.34%) and testing (59.72%) performance, indicating its ineffectiveness in handling data variability. In contrast, the CNN with L2 regularization achieved a training accuracy of 92.47%, with validation accuracy of 69.84% and testing accuracy of 75.84%, showing improved generalization compared to the L1 model. The combined L1+L2 Elastic Net model produced the best overall results, with a training accuracy of 95.51%, validation accuracy of 71.74%, and testing accuracy of 77.89%, demonstrating a balance between effective learning and robust generalization. Overall, these findings confirm that the Elastic Net approach provides the most stable and effective configuration for enhancing CNN performance in handwritten character classification tasks.
This study demonstrates that applying a Convolutional Neural Network (CNN) with regularization techniques can improve the accuracy of reading numbers on the C1 Election Form, particularly those previously unreadable by the SIREKAP system. By testing various model configurations—standard CNN, CNN with L1 regularization, CNN with L2 regularization, and CNN with a combined L1+L2 (Elastic Net)—an in-depth understanding was gained regarding the impact of regularization on the model’s ability to recognize character patterns. The experimental results showed that the standard CNN produced relatively high validation and testing accuracy but lower training accuracy, indicating potential underfitting. The L1-regularized model tended to overfit, while the L2-regularized model demonstrated more balanced performance. The L1+L2 Elastic Net configuration achieved the most optimal results, with training accuracy of 95.51%, validation accuracy of 71.74%, and testing accuracy of 77.89%, as well as consistent performance across precision, recall, F1-score, and confusion matrix. This model successfully recognized digits 0–9 and the letter X across diverse handwriting variations, reducing the need for manual intervention and improving the reliability of the vote recapitulation process.
Nonetheless, this study has limitations, particularly the relatively small dataset size (3,850 samples), which may not fully represent handwriting diversity in the field. Moreover, direct testing on original C1 form images from the SIREKAP system was not possible due to restricted access requiring official permission from election authorities. Future research should employ larger and more diverse datasets and conduct evaluations on real C1 documents to assess generalization in real-world conditions. Overall, these findings provide a strong foundation for developing more reliable automatic reading systems, not only for elections but also for broader applications requiring accurate handwritten character recognition.
The authors wish to express their profound gratitude to Universitas Baturaja and Universitas Sriwijaya for their unwavering support and encouragement throughout the preparation and completion of this research. Special appreciation is also extended to all respondents who generously dedicated their time and effort to rewriting the handwritten samples that were difficult to read on the C1 forms. Their active participation was vital in ensuring the completeness and reliability of the dataset.
The authors also highly value the constructive feedback and insightful suggestions provided by colleagues and peers, which have greatly contributed to improving the clarity and overall quality of this manuscript. This research would not have been possible without the collective contributions of these institutions and individuals.
[1] Oyibo, K.U., Louis, J.D., Gilbert, J.E. (2022). iOCR: Informed optical character recognition for election ballot tallies. arXiv preprint arXiv:2208.00865. https://doi.org/10.48550/arXiv.2208.00865
[2] Ukil, S., Ghosh, S., Obaidullah, S.M., Santosh, K.C., Roy, K., Das, N. (2020). Improved word-level handwritten indic script identification by integrating small convolutional neural networks. Neural Computing and Applications, 32(7): 2829-2844. https://doi.org/10.1007/s00521-019-04111-1
[3] El-Sawy, A., Loey, M., El-Bakry, H. (2017). Arabic handwritten characters recognition using convolutional neural network. WSEAS Transactions on Computer Research, 5(1): 11-19.
[4] Graves, A., Schmidhuber, J. (2008). Offline handwriting recognition with multidimensional recurrent neural networks. Advances in Neural Information Processing Systems, 21.
[5] LeCun, Y., Bottou, L., Bengio, Y., Haffner, P. (2002). Gradient-based learning applied to document recognition. Proceedings of the IEEE, 86(11): 2278-2324. https://doi.org/10.1109/5.726791
[6] Mandasari, M., Al Qohar, B. (2024). Digit and mark recognition using convolutional neural network for voting digitization in Indonesia. Journal of Information System Exploration and Research, 2(2): 77-84. https://doi.org/10.52465/joiser.v2i2.365
[7] Bachmid, F., Djanggih, H. (2022). The Future of e-voting implementation in indonesian general election process: Constitutionality, benefits and challenges. Varia Justicia, 18(1): 34-51. https://doi.org/10.31603/variajusticia.v18i1.6359
[8] LeCun, Y., Bengio, Y. Hinton, G. (2015). Deep learning. Nature, 521: 436-444. https://doi.org/10.1038/nature14539
[9] Waladi, A., Arymurthy, A.M., Wibisono, A., Mursanto, P. (2019). Automatic counting based on scanned election form using feature match and convolutional neural network. In 2019 International Conference on Advanced Computer Science and information Systems (ICACSIS), Bali, Indonesia, pp. 193-198. https://doi.org/10.1109/ICACSIS47736.2019.8979691
[10] Deng, L., Yu, D. (2014). Deep learning: Methods and applications. Foundations and Trends® in Signal Processing, 7(3-4): 197-387. https://doi.org/10.1561/2000000039
[11] Hinton, G.E., Osindero, S., Teh, Y.W. (2006). A fast learning algorithm for deep belief nets. Neural computation, 18(7): 1527-1554. https://doi.org/10.1162/neco.2006.18.7.1527
[12] Ng, A.Y. (2004). Feature selection, L1 vs. L2 regularization, and rotational invariance. In Proceedings of the 21st International Conference on Machine Learning (ICML), Banff, Alberta, Canada, p. 78. https://dl.acm.org/doi/10.1145/1015330.1015435.
[13] Santos, C.F.G.D., Papa, J.P. (2022). Avoiding overfitting: A survey on regularization methods for convolutional neural networks. ACM Computing Surveys (Csur), 54(10s): 1-25. https://doi.org/10.1145/3510413
[14] Krizhevsky, A., Sutskever, I., Hinton, G.E. (2017). ImageNet classification with deep convolutional neural networks. Communications of the ACM, 60(6): 84-90. https://doi.org/10.1145/306538
[15] Szegedy, C., Liu, W., Jia, Y.Q., Sermanet, P., Reed, S., Anguelov, D., Erhan, D., Vanhoucke, V., Rabinovich, A. (2015). Going deeper with convolutions. In 2015 IEEE Conference on Computer Vision and Pattern Recognition (CVPR), pp. 1-9. https://doi.org/10.1109/CVPR.2015.7298594
[16] Chollet, F. (2017). Xception: Deep learning with depthwise separable convolutions. arXiv preprint arXiv:1610.02357. https://doi.org/10.48550/arXiv.1610.02357
[17] O’Shea, K., Nash, R. (2015). Convolutional Neural Networks for visual recognition. In CS231n: Convolutional Neural Networks for Visual Recognition (Stanford University).
[18] Zou, H., Hastie, T. (2005). Regularization and variable selection via the elastic net. Journal of the Royal Statistical Society Series B: Statistical Methodology, 67(2): 301-320. https://doi.org/10.1111/j.1467-9868.2005.00503.x
[19] Tibshirani, R. (1996). Regression shrinkage and selection via the lasso. Journal of the Royal Statistical Society. Series B (Methodological), 58(1): 267-288. https://doi.org/10.1111/j.1467-9868.1996.tb01429.x
[20] Hastie, T., Tibshirani, R., Friedman, J. (2009). The Elements of Statistical Learning: Data Mining, Inference, and Prediction. Germany: Springer.
[21] Friedman, J.H., Hastie, T., Tibshirani, R. (2010). Regularization paths for generalized linear models via coordinate descent. Journal of Statistical Software, 33(1): 1-22. https://doi.org/10.18637/jss.v033.i01
[22] Bühlmann, P., van de Geer, S. (2011). Statistics for High-Dimensional Data: Methods, Theory and Applications. Germany: Springer.
[23] Shen, H., Huang, J.Z. (2008). Sparse principal component analysis via regularized low rank matrix approximation. Journal of Multivariate Analysis, 99(6): 1015-1034. https://doi.org/10.1016/j.jmva.2007.06.007
[24] Salehin, I., Kang, D.K. (2023). A review on dropout regularization approaches for deep neural networks within the scholarly domain. Electronics, 12(14): 3106. https://doi.org/10.3390/electronics12143106
[25] Zhao, X., Wang, L., Zhang, Y., Han, X., Deveci, M., Parmar, M. (2024). A review of convolutional neural networks in computer vision. Artificial Intelligence Review, 57(4): 99. https://doi.org/10.1007/s10462-024-10721-6
[26] Yin, X., Zhang, W., Jing, X. (2023). Static-dynamic collaborative graph convolutional network with meta-learning for node-level traffic flow prediction. Expert Systems with Applications, 227: 120333. https://doi.org/10.1016/j.eswa.2023.120333
[27] Tian, Y., Zhang, Y. (2022). A comprehensive survey on regularization strategies in machine learning. Information Fusion, 80: 146-166. https://doi.org/10.1016/j.inffus.2021.11.005
[28] Bisogni, C., Cascone, L., Castiglione, A., Passero, I. (2021). Deep learning for emotion driven user experiences. Pattern Recognition Letters, 152: 115-121. https://doi.org/10.1016/j.patrec.2021.09.004
[29] Srivastava, N., Hinton, G., Krizhevsky, A., Sutskever, I., Salakhutdinov, R. (2014). Dropout: A simple way to prevent neural networks from overfitting. The journal of machine learning research, 15(1): 1929-1958. https://dl.acm.org/doi/abs/10.5555/2627435.2670313
[30] Ioffe, S., Szegedy, C. (2015). Batch normalization: Accelerating deep network training by reducing internal covariate shift. In International conference on machine learning, Lille, France, pp. 448-456. PMLR.
[31] Kingma, D.P. (2014). Adam: A method for stochastic optimization. arXiv preprint arXiv:1412.6980. https://doi.org/10.48550/arXiv.1412.6980
[32] Abadi, M., Agarwal, A., Barham, P., Brevdo, E., et al. (2016). TensorFlow: Large-scale machine learning on heterogeneous distributed systems. arXiv preprint arXiv:1603.04467. https://doi.org/10.48550/arXiv.1603.04467
[33] Smith, R. (2007). An overview of the Tesseract OCR engine. In Ninth International Conference on Document Analysis And Recognition (ICDAR 2007), Curitiba, Brazil, pp. 629-633. https://doi.org/10.1109/ICDAR.2007.4376991
[34] Zhao, X., Shen, Y., Wang, S., Zhang, H. (2023). Generating diverse augmented attributes for generalized zero shot learning. Pattern Recognition Letters, 166: 126-133. https://doi.org/10.1016/j.patrec.2023.01.005
[35] Jiang, J., Zhang, X. (2024). Feature selection based on self-information combining double-quantitative class weights and three-order approximation accuracies in neighborhood rough sets. Information Sciences, 657: 119945. https://doi.org/10.1016/j.ins.2023.119945
[36] Yang, M., Lim, M.K., Qu, Y., Li, X., Ni, D. (2023). Deep neural networks with L1 and L2 regularization for high dimensional corporate credit risk prediction. Expert Systems with Applications, 213: 118873. https://doi.org/10.1016/j.eswa.2022.118873