Mufeed Ehsan Shok![]() | Zahraa Imad Hussain Al-Hussaini
| Zahraa Imad Hussain Al-Hussaini![]() | Amer Shakir Alkinani*
| Amer Shakir Alkinani*![]()
© 2025 The authors. This article is published by IIETA and is licensed under the CC BY 4.0 license (http://creativecommons.org/licenses/by/4.0/).
OPEN ACCESS
The study aims to evaluate sustainable traffic management strategies for congested intersections in medium-sized Iraqi cities, with a focus on Al-Sa’a Intersection and Al-Jari Street in Hit City. These nodes face severe traffic congestion, delays, and infrastructure limitations that compromise urban mobility and sustainability. A multi-criteria evaluation (MCE) framework was employed to analyze three categories of interventions—engineering, planning, and administrative—based on five weighted criteria: traffic efficiency (40%), delay reduction (25%), cost (20%), environmental impact (10%), and social acceptance (5%). The methodology combined field data collection (traffic counts, travel time, and delays), GIS-based spatial analysis, and stakeholder consultation to prioritize solutions and evaluate performance. The findings indicated that all proposed solutions improved traffic performance, but varied in scope and impact. Engineering solutions, such as street widening and grade separation, reduced congestion by up to 40%. Planning measures, including public transport enhancement and alternative routes, scored the highest (8.2/10) due to their long-term sustainability and balanced environmental impact. Administrative actions—optimized signal timing and truck regulation—offered low-cost, short-term improvements. The study demonstrates the value of integrated, GIS-supported, multi-criteria approaches in diagnosing and addressing urban traffic challenges in secondary cities. A phased implementation strategy is recommended: initiate with administrative measures, transition to planning-based interventions, and apply engineering upgrades where necessary. The framework can support future transport planning in similar urban contexts across Iraq.
Al-Sa’a Intersection, Al-Jari Street, GIS-based traffic analysis, congestion mitigation, urban mobility, multi-criteria evaluation, sustainable transport planning
In the context of rapidly changing urban environments, controlling traffic systems is challenging, and effective transportation planning is essential for sustainable urban development. From urban traffic congestion, operational inefficiencies to environmental impacts, urban challenges are becoming one of the most significant issues for planners and decision-makers in many countries. These challenges are particularly acute in emerging cities where demand outstrips infrastructure. A better understanding of these challenges requires a multifaceted approach, combining field data, traffic engineering principles, and tailored implementation strategies that are specific to that particular city.
Although many studies have analyzed traffic congestion in large metropolitan areas, there is a notable gap regarding medium-sized historic cities like Hit, which face unique spatial, infrastructural, and cultural constraints. Prior research has seldom combined GIS-based spatial analysis with multi-criteria evaluation (MCA) to systematically rank and compare engineering, planning, and administrative traffic solutions in such contexts.
Hit City — Critical Transportation Nodes. In Hit City, Al-Sa’a Junction and Al-Jari Street are critical links for transportation network and connecting residential, commercial and institutional sectors. However, these mission-critical locations are also the most congested and least efficient during peak hours due to high dwell times and long queueing, which has a direct impact on operating costs and revenue.
These issues, as road width is limited, traffic density is high, and the flow of vehicles has been poorly managed, lead to poor mobility and low-quality urban living. This study addresses the following research question: What combination of engineering, planning, and administrative measures—evaluated through a weighted multi-criteria framework—can most effectively mitigate congestion and enhance traffic sustainability at Al-Sa’a Intersection and Al-Jari Street?
The study seeks to investigate the root causes of traffic inefficiencies in Al-Sa’a Intersection and Al-Jari Street with the intention of suggesting practical solutions to improve traffic effectiveness. The study is based on field data collection coupled with an analysis of traffic flow, density, and speed relationships, in addition to peak hour delay analysis. Next, we assess potential interventions in three buckets: engineering, planning, and administrative solutions that could holistically address the challenges we identified. Each solution will be evaluated on its ability to improve traffic flow, cut down delays, and align with long-term development goals for the city.
2.1 Transportation as a vital element in urban planning
Transportation serves as an essential link between activities in urban-centric settings and the land use they demand; thus, it is the backbone of urban development. Transportation is not only a means of movement but also a decisive design element of urban agglomeration in terms of utility and socio-spatial interaction at the urban scale. Transportation is a core element of urban planning, serving to mobilize and connect city life while simultaneously addressing urban challenges such as environmental impact and quality of life. Transport planning is increasingly integrated into the modern urban planning process and is a key part of making sustainable and livable cities [1]. Business can find its way in one city, its comfort driving in the hope of prosperity. Transportation networks shape urban form and affect land use patterns by shaping accessibility and mobility. Targeted investments on urban projects lead to an equitable and cost-effective environment [2, 3]. Integrated systems, those that work in harmony with land use, lead to sustainable development, accessibility, and mobility. This is largely where the integration of transportation and urban planning comes into play when it comes to the sustainable agenda. Assignment of credits and new technology in Geographic Information Systems (GIS) helps better modeling and decision for different portfolios related to urban transportation projects, which help connectivity and reduce functionality and carbon footprints [4]. And sustainable approaches aim to do so in ways that increase the use of public transport, reduce reliance on cars, and develop city designs that favour pedestrians rather than cars. Meanwhile, institutional challenges still exist in modern urban transportation planning, which necessitate the integration of administration, planning, and management processes. Effective urban transportation policies can only be created through collaboration among stakeholders, including government, private organizations, and the public [5]. Tools for collecting data, like GIS and field surveys, play a key role in assessing transportation solutions. These tools offer valuable insights into traffic patterns, urban growth, and environmental impacts, allowing planners to create data-driven strategies [6].
To summarize, transportation also connects roles in urban activities and land use, urban planning and development. Transportation systems can be designed to meet the needs of modern urban environments while empowering growth and sustainability through sustainability and technology and collaboration frameworks.
2.2 Traffic data: Theoretical and practical analysis
2.2.1 Traffic flow theory
1) Traffic Flow Theory (Relationship between Density, Speed, and Flow):
2) Analysis of Movement Patterns (Vehicle Flow at Intersections):
2.2.2 Infrastructure data
1) Intersection Design Concepts:
2) Network Analysis and Performance Measurement:
Traffic data analysis integrates theoretical principles of flow with practical tools like GIS to address congestion and improve intersection efficiency. This dual approach enables a detailed understanding of movement patterns and infrastructure impacts, leading to informed, effective urban traffic management.
2.3 Urban planning data: Integration and alternative road design
2.3.1 Land Use and Transport Integration (LUTI)
Land Use and Transport Integration (LUTI) emphasizes the interconnectedness of urban activities (e.g., commercial, residential) and their impact on traffic patterns. Effective integration can reduce unnecessary trips by redistributing activities closer to residential areas or public transport nodes [14]. Examples from sustainable practices, such as Transit-Oriented Development (TOD), show the benefits of compact and mixed-use developments in enhancing accessibility while minimizing environmental impact [15, 16]. Strategies such as zoning regulations and mixed-use developments allow for clustering activities around transport nodes to reduce car dependency [17]. In cases like the Holy City of Karbala, GIS-based buffer analysis was used to assess the alignment of urban services with public transport routes, optimizing residential and commercial activity placement [18, 19].
2.3.2 Designing alternative roads
Building alternative transport routes such as bypass roads or parallel corridors can significantly reduce the congestion burden on key intersections. Integrated urban models predict the effectiveness of such designs by simulating traffic redistribution and evaluating long-term sustainability [20]. GIS tools like Overlay Analysis are used to assess the efficiency of new routes. These analyses can calculate reductions in travel time, energy consumption, and traffic loads on critical intersections [21]. In Helsinki, historical and institutional approaches demonstrated that improving transport systems required careful spatial alignment with urban development trends.
Integrating land use with transportation planning, coupled with designing alternative routes, is critical for achieving sustainable urban mobility. Using GIS and predictive models, planners can ensure optimized resource allocation and reduced congestion, aligning urban growth with transportation efficiency.
2.4 Integrated data analysis for urban traffic solutions
It heavily influences drivers' time causing higher operational expenses and loss of productivity. Using survey data these delay costs can be computed and combined with GIS in finding congestion hot spots and evaluating the economic impacts [22]. The results of the survey and the GIS data can be combined to visualize the impacts of delays geographically, which can help to prioritize the most important areas for intervention. In order to allocate resources (engineering, planning, administrative, etc.) we must compare against the costs of alternative solutions. GIS tools, such as the Field Calculator, offer exact cost estimates for each option, allowing stakeholders to select based on data [23]. Different types of emissions, like CO2 and NOx, increase in hotspots detectable via GIS-based heatmaps due to traffic congestion. Spatial patterns of elevated emissions can be assessed using these maps to inform policies and interventions [24]. To minimize environmental impacts, traffic solutions that facilitate flow, reduce idle times are key. For example, TEMMS combines emission and traffic data in order to facilitate scenario- based planning for emission reductions [25]. Gathering public feedback through surveys about current and proposed traffic solutions are essential to understanding social impacts. To connect both survey responses and geographic locations, GIS's Spatial Join tool was used and the areas that require urgent attention were rated higher [26]. In GIS, Service Area Analysis tools assess the accessibility of essential services, supporting planners in designing interventions that improve such connectivity and ensure equitable access [27]. That's why it's fundamental to analyze the different traffic solutions applied in terms of time. Timeline Mapping in GIS visually represents phases of the project and the timing at which results are completed, allowing for a comparison of timelines at which alternatives to intervention are reached [28]. Stakeholders can also identify potential delays and optimize scheduling within visual tools, allowing for recommendations on how to ensure projects come in on time [29].
GIS-based tools can ensure a comprehensive approach to manage urban traffic based on integrated economic, environmental, social, and temporal data. This approach allows for sustainable, affordable, and socially inclusive solutions under both environmental and temporal constraints.
2.5 Multicriteria Assessment Framework (MCA)
Like Decision Theory (DT), Multicriteria Analysis (MCA) is based on the work of helping decision-makers assess and compare the available alternatives that include multiple criteria, with subjective conflicting objectives to support informed, data-driven decisions. In such cases, it is effective to adopt small models (multi-criteria decision analysis) when the solutions must contend with interrelated issues such as traffic patterns, environmental footprint, economic implications, and social equity [29]. In the context of traffic performance, MCA relies on key indicators such as travel time, vehicle flow, and congestion levels to measure mobility efficiency and to evaluate how effectively the proposed solutions can enhance overall traffic conditions [20]. Tools like GIS's Field Calculator effectively compare alternatives in terms of implementation and operational costs, among other economic costs [30]. Environmental implications, namely emission data such as CO2 and NOx are analyzed with GIS-based tools such as Emission Hotspot Maps for sustainable purpose [24]. Public satisfaction and accessibility are measured through surveys that distribute geolocated responses into the Intersector GIS tools like Spatial Join [26]. Timeline mapping in GIS provides a visual representation of the execution timeline of each option, which can help determine which option will best minimize disruption [28]. Applying MCA comprises inputting values of criteria, such as travel time, costs, and emissions, as well as survey results, into GIS, and incorporating these into analytical models to evaluate weighted scores, as per the ranking of alternatives [31]. This creates GIS visualizations that make the best options clear, enabling data-driven decisions by stakeholders. For example, in one case study where metropolitan traffic needs to be optimized, MCA was applied in the framework of GIS to compare the use of grade-separated interchanges with the optimization of traffic signals, showing cost-effective and environmentally viable solutions found after adjusting the weights of the criteria according to the priorities set by involved stakeholders [32].
2.6 GIS analytical tools for urban traffic management
By employing spatial analysis methods, GIS analytical tools provide a powerful framework for countermeasures against urban traffic issues. When it comes to finding out at what points an area has high density Kernel Density Analysis, for example, is a great option, and one of its use-cases could be finding traffic congestion hotspots (for e.g., if two roads were to meet at an intersection). This approach assists planners in identifying areas of concern for interventions through vehicle flow density or accident data analysis. GIS can produce heatmaps that show the amount of traffic near busy intersections, allowing planners to prioritize improvements that will help to reduce congestion [33]. Another valuable tool is network analysis, which estimates the effectiveness of the traffic stream, measuring travel time, congestion levels and shortest paths, and suggesting alternative routes in the transportation networks. Utilizing scenario simulations, GIS allows planners to discover optimised routes to reduce congestion while enhancing connectivity between important points [34]. One of the most widely used GIS methods is the Origin-Destination (OD) Matrix Analysis Tool, which analyzes trip generation zones and trip destinations to produce quantitative results on usage patterns and travel demand across specific corridors. This information enables planners to optimize public transport routes and to identify priority areas for infrastructure improvements in regions experiencing high travel demand [35]. Overlay Analysis involves combining spatial datasets (e.g., land use, traffic networks) to assess the effectiveness of planning solutions. This method offers an integrated perspective on urban features and how traffic interacts with them [36], which urban planners can use to justify either new roads or new zoning. Heat Maps also show differences in pollution emissions in terms of the impact on the environment, such as CO2 emissions (money trail). Thus, these maps play a crucial role in making green policies since they focus on areas with the most environmental impact [37]. Together, these GIS tools lead planners to visualize, emulate and enforce effective answers for coordination, environmental impact moderation, and metropolitan planning and optimization.
2.7 Research gap and study contribution
Many studies in traffic engineering and urban planning had focused on solving congestion problems in large cities, especially in high-income countries. These researches usually used advanced simulation tools, large-scale data sets, and tested solutions in wide roads or organized urban systems. However, cities like Hit, which are medium-sized and have complex historic layouts and limited infrastructure, are not well covered in the literature. Also, most previous works concentrated only in one type of solution, such as road widening or signal timing, but not comparing between engineering, planning, and administrative options together.
Another point is that very few studies applied multi-criteria analysis (MCA) with spatial data to evaluate the traffic performance of different scenarios. The integration between MCA and GIS is still limited in many developing countries, especially in urban traffic studies. Also, the process of giving weights to different criteria in these tools is not often explained clearly or supported by real conditions on the ground.
This research tries to fill this gap by providing a practical and comparative assessment of traffic solutions in one of the most congested parts of Hit city. It combines field data, traffic volume measurements, and delay analysis with MCA scoring for three categories of solutions. By doing so, it aims to give not only academic findings but also real suggestions that can be applied by decision makers and local planners. The methodology used in this study can also be used in other similar Iraqi cities that have same challenges and limitations.
The project took an integrated approach towards the traffic challenges within the study area, starting with field data collections, through analysis, and ending with the design and testing of solutions.
3.1 Field data collection
The existing field data was collected through proven traffic engineering methodologies to know the traffic condition in the current practice and find out the major issues. For manual traffic surveys, techniques were deployed to record the number of vehicles at potential observation points, including high-traffic intersections and access points. Observation points were selected based on a GIS-based density mapping of traffic flows, ensuring coverage of both primary (Al-Sa’a Intersection) and secondary (Al-Jari Street) corridors. A total of 5 observation stations were distributed along critical nodes identified by preliminary field visits and satellite imagery.
It records data in 15- to 30-min intervals while separating vehicles into three categories, including passenger cars, trucks, and motorcycles, formatting all data collected quickly and systematically according to a structure that only uses structured data sheets for accurate documentation. The survey sample consisted of 12 hours of observation over three distinct peak and off-peak periods across weekdays (Tuesday and Saturday), capturing approximately 1,100 vehicle passages. This was deemed representative of average traffic patterns in Hit City, as confirmed by prior traffic reports from local authorities.
Also, road performance was measured through surveys of travel time. This included SHV vehicle GPS tracking on targeted roads and calculating travel times during peak and non-peak hours to determine average travel times and identify congestion points. Manual counts were chosen due to the limited availability of automated counting equipment in the study area; however, GPS-based data loggers were used to validate 15% of the manual observations, reducing potential human error.
3.2 Data analysis
The gathered data were analyzed to assess traffic performance and detect areas of high congestion. The fundamental relationship between flow (Q), density (K), and speed (V) was applied to measure operational efficiency, with density estimated from the formula:
K = Q / V
To enhance the reliability of this calculation, data from GPS travel-time measurements were cross-checked against manual counts, with a variance of less than 5% observed, confirming data consistency.
Congestion hotspots were identified by analyzing travel-time data and delay, revealing locations with frequent congestion and irregular flow patterns requiring immediate intervention. A delay index (DI) was calculated as:
DI = (Tₐ − Tᵢ) / Tᵢ
where, Tₐ is the actual travel time and Tᵢ is the ideal travel time (at a free-flow speed of 80 km/h). DI values exceeding 0.3 were flagged as critical congestion zones.
In addition, GIS-based KDE was employed to spatially visualize congestion hotspots along Al-Sa’a Intersection and Al-Jari Street. This spatial analysis was combined with Origin-Destination (OD) patterns derived from driver surveys (N = 120), providing both quantitative and qualitative insights into traffic movement.
3.3 User surveys
A survey was used to capture users' views, where a representative sample of drivers and pedestrians were chosen. The survey resulted the key congested areas, peak congestion time and user suggestions. Public input was integrated into the solution design process by analyzing responses with simple statistical methods, like percentages.
3.4 Solutions: Design and evaluation
In light of these findings, we proceeded to propose potential solutions and assess their feasibility and effectiveness. Inexpensive solutions that have improved navigation and flow by the installation of additional traffic signage, reorganization of roadside parking, and optimization of traffic signal timings. The expected results of the implementation of these solutions were also analysed through their potential traffic performance improvement, travel time and user satisfaction enhancement.
3.5 Determining weights for multi-criteria analysis
The process of assigning weights to each evaluation criterion in the MCA model was based on a structured local expert consultation. A focus group was conducted with municipal planners, traffic police officers, and engineers from Hit City to capture their practical insights on the relative importance of key factors such as traffic efficiency, cost, environmental impact, and public acceptance.
Participants were asked to rank these criteria according to their perceived importance in addressing traffic challenges in Al-Sa’a Intersection and Al-Jari Street. Rankings were normalized and converted into relative weights using a consensus-based method. While this approach does not follow formal AHP or Delphi techniques, it provides a pragmatic and context-sensitive framework for decision-making, especially under time and data constraints.
3.6 Results and documentation
The findings were shared in tables and charts showcasing field data, traffic analysis, and the advantages of suggested solutions. The presentation highlighted the present traffic operations, congested hot spots and expected improvements from the proposed actions. Surface data were analyzed and documented using supporting tools, such as Microsoft Excel, and field observations offered qualitative insights to complement the quantitative conclusions.
3.7 Description of the study area: Hit City and Al-Sa’a Intersection with Al-Jari Street
3.7.1 Hit City overview
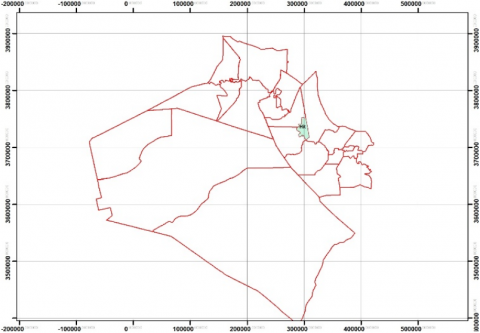
Hit City is a historic urban area on the bank of the Euphrates River in Anbar Governorate, Iraq. Geographically, Fallujah occupies a span of 787,300 hectares, constituting 5.7% of Anbar, is located at the coordinates (33°38′0″N 42°50′0″E / 33.63333°N 42.83333°E); location of Fallujah within Anbar province:38°42′50″N 42°51′10″E (33°38′0″N 42°50′0″E / 33.63333°N 42.83333°E) The city has deep historical roots, with evidence of human habitation beginning in ancient Mesopotamian times. Hit is famous for its bitumen (asphalt) production, which was essential for Mesopotamian construction and trade. Historically serving as a major crossroads for trade routes and military campaigns between Baghdad and the Levant, the city occupies a strategic location (Figure 1).
Figure 1. Hit City
3.7.2 Geography and the structure of cities
Hit is flanked by varying terrain, from the fertile Euphrates River to the north to vast stretches of desert plains to the south and west. Its historical development is written into the urban fabric, since it began as a walled settlement and grew outward into a sprawling town subdivided into districts. The city has developed as a commercial and administrative center of the region. Historical features like ancient fortifications and the Grand Mosque still play a significant role in its identity.
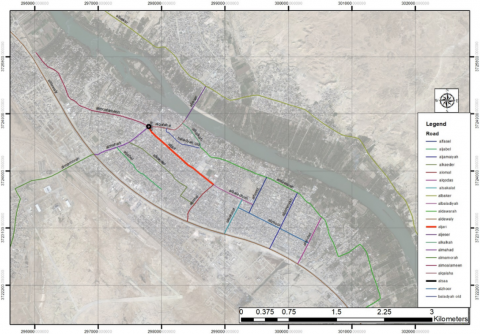
3.7.3 Intersection of Al-Sa'a and Al-Jari Street
The Al-Sa’a Intersection and Al-Jari Street are crucial links within the city’s transport and economic networks. The intersection is located within the landing business center, which is a critical link in Hit to regional and national highways. Currency exchange shops, for example, can be found on Al-Jari Street, which runs parallel to the Euphrates and is a lifeline for residents and for those transiting between cities. Because this region is close to businesses, schools, and housing, it sees a high volume of foot and vehicle traffic.
Located at Al-Sa'a Intersection, a symbol of a modernizing city plagued by urban issues such as congestion and poor infrastructure. As a prominent feature in the urban fabric, it underlines the importance of a focus on the transformation process of the road network in Hit City through the lens of urban development and transportation planning (Figure 2).
Figure 2. Intersection of Al-Sa'a and Al-Jari Street
3.7.4 Strategic importance
Hit's location at important junctures also highlights the city as a logistical and cultural connector between parts of Iraq and the like of Syria and Jordan to the west here. Recent interventions at the Al-Sa'a Intersection and Al-Jari Street are modern attempts to provide solutions to congested traffic while allowing Hit to continue to thrive as an important part of the axis of civilization while continuing to preserve its rich cultural and historical heritage.
This section analyzes field data from Al-Jari Street and Al-Sa'a Intersection in the city of Hit. The main goal is to analyze traffic flow characteristics and determine the patterns of peak-hour congestion and how adjacent roads contribute to the delay such as Al-Mu’allimeen Street and the Institute Entrance. Using universally recognized urban transport metrics such as traffic density, traffic flow and traffic delay, the findings of this analysis provide pragmatic insights and solutions that can improve operational efficiency.
4.1 Diagnostic analysis of traffic performance in the study area
1) Observation Period: Data were collected between 7:00 AM and 7:00 PM, covering three key peak periods:
Morning (7:00–9:00 AM)
Midday (1:00–3:00 PM)
Evening (5:00–7:00 PM)
2) Vehicle Classification: Vehicle counts included private cars, taxis, light-duty trucks, and small buses to capture variations in flow and loading impacts.
3) Indicators and Analysis Tools: Key performance indicators (KPIs) included:
Traffic Flow (Q): Total vehicles passing a point per hour.
Density (K): Vehicles per kilometer.
Speed (V): Average speed in kilometers per hour.
Delay Metric: Calculated as the difference between actual travel time and ideal travel time. These metrics were analyzed using principles from the Highway Capacity Manual (HCM) to ensure consistency and reliability.
4.1.1 Observed traffic patterns by time period
Morning Peak (7:00–9:00 AM): An average hourly flow of 160 vehicles was observed, predominantly private cars commuting for work or school. High volumes necessitate traffic management interventions to address congestion at critical junctions.
Midday Peak (1:00–3:00 PM): Commercial vehicles, particularly trucks, were more prominent during this period, averaging 140 vehicles per hour. Heavy trucks contributed significantly to queuing effects at the Al-Sa’a Intersection.
Evening Peak (5:00–7:00 PM): Traffic volumes increased again to approximately 150 vehicles per hour, driven mainly by taxis and small buses. This period aligns with the end of the workday, requiring targeted measures to improve intersection capacity (Table 1).
Table 1. Vehicle distribution by time period (Al-Jari Street)
|
Time Period |
Private Cars |
Taxis |
Light Trucks |
Small Buses |
Total |
|
7:00–9:00 AM |
310 |
25 |
35 |
30 |
400 |
|
1:00–3:00 PM |
200 |
15 |
50 |
25 |
290 |
|
5:00–7:00 PM |
280 |
35 |
40 |
45 |
400 |
4.1.2 Density, delay, and congestion assessment
Density (K): Using the fundamental traffic flow relationship:
Q = K × V
Density peaks of 60 vehicles per kilometer were recorded during both morning and evening rush hours—approximately 30% higher than midday levels. These findings highlight the need for strategic interventions to stabilize flow under high demand.
Delay Measurement: Delay was calculated as the difference between actual travel time and ideal travel time (estimated at 2 seconds per vehicle). Significant delays were observed during peak hours, particularly near merge points from Al-Mu’allimeen Street and the Institute Entrance (Table 2).
Table 2. Average delay by time period (Al-Jari Street)
|
Time Period |
Total Vehicles |
Total Delay (sec) |
|
7:00–9:00 AM |
400 |
800 |
|
1:00–3:00 PM |
290 |
580 |
|
5:00–7:00 PM |
400 |
800 |
4.1.3 Impact of adjacent road networks
Al-Mu’allimeen Street and the Institute Entrance were identified as critical contributors to congestion at the Al-Sa’a Intersection. Approximately 35% of morning peak-hour traffic originated from the Institute Entrance. Heavy trucks were particularly impactful, reducing throughput and increasing queue lengths, especially when merging with passenger vehicle flows.
4.1.4 Operational capacity analysis: Design standards vs. Actual conditions
Al-Jari Street serves as one of the key traffic corridors in Hit City, connecting major areas such as Al-Sa’a Intersection, Al-Mu’allimeen Street, and the Institute Entrance. Based on design standards and field survey data, the street exhibits significant discrepancies between its design capacity and actual operational performance.
Width and Number of Lanes
Design Standards: Al-Jari Street was designed to be 40 meters wide with four lanes in each direction.
Actual Conditions: The street is currently 30 meters wide, maintaining the same number of lanes. This discrepancy reduces the operational capacity by approximately 25% compared to the design.
Traffic Density
Recorded Density: Daily traffic volume reached 10,059 vehicles on Tuesday and 14,254 vehicles on Saturday.
Design Capacity: The street is designed to accommodate up to 16,000 vehicles per day. However, factors such as uneven flow and the presence of heavy vehicles significantly reduce operational efficiency.
Level of Service (LOS)
Design Target: The street was designed to provide a LOS B, ensuring smooth traffic flow.
Actual Performance: Data indicates that the street operates at LOS E during peak hours (morning, midday, and evening), reflecting high congestion levels and prolonged delays.
Carbon Emissions
Design Expectations: Under ideal conditions, emissions are minimized through stable operating speeds (80 km/h) and uninterrupted flow.
Actual Conditions: Traffic congestion and reduced operating speeds at certain times increase CO2 emissions, averaging 800 g/km.
4.2 Evaluation of proposed traffic solutions
The study analyzed the traffic problems in the area, specifically Al-Jari Street and Al-Sa’a Intersection, and proposed three main types of solutions: engineering, planning, and administrative. Each solution aims to address specific challenges to improve traffic flow, reduce delays, and enhance transport sustainability.
4.2.1 Engineering interventions for infrastructure improvement
Engineering solutions focus on improving the infrastructure of the road through widening the street, constructing flyovers or tunnels, and dedicating lanes for heavy vehicles. Table 3 presents the details of the engineering solutions, including the current condition, proposed actions, and expected impacts.
Table 3. Proposed engineering solutions
|
Engineering Solution |
Current Condition |
Proposed Action |
Expected Impact |
|
1. Street Widening |
- The street width is currently 30 meters compared to the recommended design width of 40 meters. |
- Widen the street to 40 meters to increase capacity and improve traffic flow. |
- Increase traffic capacity by approximately 25% (from 10,059 vehicles/day to over 13,000 vehicles/day). |
|
- Reduce traffic density KKK from 60 vehicles/km to 40 vehicles/km. |
|||
|
2. Construction of Flyovers or Tunnels |
- Al-Sa’a Intersection experiences significant congestion due to heavy inflow from connected roads such as Al-Mu’allimeen Street and the Institute Entrance. |
- Build flyovers or tunnels at Al-Sa’a Intersection to ensure uninterrupted traffic flow and reduce congestion. |
- Reduce traffic delay by up to 40% using the delay formula: |
|
Delay=Actual Travel Time−Ideal Travel Time |
|||
|
- Improve the Level of Service (LOS) from E to C or B. |
|||
|
3. Dedicated Lanes |
- High traffic density causes interference between light vehicles and heavy trucks, leading to slower speeds. |
- Designate dedicated lanes for heavy trucks to minimize their impact on light vehicle flow. |
- Improve operational speed VVV for light vehicles by approximately 20%. |
|
- Introduce dedicated bus lanes to promote public transport use. |
- Enhance traffic flow Q using the relationship: Q=K⋅V |
||
|
4. Improved Design of Entrances/Exits |
- Entrances from connected roads (e.g., the Institute Entrance) contribute significantly to congestion at Al-Sa’a Intersection. |
- Expand the entrances and exits to reduce bottlenecks and improve merging. |
- Reduce queue lengths at entrances by up to 30%. |
|
- Install directed traffic signals to better guide vehicle movement. |
- Ensure sustainable traffic flow at critical points and improve driver experience. |
4.2.2 Planning-based alternatives and route optimization
Planning solutions aim to optimize land use, promote public transport, and establish alternative routes to reduce reliance on private vehicles. Table 4 illustrates how these solutions reduce traffic flow and emissions using the appropriate equations.
Table 4. Planning solutions
|
Planning Solution |
Current Condition |
Proposed Action |
Expected Impact |
|
1. Enhancing Public Transport |
- Heavy reliance on private cars leads to high traffic density and environmental pollution. |
- Expand public transport networks (e.g., buses, shared taxis). |
- Reduce traffic flow using the equation: ΔQ=Qcurrent−Qafter improvement |
|
- Decrease traffic flow Q current by up to 20% through reduced private car usage. |
|||
|
- Reduce CO2 emissions by up to 25%. |
|||
|
2. Establishing Alternative Routes |
- Main routes such as Al-Jari Street and Al-Sa’a Intersection experience bottlenecks during peak hours. |
- Design side roads and alternative routes to divert part of the traffic flow from the main roads. |
- Reduce the number of vehicles on the main road by estimating diverted vehicles using simulation. |
|
- Improve traffic flow QQQ and decrease delay times at critical intersections. |
|||
|
- Relieve pressure on current roads by up to 30%. |
|||
|
3. Optimizing Land Use |
- Commercial and residential activities in surrounding areas cause random vehicle inflows to main roads. |
- Replan land use to reduce vehicle-dependent trips and encourage active transportation (walking, cycling). |
- Reduce traffic flow by decreasing the number of local trips by up to 15%. |
|
- Enhance sustainable transport efficiency and reduce reliance on private vehicles. |
4.2.3 Administrative measures for traffic regulation
Administrative solutions involve regulating truck movements, optimizing traffic signals, and managing parking to reduce delays and improve flow. Table 5 highlights the specifics of these solutions.
Table 5. Administrative solutions
|
Administrative Solution |
Current Condition |
Proposed Action |
Expected Impact |
|
1. Smart Signal Management |
- Current signals are fixed-timed and do not adapt to traffic flow changes, causing long queues at intersections. |
- Implement smart traffic signals using sensors to adapt signal timing based on real-time traffic flow. |
- Reduce delay time using the equation: New Delay Time=Current Delay Time−Δ Signal Timing |
|
- Decrease delay times by up to 30% at critical intersections. |
|||
|
- Improve overall traffic flow by up to 20% due to reduced stop times. |
|||
|
2. Regulation of Truck Movements |
- Heavy trucks contribute significantly to road congestion during peak hours, negatively impacting light vehicles. |
- Enforce time restrictions on truck movements during peak hours and allocate specific time windows for their operation. |
- Reduce total traffic flow during peak hours using the equation: |
|
Q After Regulation=Q Current−Q Trucks |
|||
|
- Decrease traffic density and improve flow speed Q by up to 15%. |
|||
|
3. Improved Parking Management |
- Random roadside parking disrupts traffic flow and reduces lane efficiency. |
- Establish dedicated parking zones away from main roads and implement smart parking management systems. |
- Reduce the impact of random parking on traffic flow, leading to a 10% improvement in operational speed. |
|
- Enhance overall delay times by minimizing fixed obstacles. |
4.2.4 Importance of solutions
Tables 3-5 demonstrate that the proposed solutions complement each other to achieve the following objectives:
Improve traffic flow and reduce delays.
Enhance environmental sustainability by lowering emissions.
Improve user experience by reducing traffic queues.
4.2.5 Multi-criteria weighted scoring of proposed interventions
The weighted scoring model evaluates the three proposed solutions (engineering, planning, and administrative) using a set of criteria that reflect traffic efficiency, financial feasibility, environmental impact, and social acceptance. This model aims to identify the optimal solution by providing a balanced analysis that highlights the differences between options and prioritizes clear decision-making.
Table 6. Evaluation table
|
Alternative |
Traffic Efficiency (40%) |
Delay Reduction (25%) |
Cost (20%) |
Environmental Impact (10%) |
Social Impact (5%) |
Final Score |
|
Engineering |
9 |
9 |
5 |
7 |
6 |
7.9 |
|
Planning |
8 |
8 |
8 |
8 |
9 |
8.2 |
|
Administrative |
7 |
7 |
9 |
6 |
8 |
7.6 |
In the evaluation process, key criteria include traffic efficiency, delay reduction, cost, environmental impact, and social acceptance. Traffic efficiency assesses the improvement in flow and density, while delay reduction focuses on minimizing travel time delays through the proposed solutions. Cost evaluates the financial feasibility of each alternative compared to available resources. Environmental impact considers the potential reduction in emissions and air quality improvement, while social acceptance evaluates user satisfaction and the overall experience of road users. Each criterion is assigned a relative weight based on its significance: traffic efficiency (40%), delay reduction (25%), cost (20%), environmental impact (10%), and social acceptance (5%). Each alternative is scored on a scale from 1 to 10 for every criterion, and the scores are multiplied by their respective weights to calculate a final score for each solution (Table 6).
The evaluation reveals that the planning solution achieves the highest score of 8.2, making it the most balanced option in terms of traffic efficiency, delay reduction, environmental impact, and social acceptance. This solution offers long-term sustainability by promoting public transport and reducing reliance on private vehicles. The engineering solution follows with a score of 7.9, offering substantial improvements in infrastructure and traffic capacity. However, it requires significant financial resources and a longer implementation timeline. The administrative solution, with a score of 7.6, stands out as the most cost-effective and rapidly deployable option, making it ideal for addressing immediate traffic challenges. However, it provides limited long-term benefits compared to the other alternatives.
4.3 Comparative discussion and synthesis
This study is a comprehensive solution on the Al-Jari Street and Al-Sa’a Intersection area that focused on analyzing the traffic problems and determine the critical points and propose solutions to improve traffic performance. This analysis depended on sound field data, established mathematical traffic engineering models, and a multi-criteria assessment framework for validating a rigorous and actionable results output.
4.3.1 Interpretation of traffic performance findings
Field data collection composed of a series of manual surveys to quantify traffic volumes, traffic density, and traffic speed of vehicles passing through a series of intersections, as well as travel time surveys conducted to locate the streets responsible for most of the observed traffic delays. This approach was based on the basic flow–density–speed relationship (Q = K⋅V), which in turn helped identify locations experiencing traffic congestion. The findings noted that most of the traffic occurs in the morning and evening, especially at key community access points, such as the Institute Entrance and Al-Mu’allimeen Street.
4.3.2 Effectiveness of proposed solutions: A comparative perspective
As a result of the operational performance analysis, the study determined that Al-Jari Street does experience a low LOS during peak hours, indicating excessive congestion and long delays. The existing road with a 30 m width was found inadequate for daily traffic density, causing an irregular flow, and longer period for this fleet. The environmental impact was demonstrably higher CO2 emission with frequent stops and interruptions.
4.3.3 Implications of the weighted scoring model
Three primary alternatives were proposed to address the identified issues:
Engineering Solutions: These included road widening, constructing flyovers or tunnels, and dedicating lanes for heavy vehicles. These solutions demonstrated significant potential, increasing traffic capacity by up to 25% and reducing delays by approximately 40%.
Planning Solutions: Focused on enhancing public transport, creating alternative routes, and optimizing land use, these solutions effectively reduced dependence on private vehicles, lowered environmental emissions, and improved user experience.
Administrative Solutions: These involved optimizing signal timings, regulating truck movements, and improving parking management. Administrative solutions proved to be cost-effective and quick to implement, providing immediate improvements in traffic flow.
4.3.4 Integrated discussion: Toward a sustainable traffic strategy
A weighted scoring model was employed to quantify the alternative options by way of specific evaluation criteria, including traffic efficiency, delay savings, implementation cost, environmental impact, and social acceptance. The relative weights used in this model were determined through a structured local expert consultation, as explained in section 3.5, which involved ranking the criteria by transportation professionals and municipal planners in Hit City. Due to its strong alignment with long-term sustainability goals and moderate implementation costs, the planning solution received the highest overall score. The engineering solution ranked second, offering transformative potential but requiring substantial infrastructure investment. The administrative solution was placed third, providing fast and cost-effective improvements suitable for short-term gains, yet with limited long-term impact.
The comparative assessment of the three solution categories (Tables 3-6) highlights the structural differences in their impact, feasibility, and sustainability. Planning solutions outperformed others, achieving a final weighted score of 8.2/10, primarily because they integrate long-term environmental and social benefits with moderate implementation costs. Enhancing public transport and establishing alternative routes were found to reduce private car dependency by approximately 20–25%, which directly lowers CO₂ emissions by around 20% and improves overall travel reliability. These outcomes align with global best practices for sustainable urban mobility.
Engineering solutions, despite achieving the highest immediate improvement in traffic capacity (up to 40% delay reduction), are constrained by high capital costs, prolonged construction timelines, and potential disruption to local businesses during implementation. Conversely, administrative solutions—such as optimized signal timing and truck movement regulation—offered rapid, low-cost improvements (up to 15% flow enhancement) but lack the ability to produce structural, long-term benefits without integration with planning interventions.
The analysis suggests that a hybrid approach, beginning with administrative measures for short-term relief, followed by planning solutions for medium- to long-term transformation, can deliver a balanced strategy for congestion mitigation. Furthermore, combining engineering enhancements with land-use optimization maximizes the overall effectiveness and resilience of the transport network.
The study aimed to evaluate the performance of different traffic management solutions for Al-Sa’a Intersection and Al-Jari Street in Hit City. The research compiles field data collection, mathematical modeling, and multi-criteria evaluation to provide a thorough understanding of the traffic problems in the region and potential effective options for enhancing results.
The results highlight the critical role that a holistic and integrated approach to traffic management needs to play, combining engineering, planning and administrative solutions. After analyzing the available data, we found that the existing road infrastructure is ill-equipped to handle high volumes of traffic because of the narrow street width and insufficient capacity, resulting in severe, albeit predictable, congestion, particularly during peak hours. Traffic flow models and delay analysis was implemented to identify the most critical areas that required intervention this included the bottlenecks that exists at critical entry points to the city, like the Institute Entrance and Al-Mu’allimeen Street.
All the possible solutions were evaluated using a systematic process, with the planning solution emerging as the most balanced and sustainable solution out of all of them. The solution he offered was on improving public transport and the construction of alternate route to reduce dependency on private vehicles which is in line with long-term sustainability. An engineering fix, while effective in the short term for reducing congestion, comes at a considerable cost and will take time to implement. The administrative approach is less expensive and easier to scale quickly, but it provides fewer long-term benefits.
They stressed the need to coordinate land use and transportation planning and optimize road network design to prepare for growth in the future. Policies that strengthen the existing road network/traffic flow and policy measures provide comprehensive solutions to the traffic issues in Al-Sa’a Intersection and Al-Jari Street by alleviating traffic congestions.
In the end, the research highlights that a well-planned combination of these solutions, considering the unique requirements of the region, will be key to supporting mobility, mitigating congestion, and promoting a better quality of life for Hit City residents and travelers.
However, this study is limited by its focus on only two critical locations in Hit City, which may restrict the generalizability of its conclusions to other urban contexts. In addition, the data were collected during specific peak and off-peak periods within a short timeframe, which may not fully capture seasonal variations in traffic behavior.
Future research should extend the multi-criteria evaluation framework to other intersections and cities of similar scale, incorporating longer-term data collection and advanced simulation tools (e.g., microsimulation models) to assess dynamic traffic conditions. In particular, environmental impact analyses, such as detailed CO₂ and NOₓ emission modeling, should be integrated into the framework to support sustainability goals.
From a policy perspective, the proposed methodology can be adopted by local and regional authorities as a decision-support tool. Its emphasis on balancing traffic efficiency, cost, and environmental sustainability makes it adaptable to other medium-sized cities facing similar challenges.
To develop more integrated, sustainable and effective solutions, this study concludes with a number of holistic recommendations provided for finding solutions to the prevailing traffic problems in Al-Sa’a Intersection and Al-Jari Street. When it comes to implementation, this should ideally start with administrative measures to obtain immediate throughput gains, e.g. by adjusting signal timings, managing truck flows and parking. Such measures can provide quick relief as more elaborate strategies get hammered out. As time goes by, integration of planning solutions will be essential, focusing on improvements in public transport systems, construction of alternative roads, and long-term land use, etc. This ordinance also includes engineering solutions that can be strategically implemented to expand road capacity to cater to demand, and mitigate associated bottlenecks such as Al-Jari Street being doubled to design standards to accommodate expected volumes, and construction of grade-separated facilities at that Al-Sa’a Intersection to ensure traffic continues to flow without interruption.
Technology and data-driven approaches play a critical role in this process. Use of GIS to monitor traffic patterns, locate congestion hotspots, and measure the effectiveness of measures put in place. Double the number of high-traffic roads should rely on adaptive traffic signal systems, which automatically adjust in real-time to improve flow efficiency. Accessibility and reliability of public transport must improve to reduce dependence on private vehicles in order to promote sustainable mobility. Finally, active transportation (walking, cycling) should be promoted via improved infrastructure (e.g. wider sidewalks, more bike lanes) and urban design.
Engagement of stakeholders is critical to the success of these interventions. It’s important that local authorities, businesses and community members are involved in the planning and implementation processes to help ensure that solutions are tailored to suit the needs and priorities of the community. Establish regular feedback mechanisms in the form of surveys and workshops to refine strategies as needed. Lastly, with the development of a traffic management solution, a continuous monitoring and evaluation framework should be implemented to track the performance of these implemented solutions, and ensure that a process for optimizing and adjusting the strategies forms according to changing urban development trends and traffic conditions. These recommendations are intended to provide immediate improvements while establishing the foundation for a sustainable and efficient urban transport system in Hit City.
[1] Bertolini, L., Le Clercq, F., Straatemeier, T. (2008). Urban transportation planning in transition. Transport Policy, 15(2): 69-72. https://doi.org/10.1016/j.tranpol.2007.11.002
[2] Mesentier, T., Orrico, R. (2024). Transportation oriented to urban development. Cadernos Metrópole, 26: 489-509. https://doi.org/10.1590/2236-9996.2024-6005.e
[3] Al-Hussaini, Z.I., Jassim, A.H., Alkinani, A.S. (2023). The 20 minutes neighborhood between planning and reality: Analytical study of Al-Jumhuriya district (District 838 and Part of District 840). Civil Engineering and Architecture, 11(2): 696-713. https://doi.org/10.13189/cea.2023.110212
[4] Wey, W.M., Huang, J.Y. (2018). Urban sustainable transportation planning strategies for livable City's quality of life. Habitat International, 82: 9-27. https://doi.org/10.1016/j.habitatint.2018.10.002
[5] Mahmood, M.A., Al-Rawe, M.K. (2023). Spatial analysis of vegetation using GIS and remote sensing data. IOP Conference Series: Earth and Environmental Science, 1129(1): 012001. https://doi.org/10.1088/1755-1315/1129/1/012001
[6] Gallez, C., Kaufmann, V., Maksim, H., Thebért, M., Guerrinha, C. (2013). Coordinating transport and urban planning: From ideologies to local realities. European Planning Studies, 21(8): 1235-1255. https://doi.org/10.1080/09654313.2012.722945
[7] Xu, C., Qu, Z.W., Chen, X.M. (2014). Analysis of traffic flow speed-density relation model characteristics. Journal of Highway and Transportation Research and Development (English Edition), 8(4): 104-110. https://doi.org/10.1061/JHTRCQ.0000418
[8] Wang, H., Ni, D., Chen, Q.Y., Li, J. (2013). Stochastic modeling of the equilibrium speed-density relationship. Journal of Advanced Transportation, 47(1): 126-150. https://doi.org/10.1002/atr.172
[9] Knoop, V.L. (2021). Traffic Flow Theory: An Introduction with Exercises. TU Delft OPEN Publishing. https://doi.org/10.5074/T.2021.002
[10] Xie, S., Rieders, M., Changolkar, S., Bhattacharya, B.B., Diaz, E.W., Levy, M.Z., Castillo-Neyra, R. (2024). Enhancing mass vaccination programs with queueing theory and spatial optimization. Frontiers in Public Health, 12: 1440673. https://doi.org/10.3389/fpubh.2024.1440673
[11] Yu, C., Zhang, J., Yao, D., Zhang, R., Jin, H. (2016). Speed-density model of interrupted traffic flow based on coil data. Mobile Information Systems, 2016(1): 7968108. https://doi.org/10.1155/2016/7968108
[12] Romanowska, A., Jamroz, K. (2021). Comparison of traffic flow models with real traffic data based on a quantitative assessment. Applied Sciences, 11(21): 9914. https://doi.org/10.3390/app11219914
[13] Zhang, J., Qu, X., Wang, S. (2018). Reproducible generation of experimental data sample for calibrating traffic flow fundamental diagram. Transportation Research Part A: Policy and Practice, 111: 41-52. https://doi.org/10.1016/j.tra.2018.03.006
[14] Anjomani, A. (2021). An integrated land-use/transportation forecasting and planning model: A metropolitan planning support system. Journal of Transport and Land Use, 14(1): 65-86. https://doi.org/10.5198/jtlu.2021.1412
[15] Nigro, A., Bertolini, L., Moccia, F.D. (2019). Land use and public transport integration in small cities and towns: Assessment methodology and application. Journal of Transport Geography, 74: 110-124. https://doi.org/10.1016/j.jtrangeo.2018.11.004
[16] Hassan, H.M.M., Alkinani, A.S. (2022). Challenges facing the transition of traditional cities to smart: Studying the challenges faced by the transition of a traditional area such as Al-Kadhimiya city center to the smart style. AIP Conference Proceedings, 2437(1): 020193. https://doi.org/10.1063/5.0093103
[17] Stanley, J.K. (2014). Land use/transport integration: Starting at the right place. Research in Transportation Economics, 48: 381-388. https://doi.org/10.1016/j.retrec.2014.09.067
[18] Alourafi, S.N., Alrawi, A.K. (2020). Integration urban land use planning with transportation planning: An evaluation toward sustainable transportation for the holy city of Karbala. IOP Conference Series: Materials Science and Engineering, 737(1): 012242. https://doi.org/10.1088/1757-899X/737/1/012242
[19] Abid, E.H., Alkinani, A.S., Abudlmunim, S.A. (2020). The compact city and urban image of the traditional city center. IOP Conference Series: Materials Science and Engineering, 737(1): 012236. https://doi.org/10.1088/1757-899X/737/1/012236
[20] Wang, Y., Wu, L. (2010). Integrated land-use and transportation models. In 2010 18th International Conference on Geoinformatics, Beijing, China, pp. 1-4. https://doi.org/10.1109/GEOINFORMATICS.2010.5567835
[21] Dur, F., Yigitcanlar, T. (2015). Assessing land-use and transport integration via a spatial composite indexing model. International Journal of Environmental Science and Technology, 12(3): 803-816. https://doi.org/10.1007/s13762-013-0476-9
[22] Weisbrod, G., Vary, D., Treyz, G. (2003). Measuring economic costs of urban traffic congestion to business. Transportation Research Record, 1839(1): 98-106. https://doi.org/10.3141/1839-10
[23] Witkowski, J.M. (1988). Benefit analysis for urban grade separated interchanges. Journal of transportation engineering, 114(1): 93-109. https://doi.org/10.1061/(ASCE)0733-947X(1988)114:1(93)
[24] Rebolj, D., Sturm, P.J. (1999). A GIS based component-oriented integrated system for estimation, visualization and analysis of road traffic air pollution. Environmental Modelling & Software, 14(6): 531-539. https://doi.org/10.1016/S1364-8152(99)00017-1
[25] Namdeo, A., Mitchell, G., Dixon, R. (2002). TEMMS: An integrated package for modelling and mapping urban traffic emissions and air quality. Environmental Modelling & Software, 17(2): 177-188. https://doi.org/10.1016/S1364-8152(01)00063-9
[26] Kumarasinghe, L.H.M.K., Pushpakumara, T.D.C. (2024). Identification of traffic hotspots in CMC area and study of flow dynamics around them using GIS & RS techniques. In Proceedings from the 17th Transport Research Forum 2024, University of Moratuwa, Sri Lanka, pp. 18-20. https://doi.org/10.31705/TRF.2024.6
[27] Taylor, M.A., Woolley, J.E., Zito, R. (2000). Integration of the global positioning system and geographical information systems for traffic congestion studies. Transportation Research Part C: Emerging Technologies, 8(1-6): 257-285. https://doi.org/10.1016/S0968-090X(00)00015-2
[28] Xu, J., Hilker, N., Turchet, M., Al-Rijleh, M.K., Tu, R., Wang, A., Fallahshorshani, M., Evans, G.J., Hatzopoulou, M. (2018). Contrasting the direct use of data from traffic radars and video-cameras with traffic simulation in the estimation of road emissions and PM hotspot analysis. Transportation Research Part D: Transport and Environment, 62: 90-101. https://doi.org/10.1016/j.trd.2018.02.010
[29] Belton, V., Stewart, T.J. (2002). Multiple Criteria Decision Analysis. Boston, MA: Springer US. https://doi.org/10.1007/978-1-4615-1495-4
[30] Bassan, S. (2023). Interchange and comact grade separated junction: Classifications' system considerations, traffic safety, and operations overview. Journal of Engineering Research and Reports, 25(12): 43-59. https://doi.org/10.9734/jerr/2023/v25i121040
[31] Hamzah, M.J., Ebraheem, M.A. (2020). Analyzing urban attraction nodes by using GIS and space syntax (case study-Al-Adhamiya). IOP Conference Series: Materials Science and Engineering, 737(1): 012181. https://doi.org/10.1088/1757-899X/737/1/012181
[32] Batista, N., Pina, N., Tchepel, O. (2024). Modelling of glass soiling due to air pollution exposure at urban and national scales: Coimbra (Portugal) case study. Environments, 11(10): 215. https://doi.org/10.3390/environments11100215
[33] Zefreh, M.M., Török, A. (2020). Distribution of traffic speed in different traffic conditions: An empirical study in Budapest. Transport, 35(1): 68-86. https://doi.org/10.3846/transport.2019.11725
[34] Pandey, A.D., Kumar, B., Parida, M., Chouksey, A.K., Mishra, R. (2024). A machine learning-based overlay technique for improving the mechanism of road traffic prediction using global positioning system. Innovative Infrastructure Solutions, 9(8): 300. https://doi.org/10.1007/s41062-024-01622-2
[35] Rosik, P., Wójcik, J. (2022). Transport infrastructure and regional development: A survey of literature on wider economic and spatial impacts. Sustainability, 15(1): 548. https://doi.org/10.3390/su15010548
[36] Ye, F.Y., Li, Y. (2024). Road traffic infrastructure construction and air pollution based on the perspective of spatial spillover. Sustainability, 16(22): 9627. https://doi.org/10.3390/su16229627
[37] Tafidis, P., Gholamnia, M., Sajadi, P., Krishnan Vijayakrishnan, S., Pilla, F. (2024). Evaluating the impact of urban traffic patterns on air pollution emissions in Dublin: A regression model using google project air view data and traffic data. European Transport Research Review, 16(1): 47. https://doi.org/10.1186/s12544-024-00671-z