Kittichai Thanasupsin*![]() | Pongphisanu Nakkham
| Pongphisanu Nakkham![]() | Tosporn Arreeras
| Tosporn Arreeras![]() | Suchada Phonsitthangkun
| Suchada Phonsitthangkun![]()
© 2025 The authors. This article is published by IIETA and is licensed under the CC BY 4.0 license (http://creativecommons.org/licenses/by/4.0/).
OPEN ACCESS
The determinants of travel mode choice among university students and staff were examined to address a gap in campus mobility research, particularly within tropical environments. Data were obtained from 923 respondents at Mahidol University, Thailand, and analyzed through the application of the Nested Logit Model (NLM), which accounts for hierarchical decision structures across six travel modes: trams, bicycles, motorcycle taxis, private motorcycles, private cars, and walking. Exploratory factor analysis was employed to identify latent constructs influencing satisfaction, including comfort, built environment, and flexibility. The analysis indicated that active and shared modes, particularly trams and walking, were generally preferred. Travel time, cost, and scheduling flexibility were found to be key determinants of mode selection, with flexibility exerting a positive influence and travel time and cost acting as constraints. Weather-related factors were not statistically significant, suggesting that infrastructural conditions may mitigate climatic impacts on active travel. Elasticity analysis further demonstrated that changes in service attributes can prompt modal shifts between motorized and active travel. It is concluded that integrating attitudinal and contextual variables into discrete choice modeling offers a deeper understanding of mode choice behavior in campus environments. Policy implications include the enhancement of shaded pathways, the improvement of service reliability, and the adoption of flexible scheduling strategies to promote sustainable and health-supportive mobility. These findings provide a framework for the development of targeted campus transport policies in climate-sensitive settings.
campus mobility, active transport, Nested Logit Model, travel mode choice, behavior
Active travel, defined as transportation modes relying on the body's energy, involves activities like walking or cycling and is typically associated with short-distance trips. Common purposes include commuting to work or school, on-campus travel, and reaching transportation hubs for passenger trains. This mode of travel promotes a healthier lifestyle and reduces carbon emissions [1-4]. Moreover, a study has demonstrated that active travel significantly diminishes the risk of chronic diseases, contributing to a lower likelihood of illness and mortality [5]. Travel mode choice is a crucial decision for individuals when planning their trips. Various factors influence travel mode choice, including personal preferences [6], cost, convenience, accessibility, built environment [7-9], weather [6, 10], flexible work hours [11], and gender [12, 13]. Women show less interest in traveling, resulting in fewer and shorter trips. Providing convenient, safe, and connected infrastructure for walking and cycling is crucial to promoting active travel. In addition to these factors, research has shown that the propensity to change travel behavior also depends on the mode of transportation primarily used by the traveler. For example, a study found that travelers who mainly use road-based [14] transit services are more likely to change their travel behavior in response to disruptions compared to those who primarily use rail services [15, 16]. Social and personal norms can also influence mode choice in the context of school trips [14]. Most studies have focused on the factors that affect mode selection for commuting to work or school and reaching transportation hubs. There have been very few studies investigating the factors that influence active travel on campus. Therefore, this research aims to identify the factors that affect the choice of active mode travel on campus.
There are various methods for determining travel mode choice behavior. One traditional method was implementing pen-and-paper questionnaire surveys through convenience sampling along major transport corridors and statistical data analysis to compare travel times and costs across different transportation modes [17]. More advanced methods, such as discrete choice models, are also employed to analyze individual decisions regarding mode choice [18]. These models consider the trade-offs individuals make between different modes of transport and help understand the underlying preferences and decision-making processes [19-22]. Studying travel mode choice behavior is essential for transportation planning and policymaking, as it can provide valuable insights into the factors influencing individuals' decisions. Understanding the influence of social and personal norms on mode choice is essential in the context of school trips. This can be achieved through in-depth qualitative interviews and surveys with students, parents, and school administrators to capture the nuances of decision-making in this context [23]. Additionally, incorporating digital tools like mobile applications or online surveys can provide real-time data on travel behavior and preferences, allowing for a more dynamic and comprehensive analysis [24].
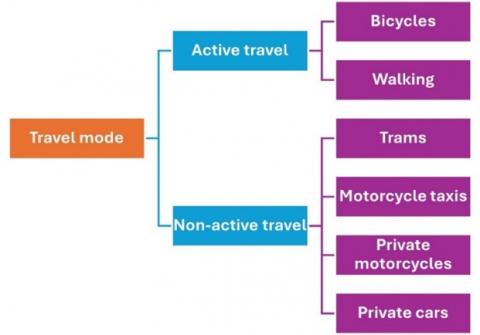
Nested logit regression modeling can be applied to examine the nested structure of mode choice, where individuals make choices at different levels of decision-making, such as choosing between modes of transportation and then choosing between different routes within a selected mode [25-29]. This modeling approach accounts for the interdependencies between different choices and allows for a more accurate representation of decision-making behavior. Multinomial logit regression modeling is another ordinarily used approach in travel mode choice analysis, where individuals choose among multiple discrete alternatives [30, 31]. These models are types of discrete choice models, and that multinomial logit is a constrained version of nested logit, or that nested logit is a generalization (more complex version) of multinomial logit. Furthermore, it is essential to consider the impact of external factors such as travel time, cost, convenience, and availability of transportation modes. The logit regression model employed in this study offers a distinct advantage over other models in that it enables the identification of the interrelationships between variables and their impact on outcomes. Exploratory factor analysis was also conducted to identify the underlying factors influencing travel mode choice [32]. Qualitative and quantitative methods, such as in-depth interviews, surveys, and digital tools can be used to investigate the factors influencing travel mode choice for school trips [33, 34]. In the current investigation, the Nested Logit Model (NLM) was specifically chosen due to the sequential nature of travel pattern selection in the examined case study. The analytical depiction of the NLM is illustrated in Figure 1.
Figure 1. Mode of transports considered for NLM analysis
In Thailand, bicycling as a recreational activity in the evening and weekend has become more popular, but students and staff do not often use on-campus activities. At some universities, walking and cycling were once common but are now less common. It is crucial to understand the factors that influence the choice of active transportation and promote its use. Mahidol University’s Salaya Campus, located on the outskirts of Bangkok, Thailand, presents an ideal context for studying campus-based travel behavior due to its distinct spatial structure, multimodal transport availability, and environmental conditions. Unlike many urban campuses, Mahidol is situated in a suburban setting with extensive green areas and a semi-closed campus design, resulting in complex travel patterns involving trams, walking, bicycles, and private vehicles. The campus also represents a microcosm of broader urban mobility issues in tropical regions, including high temperatures, seasonal rainfall, and infrastructure constraints that influence the adoption of active travel modes. Despite its significance as one of Thailand’s leading universities, empirical studies examining how students and staff navigate this mobility ecosystem remain scarce. Therefore, Mahidol University provides a representative yet underexplored case to investigate mode choice behavior in constrained, weather-sensitive, and policy-relevant campus environments.
Building on these motivations, this study aims to investigate the determinants influencing travel mode choice among university students and staff in a tropical campus environment through the application of the NLM. This model is particularly well-suited to campus settings, as it accommodates hierarchical decision-making structures and captures the interdependencies among grouped alternatives, such as active and motorized modes. In addition to the discrete choice modeling, exploratory factor analysis is employed to identify latent constructs, namely comfort, built environment, and flexibility, that influence users’ satisfaction and preferences. By integrating behavioral, attitudinal, and contextual variables, the study seeks to examine how travel time, cost, distance, and schedule flexibility affect modal decisions; to identify underlying dimensions of satisfaction shaping transport choices; and to evaluate the predictive power of the NLM within a campus-based mobility context. Accordingly, this research is guided by two primary questions: (1) What behavioral and contextual factors significantly influence the choice between active and motorized transport modes within a university campus? and (2) How effectively can the NLM capture these preferences and support the development of sustainable campus mobility strategies?
2.1 Study area
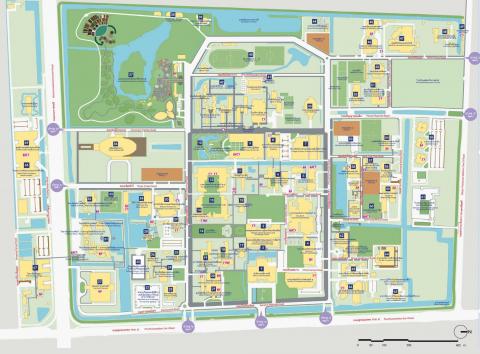
The research methodology employed in this investigation encompassed a series of steps and processes, as shown in Figure 1. A comprehensive review of relevant research conducted at both national and international levels was undertaken to establish a foundational understanding of pertinent theories. These theories were subsequently applied to conduct a thorough analysis of the collected data. Additionally, a detailed data collection plan was devised, and the acquired data was utilized to formulate and refine models in alignment with the specified research objectives. Primary data was collected through questionnaires and interviews of students and staff affiliated with Mahidol University, Salaya Campus, which spans an approximate area of 474 acres as shown in Figure 2. This primary data collection endeavor aimed to gather a broad spectrum of information pertaining to the demographic characteristics of participants, including gender, age, income, education level, attitudes, and satisfaction levels concerning various modes of transportation utilized for commuting purposes. In tandem with primary data collection, secondary data was also gathered, comprising insights gleaned from examining existing concepts, theories, and assorted research studies relating to travel mode choices. Additionally, data specific to the study area was collated, serving as a foundational reference for identifying and delineating pertinent variables employed in the research inquiry.
Figure 2. A map of Mahidol University, Salaya Campus [35]
2.2 Data collection
The data collection process specifically targeted students and staff at Mahidol University, Salaya Campus, who have experienced using six distinct transportation modes: Trams, bicycles, motorcycle taxis, personal motorcycles, personal cars, and walking. Specifically, the survey instrument was developed based on an extensive review of literature related to travel behavior, campus mobility, and active transport, drawing on validated constructs from prior empirical studies. A draft questionnaire was piloted with a group of 30 university students and staff at Mahidol University to assess face validity, clarity, and appropriateness of the questions. Feedback from the pilot test was used to refine the language and ensure item relevance to the study context.
Table 1. Overview of all data sets obtained from field data collection (n = 923)
|
Modes of Transport |
Model Development (70%) |
Model Validation (30%) |
|
Trams (TM) |
258 |
108 |
|
Bicycles (BC) |
46 |
19 |
|
Motorcycle taxis (MT) |
98 |
41 |
|
Private motorcycles (PM) |
61 |
26 |
|
Private cars (PC) |
52 |
22 |
|
Walking (WK) |
135 |
57 |
|
Total |
650 |
273 |
The target sample size was determined based on Cochran’s formula for large populations, using a 95% confidence level and 5% margin of error, which yielded a recommended minimum of 384 responses. To enhance representativeness and account for possible non-responses or exclusions, we distributed 1,000 questionnaires and obtained 923 valid responses, exceeding the recommended threshold and providing robust statistical power for model estimation [36]. The 77 excluded surveys were removed based on pre-defined quality control criteria: incomplete the survey forms, inconsistent or contradictory answers, and patterned or straight-line responses on Likert scale items indicating non-engaged responding. Notably, the data was partitioned into two segments: one designated for model development and the other for model validation, as delineated in Table 1.
2.3 Exploratory factor analysis
Factor analysis methods are used to find relationships and group variables that are related to each other into a new group of factors that are not related to each other or to reduce the number of multiple indicators of the same factor. This analysis efficiently answers the question, “Which variables are in the same factor?” since there might be a number of relationships among each factor, which can be either positive or negative. The new factor created can find that factor loading is considered if it exceeds the 0.40 ratio [37]. In this study, factor analysis was conducted to examine and confirm the research questions designed according to the behavioral framework and verify whether they are consistent and comply with the theory. The calculating factor scores were later used as representatives of the latent factors. Exploratory factor analysis (EFA) aims to reduce the number of variables related to the same factor. The Kaiser-Meyer-Olkin statistic values (KMO) were examined to measure the suitability of the sample data. In other words, it tests the adequacy of the sample size. The KMO value between 0.8 to 1.0 indicates the sampling is adequate [38].
A Likert scale is a rating scale used to measure opinions, attitudes, or behaviors, consisting of a question statement with a series of five or seven-answer statements [39]. During the factor analysis, we conducted a series of 5 rating scales, including a percentage value for factors influencing the decision to choose a travel mode. Respondents are required to choose from five levels of satisfaction, ranging from 1 = very unsatisfied to 5 = very satisfied. To validate the Likert scale, we employed EFA to examine the underlying factor structure and assess construct validity. The Kaiser-Meyer-Olkin (KMO) measure was used to evaluate sampling adequacy, considered greater than 0.70, indicating meritorious adequacy. Factor loadings were assessed, and items with loading values greater than 0.40 were retained. The resulting factor scores were then used as independent variables in the NLM to represent satisfaction-related attributes.
2.4 NLM
The NLM is an economic analysis tool that sequentially assesses the importance of choices [40]. The NLM was chosen over simpler discrete choice models, such as the Multinomial Logit (MNL), due to its ability to accommodate the hierarchical structure of mode choice decisions observed in the campus context. The model was estimated using NLOGIT version 4.0. Here, the model was used to efficiently describe the behavior of choosing travel modes and identify the most suitable variables for model development. The model accuracy was also tested and applied to generate case studies that subsequently analyzed the impact of different scenarios on traveler behavior. The model structure is represented by Eqs. (1) and (2) [41].
${{P}_{j|b}}={{P}_{\left( j\text{ }\!\!|\!\!\text{ }b,l \right)}}\times {{P}_{l}}$ (1)
${{P}_{(j|b,l)}}=\text{ }\!\!~\!\!\text{ }\frac{exp\left( \beta {{X}_{j|b,l}} \right)}{\mathop{\sum }_{q|b,l}\exp \left( \beta {{X}_{q|j,l}} \right)}$ (2)
where, $\left( j\text{ }\!\!|\!\!\text{ }b,l \right)$ represents the probability or likelihood that a traveler of type j will choose travel mode b (Tram, Bicycle, MC-taxi, MC-private, Car, or Walk), given the specific condition. l is the type of travel (Limb), b is the mode of travel within l, x is the independent variable of j, and q is the set of all travel mode options.
The probability equation for the decision to choose a mode of transportation (Limb, l) is given by the following equation:
${{P}_{l}}=\text{ }\!\!~\!\!\text{ }\frac{\text{exp}\left[ {{\gamma }_{l}}\left( {\delta }'{{z}_{l}}+{{I}_{l}} \right) \right]}{\mathop{\sum }_{s}\text{exp}\left[ {{\gamma }_{s}}\left( {\delta }'{{z}_{s}}+{{I}_{s}} \right) \right]}$ (3)
Behavioral decision-making and satisfaction [42] with travel mode choices can be leveraged to develop and enhance the efficiency of each transportation mode, as outlined in the utility theory [43]. The utility values were calculated as follows.
${{U}_{in}}={{V}_{in}}+{{\varepsilon }_{in}}$ (4)
where, $U_{in}~$represents the satisfaction (i.e., utility) of individual n towards option i, Vin is the component of satisfaction that is deterministically measurable (i.e., deterministic component), $\varepsilon _{in}~$is the component of uncertainty (i.e., random component). Furthermore, the utility function parameters were estimated using the maximum likelihood method [39].
3.1 Socio-economic and travel mode preferences
Table 2 provides an insightful overview of the demographic characteristics and transportation mode preferences among the surveyed participants at Mahidol University. The data showcases variations in mode choice across different groups categorized by gender, age, occupation, education level, income, and residence. The tram emerges as the most utilized mode across all groups, highlighting its role as the primary on-campus transportation option. Gender differences are evident in the choice of transport modes. Males slightly prefer trams and walking over other modes, accounting for 33.80% and 22.20% of their usage, respectively, while females exhibit a higher preference for trams (44.70%) and slightly less inclination towards walking (19.60%). Age-wise, younger individuals (< 22 years) show the highest preference for trams (40.20%) and walking (21.00%). Interestingly, older age groups (> 51 years) display a strong preference for trams (57.10%), with a declining interest in walking (14.30%) or other active modes, possibly due to convenience and physical constraints. Occupational roles significantly influence mode choice. Students, the majority group, predominantly use trams (41.70%) and walking (19.60%). Government officers favor walking (35.90%) and private cars (19.30%), reflecting their financial capability and need for flexibility.
Table 2. Sample characteristics and travel mode distribution in percentage (n = 923)
|
|
|
Mode of Transport |
|||||
|
Group |
Variable |
Tram (TM) |
Bicycle (BC) |
Motorcycle Taxis (MT) |
Private Motorcycle (PM) |
Private Car (PC) |
Walking (WK) |
|
Gender |
Male |
33.80 |
7.90 |
17.20 |
10.00 |
8.90 |
22.20 |
|
Female |
44.70 |
6.30 |
14.40 |
8.90 |
6.10 |
19.60 |
|
|
Age |
< 22 years |
40.20 |
7.20 |
15.20 |
8.80 |
7.60 |
21.00 |
|
22–31 years |
36.50 |
6.40 |
19.90 |
12.20 |
6.40 |
18.60 |
|
|
32–41 years |
38.90 |
5.60 |
11.10 |
5.60 |
16.70 |
22.10 |
|
|
42–51 years |
38.90 |
11.10 |
5.60 |
11.10 |
0.00 |
33.30 |
|
|
> 51 years |
57.10 |
0.00 |
14.30 |
14.30 |
0.00 |
14.30 |
|
|
Occupation |
Students |
41.70 |
6.90 |
15.10 |
9.70 |
7.00 |
19.60 |
|
Government officers |
16.00 |
7.90 |
16.60 |
4.30 |
19.30 |
35.90 |
|
|
Government employees |
0.00 |
11.70 |
49.00 |
12.80 |
0.00 |
26.50 |
|
|
Others |
9.40 |
9.50 |
20.20 |
5.20 |
5.10 |
50.50 |
|
|
Education level |
< Bachelor's degree |
28.80 |
13.70 |
10.30 |
5.50 |
6.80 |
34.90 |
|
Bachelor's degree |
41.70 |
6.40 |
17.30 |
9.10 |
7.80 |
17.70 |
|
|
Master's degree |
43.60 |
4.50 |
11.80 |
16.40 |
4.50 |
19.10 |
|
|
Doctor's degree |
39.40 |
0.00 |
24.20 |
9.10 |
6.10 |
21.20 |
|
|
Others |
25.00 |
0.00 |
12.50 |
12.50 |
25.00 |
25.00 |
|
|
Personal monthly income (THB) |
< 5,000 |
45.90 |
9.00 |
8.20 |
11.50 |
3.30 |
22.10 |
|
5,001–10,000 |
39.90 |
6.30 |
15.10 |
9.40 |
8.80 |
20.50 |
|
|
10,001–15,000 |
33.70 |
8.70 |
24.40 |
7.60 |
5.20 |
20.30 |
|
|
15,001–20,000 |
36.80 |
13.20 |
7.90 |
13.20 |
13.20 |
15.80 |
|
|
> 20,000 |
42.50 |
2.50 |
16.30 |
8.80 |
6.30 |
23.80 |
|
|
Household monthly income (THB) |
< 30,000 |
45.20 |
10.60 |
13.50 |
7.70 |
8.70 |
14.40 |
|
30,001–60,000 |
37.90 |
4.40 |
16.40 |
12.80 |
7.30 |
21.10 |
|
|
60,001–90,000 |
39.80 |
7.80 |
14.30 |
6.10 |
5.60 |
26.40 |
|
|
> 90,000 |
40.00 |
9.30 |
17.10 |
7.80 |
8.80 |
17.10 |
|
|
Resident |
Off-campus |
38.50 |
6.90 |
17.10 |
9.50 |
7.70 |
20.30 |
|
On-campus |
47.10 |
8.30 |
6.60 |
9.10 |
5.00 |
24.00 |
|
Meanwhile, government employees heavily rely on motorcycle taxis (49.00%), likely due to their efficiency. Educational attainment also plays a role, with individuals holding bachelor’s and master’s degrees favoring trams (41.70% and 43.60%, respectively). Doctorate holders show an inclination for diverse modes, with notable usage of trams (39.40%) and walking (21.20%). Personal and household incomes correlate with mode choice. Lower-income individuals (< 5,000 THB) predominantly use trams (45.90%) and walking (22.10%). As income levels rise, there is a gradual shift towards private modes like motorcycles and cars. Residents on campus show a higher preference for walking (24.00%) and trams (47.10%), emphasizing accessibility and convenience, while off-campus residents diversify across modes due to longer travel distances.
The variations in preferences across demographic groups underscore the need for tailored transportation policies. Enhancing the efficiency and accessibility of trams and improving infrastructure for walking can cater to the majority's preferences. Additionally, targeted strategies to encourage active travel among specific groups, such as students and lower-income residents, can promote sustainability and health benefits.
3.2 EFA
The EFA detailed in Table 3 identifies and categorizes variables influencing travel mode satisfaction into three latent constructs: comfort, built environment, and flexibility. These factors offer a nuanced understanding of the elements shaping travel behavior and their implications for transportation policy in a campus setting. Firstly, the comfort factor encapsulates variables that prioritize travelers’ physical ease and environmental adaptability. This includes preferences for travel modes during hot or rainy weather, ensuring a comfortable experience by avoiding fatigue or discomfort, and the suitability of attire for the mode of transport. The high loading values for these variables (e.g., 0.846 for hot weather and 0.828 for rainy weather preferences) underscore the importance of environmental conditions and physical well-being in influencing satisfaction. This indicates that campus transport policies should integrate weather-adaptive measures such as shaded walkways or climate-controlled transit options to enhance user comfort.
Table 3. Exploratory factor analysis on travel mode satisfaction
|
Component |
Variable |
Description |
Loading |
|
Comfort |
Q5 |
Preference for travel modes on days with hot weather. |
0.846 |
|
Q7 |
Preference for travel modes on days with rainfall. |
0.828 |
|
|
Q11 |
Ensuring a comfortable travel experience (e.g., avoiding heat, fatigue, or discomfort). |
0.777 |
|
|
Q8 |
Suitability of travel attire for the chosen mode of transportation. |
0.555 |
|
|
Built Environment |
Q1 |
Perception of safety related to traveling lanes or infrastructure. |
0.638 |
|
Q4 |
Coverage of service areas, ensuring comprehensive access. |
0.583 |
|
|
Q9 |
Interest in combining travel with physical activity to promote health. |
0.617 |
|
|
Q10 |
Preference for travel modes that provide relaxation opportunities. |
0.666 |
|
|
Q12 |
Feeling of personal safety during travel. |
0.623 |
|
|
Q6 |
Preference for travel modes on days with cool and comfortable weather. |
0.426 |
|
|
Flexibility |
Q2 |
Ability to travel quickly and reach the destination efficiently. |
0.591 |
|
Q3 |
Freedom to choose travel times according to individual schedules or preferences. |
0.846 |
Secondly, the built environment factor reflects the infrastructure and environmental attributes impacting travel satisfaction. Variables such as the safety of traveling lanes, coverage of service areas, integration of physical activity, and personal safety perceptions exhibit moderate to high loadings (e.g., 0.638 for safety and 0.666 for relaxation opportunities). This highlights the critical role of infrastructural quality and comprehensive service provision in facilitating active travel. Investments in secure and accessible pathways, combined with health-promoting features like well-designed walkways, could increase the appeal of non-motorized travel modes.
Lastly, the flexibility factor emphasizes the adaptability of travel modes to individual schedules and efficiency in reaching destinations. With the highest loading value of 0.846 for the freedom to choose travel times, this factor highlights the demand for user-centric and time-efficient transport systems. Flexible scheduling and on-demand services, such as dynamic tram routes or app-based bike rentals, could cater to this preference, promoting higher satisfaction and usage rates.
These latent constructs were validated by a KMO statistic of 0.783 which greater than 0.70 threshold and significant Bartlett’s test results (χ² = 20,004.34, p < 0.000), indicating robust sampling adequacy. By integrating these factors into the NLM, the study effectively aligns travel mode choice predictions with behavioral realities, ensuring accurate and actionable insights.
3.3 Descriptive analysis on satisfaction levels
Table 4 provides a detailed analysis of satisfaction levels for six transportation modes trams, bicycles, motorcycle taxis, private motorcycles, private cars, and walking on the Mahidol University campus. Satisfaction was assessed using a Likert scale, focusing on factors such as comfort, efficiency, adaptability to weather, and safety. The satisfaction data regarding mode choice preferences studied in this research is qualitative in nature, as it originates from the subjective feelings of each individual. Consequently, measurement criteria must be established to categorize satisfaction scores for subsequent analysis. These criteria are delineated as follows: (4.21-5.00) represents the highest level of satisfaction towards mode choice, (3.41-4.20) indicates high satisfaction, (2.61-3.40) denotes moderate satisfaction, (1.81-2.60) signifies low satisfaction, and (1.00-1.80) indicates very low satisfaction. Trams and walking emerged as the highest-rated modes, indicating a strong preference for environmentally friendly and physically engaging transportation. Conversely, bicycles and motorcycle taxis scored lower, particularly under unfavorable weather conditions, reflecting the challenges of infrastructure and user convenience.
Table 4. The perception of travel mode satisfaction levels
|
|
Travel Mode |
|
|
|
|
|||||
|
Variable |
TM |
BC |
MT |
PM |
PC |
WK |
Trend |
Average |
Min-Max |
Overall Satisfaction Level |
|
Q1 |
4.52 |
3.81 |
3.00 |
3.55 |
4.41 |
4.08 |
3.90 |
1-5 |
High |
|
|
Q2 |
3.30 |
3.61 |
4.48 |
4.55 |
4.17 |
2.40 |
3.75 |
1-5 |
High |
|
|
Q3 |
3.16 |
4.11 |
4.29 |
4.64 |
4.57 |
4.31 |
4.18 |
1-5 |
High |
|
|
Q4 |
4.01 |
3.38 |
2.52 |
3.48 |
3.71 |
4.14 |
3.54 |
1-5 |
High |
|
|
Q5 |
3.77 |
2.56 |
3.16 |
3.39 |
4.66 |
2.23 |
3.30 |
1-5 |
Moderate |
|
|
Q6 |
4.52 |
4.52 |
4.19 |
4.40 |
4.54 |
4.58 |
4.46 |
1-5 |
Highest |
|
|
Q7 |
3.32 |
1.71 |
1.76 |
2.05 |
4.56 |
1.78 |
2.53 |
1-5 |
Low |
|
|
Q8 |
4.18 |
3.16 |
3.22 |
3.43 |
4.65 |
4.24 |
3.81 |
1-5 |
High |
|
|
Q9 |
2.67 |
4.15 |
2.26 |
2.40 |
2.48 |
4.61 |
3.10 |
1-5 |
Moderate |
|
|
Q10 |
4.18 |
4.27 |
2.52 |
3.48 |
3.71 |
4.14 |
3.72 |
1-5 |
High |
|
|
Q11 |
3.89 |
2.99 |
3.41 |
3.63 |
4.67 |
2.71 |
3.55 |
1-5 |
High |
|
|
Q12 |
4.40 |
4.27 |
2.85 |
3.48 |
4.52 |
3.99 |
3.92 |
1-5 |
High |
|
Trams achieved the highest satisfaction levels due to safety measures, enjoyable travel experiences during cool weather, and comprehensive service coverage, with an average score of 4.52. Walking followed closely, driven by high scores in physical activity benefits (4.61) and overall travel comfort (4.14). However, both modes faced lower satisfaction during rainy or hot conditions, highlighting areas for infrastructure improvement. On the other hand, bicycles recorded their lowest satisfaction during rainy weather (1.71), primarily due to exposure and inadequate shelter facilities. Motorcycle taxis were appreciated for their speed and efficiency, but scored lower in adaptability and comfort. Private motorcycles and cars showed moderate satisfaction, balancing cost, flexibility, and convenience. The findings emphasize a strong preference for modes that integrate comfort, safety, and environmental adaptability, particularly under favorable weather. Satisfaction levels for active modes such as walking and bicycles can be improved by addressing infrastructure gaps, such as providing covered pathways and bike shelters. Similarly, trams could enhance user satisfaction by optimizing service coverage and reducing waiting times. The analysis demonstrates that tailored improvements to infrastructure and service design can drive higher satisfaction and adoption of sustainable travel modes, fostering healthier, more efficient, and environmentally friendly commuting behaviors within campus environments. These insights are essential for developing targeted transportation policies.
3.4 NLM
From survey data collected through questionnaires comprising 923 samples who have experienced using all six travel patterns (trams, bicycles, motorcycle taxis, private motorcycle, private car, and walking), the data was divided into two sets in a 70:30 ratio. A set of 650 samples was used for model development, and another set of 273 samples was used for model validation. While the correlation coefficient was used to analyze variable relationships and indicate the degree of correlation between variables, less than 0.80 which indicated non-significant relationship between variables. Subsequently, the backward stepwise method was performed to eliminate independent variables with non-conforming correlation coefficients and significance levels greater than 0.05. Variables that failed to meet these thresholds were iteratively removed using the backward stepwise process to retain a parsimonious yet theoretically sound model. This procedure ensured model stability and interpretability while avoiding overfitting.
Based on Table 5 in the manuscript, the findings from the NLM provide critical insights into factors influencing travel mode choices among students and staff on the Mahidol University campus. Travel time emerged as a significant variable across all modes, showing a negative correlation with the likelihood of selection. This result underscores the sensitivity of campus travelers to the time cost associated with each mode, particularly for modes requiring additional time for waiting or transitioning from parking to the final destination, such as private motorcycles and cars. The model highlights the positive impact of travel flexibility (β = 1.220, p < 0.001), indicating that the ability to adjust travel schedules significantly enhances satisfaction and likelihood of selection. This finding suggests that user-centric scheduling options or on-demand services could improve the appeal of various modes, especially for trams and bicycles. Interestingly, while distance had a positive influence (β = 6.190, p < 0.001), travel costs negatively impacted mode choice (β = -0.420, p < 0.001). These results imply that while longer distances increase the necessity for efficient travel modes like trams or private vehicles, the economic burden of travel remains a barrier, especially for cost-sensitive populations like students.
Table 5. NLM and assessment results
|
Variable |
Description |
Beta |
t-Statistic |
p-Value |
|
|
${{T}_{TM}}$ |
Travel time of trams |
-0.596 |
-5.401 |
< 0.001 |
|
|
${{T}_{BC}}$ |
Travel time of bicycle |
-0.516 |
-4.205 |
< 0.001 |
|
|
${{T}_{MT}}$ |
Travel time of motorcycle taxis |
-1.226 |
-6.645 |
< 0.001 |
|
|
${{T}_{PM}}$ |
Travel time of private motorcycle |
-0.672 |
-4.584 |
< 0.001 |
|
|
${{T}_{PC}}$ |
Travel time of personal car |
-1.214 |
-4.121 |
< 0.001 |
|
|
${{T}_{WK}}$ |
Travel time of walking |
-0.547 |
-5.702 |
< 0.001 |
|
|
$T{{W}_{TM}}$ |
Time spent waiting for trams |
-0.692 |
-5.601 |
< 0.001 |
|
|
$T{{P}_{TM}}$ |
Time from parking to destination of trams |
-1.046 |
-4.082 |
< 0.001 |
|
|
$T{{P}_{PM}}$ |
Time from parking to destination of private motorcycle |
-7.582 |
-6.657 |
< 0.001 |
|
|
$T{{P}_{PC}}$ |
Time from parking to destination of private car |
-4.847 |
-3.756 |
< 0.001 |
|
|
DIST |
Distance in kilometers |
6.190 |
4.323 |
< 0.001 |
|
|
COST |
Travel cost in Baht (THB) |
-0.420 |
-3.109 |
< 0.001 |
|
|
FLEX |
Flexibility |
1.220 |
5.699 |
< 0.001 |
|
|
Mode-Specific Constants and Model Goodness-of-Fit Statistics |
Value |
||||
|
Travel Mode |
Trams |
|
|
|
3.814 |
|
Bicycles |
|
|
|
-7.042 |
|
|
Motorcycle taxis |
|
|
|
1.737 |
|
|
Private motorcycles |
|
|
|
1.433 |
|
|
Private cars |
|
|
|
5.701 |
|
|
Walking |
|
|
|
Reference |
|
|
Goodness-of-fit |
Log-likelihood |
|
|
|
-1,226.177 |
|
Log-likelihood at convergence |
|
|
|
-236.453 |
|
|
McFadden's Pseudo R-squared |
|
|
|
0.807 |
|
|
Chi-squared |
|
|
|
1,979.450 |
|
|
% Correct |
|
|
|
83.19 |
|
The beta coefficients for active modes such as walking reflect moderate satisfaction levels under favorable conditions but indicate lower adoption rates during adverse weather. Despite Thailand's hot climate, the analysis revealed that weather conditions were not a statistically significant determinant, suggesting that infrastructure improvements like shaded paths or climate-adapted vehicles could mitigate discomfort and promote active travel. NLM results revealed that travel time was consistently and significantly negatively associated with the probability of choosing all transport modes, with the strongest negative effect observed for motorcycle taxis (β = -1.226, p < 0.001) and private cars (β = -1.214, p < 0.001). These results suggest that campus users are highly sensitive to time-related inconveniences, including delays in accessing or completing a trip.
Overall, the model’s robust performance, demonstrated by a McFadden's Pseudo R-squared of 0.807 and a high prediction accuracy (83.19%), validates its application in forecasting and policy development. This study emphasizes the importance of tailoring transport strategies to address time, cost, and flexibility, thereby fostering an efficient, sustainable, and user-focused campus transportation system. Negative coefficients indicate that an increase in the variable decreases satisfaction with choosing that travel pattern, whereas positive coefficients indicate an increase in the variable increase’s satisfaction. In the NLM, it was found that it does not exhibit independence or high correlation within nests at a 99% confidence level. This showed that the factors influencing mode choice on campus in Thailand are different from those for home-to-school or work travel in another study [6-9]. Like gender, it’s not a significant factor [12, 13]. Interestingly, despite Thailand’s sweltering weather, the results revealed that weather is not a significant factor [6]. This study has identified several crucial factors that influence travel mode choice. These factors include travel time, waiting time, travel time from parking to destination, distance, cost, and flexibility of travel time.
3.5 Model development and validation results
Table 6 showcases the predictive accuracy of the NLM applied to the six transportation modes within the Mahidol University campus: trams, bicycles, motorcycle taxis, private motorcycles, private cars, and walking. The table delineates the results for model development (70% of the dataset) and validation (30% of the dataset), demonstrating the model's robust predictive capability.
Table 6. Prediction results for the development and validation set
|
Travel Mode |
TM |
BC |
MT |
PM |
PC |
WK |
% Correct |
|
|
Model development set (n = 650, 70%) |
||||||
|
Trams (TM) |
233 |
3 |
0 |
1 |
2 |
19 |
90.31 |
|
Bicycles (BC) |
0 |
37 |
1 |
0 |
0 |
8 |
80.43 |
|
Motorcycle taxis (MT) |
0 |
6 |
62 |
2 |
2 |
26 |
63.27 |
|
Private motorcycles (PM) |
1 |
6 |
0 |
47 |
1 |
6 |
77.05 |
|
Private cars (PC) |
0 |
1 |
0 |
1 |
43 |
7 |
82.69 |
|
Walking (WK) |
2 |
8 |
4 |
1 |
1 |
119 |
88.15 |
|
Total % Correct |
|
|
|
|
|
|
83.23 |
|
|
Model validation set (n = 273, 30%) |
||||||
|
Trams (TM) |
93 |
3 |
0 |
1 |
2 |
9 |
86.11 |
|
Bicycles (BC) |
0 |
16 |
0 |
1 |
0 |
2 |
84.21 |
|
Motorcycle taxis (MT) |
1 |
1 |
25 |
2 |
0 |
12 |
60.98 |
|
Private motorcycles (PM) |
2 |
0 |
0 |
21 |
1 |
2 |
80.77 |
|
Private cars (PC) |
0 |
0 |
0 |
0 |
18 |
4 |
81.81 |
|
Walking (WK) |
0 |
0 |
0 |
2 |
1 |
54 |
94.74 |
|
Total % Correct |
|
|
|
|
|
|
83.15 |
For the development dataset, the model achieved an overall accuracy of 83.23%, with individual mode accuracies ranging from 63.27% for motorcycle taxis to an impressive 90.31% for trams. Similarly, the validation set exhibited a comparable overall accuracy of 83.15%, underscoring the model's reliability. Notably, walking showed the highest validation accuracy (94.74%), reflecting the simplicity and predictability of this mode. Conversely, motorcycle taxis had the lowest accuracy (60.98%), possibly due to the variability in traveler preferences and external factors such as availability and speed. While the NLM demonstrated high predictive accuracy (83.19%), we recognize the importance of assessing potential overfitting to ensure the model's generalizability. The model exhibited comparable accuracy across both subsets 83.23% for the development set and 83.15% for the validation set, indicating that the model performs consistently and is not overfitted to the training data. Furthermore, to minimize overfitting risk, a backward stepwise selection process was employed to exclude variables with weak explanatory power or high multicollinearity. Correlation checks confirmed that no pair of independent variables exceeded a coefficient of 0.80, preserving model parsimony and stability. Nonetheless, we acknowledge that the model is developed based on data from a single campus context, and its external validity may be limited. Future studies are encouraged to replicate the model in different institutional or geographic settings to confirm its generalizability.
The model's high performance is attributed to its consideration of key determinants like travel time, cost, distance, and flexibility, which were meticulously integrated into the predictive framework. Trams, the most popular mode, exhibited consistent prediction accuracy across both datasets, reinforcing their dominance as the primary on-campus transportation option. In contrast, the moderate accuracy for bicycles and motorcycle taxis highlights the need for further exploration of latent variables, such as user perception and infrastructure quality. This analysis underscores the NLM's applicability for developing targeted transportation policies. The insights derived from Table 6 provide a foundation for strategic interventions, such as enhancing tram services and addressing the factors limiting the adoption of other modes. By integrating these findings, policymakers can create a more sustainable and efficient campus mobility system.
3.6 The application of the model
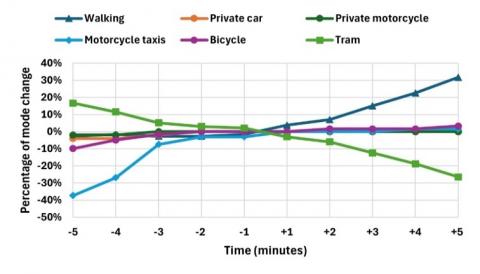
Table 7 provides a comprehensive examination of the elasticity of travel mode choices in response to variations in tram waiting times. The findings reveal pivotal insights into the interplay between service alterations and traveler behavior. For example, a 5-minute increase in tram waiting time results in a 26.5% reduction in tram ridership and a corresponding 31.72% increase in walking. These results demonstrate that waiting time may have an even stronger behavioral impact than in-vehicle travel time, particularly in a campus setting where trips are short and travelers are highly time-sensitive. This highlights a strong latent preference for alternatives that align with health benefits and cost efficiency, particularly among the university population.
The elasticity results underscore the importance of tram reliability as a determinant of travel mode preference. While tram improvements bolster commuter satisfaction, extended wait times lead to a substantial decline in ridership, simultaneously promoting environmentally sustainable options such as walking and cycling. Interestingly, motorized individual transport modes (e.g., private motorcycles and cars) demonstrate negligible elasticity, suggesting their users prioritize convenience over temporal factors.
Table 7. Mode choice elasticity
|
Time (Mins) |
Travel Mode (%) |
|||||
|
WK |
PC |
PM |
MT |
BC |
TM |
|
|
-5 |
-2.69 |
-4.00 |
-1.92 |
-37.31 |
-9.84 |
16.67 |
|
-4 |
-1.61 |
-4.00 |
-1.92 |
-26.87 |
-4.92 |
11.54 |
|
-3 |
-2.69 |
-2.00 |
0.00 |
-7.46 |
-1.64 |
5.13 |
|
-2 |
-2.69 |
0.00 |
0.00 |
-2.99 |
0.00 |
2.99 |
|
-1 |
-1.61 |
0.00 |
0.00 |
-2.99 |
0.00 |
2.14 |
|
+1 |
3.76 |
0.00 |
0.00 |
0.00 |
0.00 |
-2.99 |
|
+2 |
6.99 |
0.00 |
0.00 |
0.00 |
1.64 |
-5.98 |
|
+3 |
15.05 |
0.00 |
0.00 |
0.00 |
1.64 |
-12.39 |
|
+4 |
22.58 |
0.00 |
0.00 |
1.49 |
1.64 |
-18.80 |
|
+5 |
31.72 |
0.00 |
0.00 |
1.49 |
3.28 |
-26.50 |
Illustration of mode choice elasticity presents in Figure 3. These findings advocate for strategic transportation policies prioritizing tram reliability, with potential integration of real-time service updates and optimized scheduling to mitigate waiting periods. Furthermore, the elasticity of active travel modes suggests that incremental service delays could unintentionally encourage greener travel practices. Policymakers can leverage this dynamic to foster a balanced modal distribution, reducing the environmental footprint and enhancing campus accessibility. Overall, the nuanced understanding derived from elasticity metrics provides a robust foundation for informed decision-making in campus transportation planning.
Figure 3. Illustration of the proportion of choosing the mode of travel within Mahidol University Salaya campus, when the waiting time of the tram is increased or decreased
This study explored the factors influencing travel mode choices on a university campus, utilizing the NLM to provide a nuanced understanding of students' and staff preferences. The findings offer significant insights into the interplay between convenience, environmental adaptability, and user satisfaction in shaping travel behavior. The results revealed that trams and walking are the most preferred modes of transportation, reflecting a strong inclination toward sustainable and health-promoting options. Trams stood out for their safety, efficiency, and user-friendly attributes, whereas walking was favored for its contribution to physical activity and accessibility, particularly among on-campus residents. These findings underscore the pivotal role of infrastructural quality and service coverage in fostering positive attitudes toward active and shared modes of transport. Interestingly, travel time emerged as a critical determinant, with its negative association across all modes highlighting the sensitivity of campus travelers to delays and inefficiencies. This is particularly evident in the preference for trams, where punctuality and reduced waiting times are paramount. Conversely, the moderate preference for bicycles and motorcycle taxis, especially under unfavorable weather conditions, underscores the need for targeted infrastructure improvements, such as covered pathways and enhanced shelter facilities.
The model also identified cost and flexibility as influential factors. The negative impact of travel costs highlights economic considerations as barriers to adopting certain modes, particularly among cost-sensitive populations like students. Meanwhile, the significant positive effect of flexibility suggests that user-centric scheduling, such as dynamic tram routes or app-based bike-sharing services, could enhance mode attractiveness. A novel aspect of this research is its exploration of latent variables such as comfort and adaptability. The high satisfaction levels associated with active modes under favorable weather conditions indicate the potential for promoting these options through strategic enhancements to the built environment. Interestingly, unlike many previous studies that identified weather conditions as a significant determinant of mode choice particularly for active travel modes such as walking and cycling [44], our findings revealed that weather-related variables were not statistically significant predictors in the NLM. This deviation may be attributed to several contextual factors specific to the Mahidol University campus
Features like shaded walkways, climate-controlled transit options, and well-maintained infrastructure could mitigate weather-related discomfort and elevate user satisfaction. This observation aligns with studies suggesting that high-quality infrastructure can buffer the impact of weather on travel decisions [45]. Additionally, this study provides valuable insights into travel mode preferences and their influencing factors, contributing to sustainable urban transport planning and policy development. Discussion on several aspects consideration as follows.
Firstly, sustainability and active travel promotion: the high preference for trams and walking reflects a growing awareness of sustainability and health benefits. However, weather conditions and infrastructure gaps, such as limited shaded pathways and inadequate shelters, pose challenges to active travel adoption. These findings stress the importance of integrating environmental adaptability into campus transportation planning.
Secondly, economic sensitivity and flexibility: travel costs significantly influence mode choice, especially for students and low-income populations. Flexible travel schedules, enabled by app-based platforms or dynamic transport services, can bridge this gap by offering economic and convenient solutions tailored to user needs.
Lastly, behavioral insights for policy integration: The NLM results highlight the importance of travel time and flexibility. Incorporating behavioral data into transportation models ensures policies are aligned with user expectations, improving satisfaction and adoption rates for sustainable modes.
To enhance sustainable urban transport, several policy and planning suggestions are proposed. In this context, investing in shaded walkways is not merely a comfort-enhancing feature, but a resilience-oriented intervention that mitigates the disutility of longer tram wait times. By improving the walking experience under tropical weather conditions, shaded infrastructure enhances user satisfaction and supports a shift toward low-carbon, health-promoting modes particularly in situations where transit delays are unavoidable. This alignment of infrastructure planning with observed behavioral elasticity strengthens the adaptive capacity of campus mobility systems and ensures that active travel remains a viable and attractive alternative. The findings show that flexibility was a significant and positively associated factor (β = 1.220, p < 0.001), suggesting that users value travel options that accommodate variable schedules and provide time autonomy. To translate this into policy, we have included recommendations for implementing app-based mobility solutions that allow users to book or track campus transport in real time. Optimizing tram schedules, reducing waiting times, and expanding service coverage, complemented by real-time information systems, can significantly improve public transport reliability and user satisfaction.
Economic incentives, such as subsidies or discounted travel passes for students and low-income staff, can further encourage the adoption of sustainable transport options. Additionally, integrated mobility solutions, including app-based platforms offering dynamic scheduling and real-time updates, can cater to diverse user needs and increase convenience. Behavioral campaigns that highlight the environmental and health benefits of active travel, in collaboration with local governments and institutions, can foster a culture of sustainability. Finally, designing inclusive transport systems that address the needs of individuals with mobility challenges will ensure universal accessibility and equity in campus mobility solutions. These combined measures can create a more sustainable, user-friendly, and inclusive urban transportation framework.
This study applied an NLM to analyze the determinants of travel mode choice behavior among students and staff at Mahidol University, Thailand. By integrating exploratory factor analysis and discrete choice modeling, the study identified key variables influencing mode selection, including travel time, cost, distance, and schedule flexibility. Among these, travel time exhibited a consistently negative association with mode choice, while flexibility was a strong positive predictor, highlighting the importance of time autonomy in shaping user preferences. Trams and walking emerged as the most preferred modes, reflecting a latent preference for safe, convenient, and health-promoting alternatives. The findings contribute theoretically by demonstrating the value of combining behavioral constructs (comfort, flexibility, and built environment) with quantitative modeling to understand context-specific mobility choices. Practically, the results inform campus transport planning by quantifying the elasticity of mode choice in response to changes in travel time and service conditions. For instance, reducing tram wait times significantly increases usage, while longer delays encourage shifts toward active travel, underscoring the behavioral sensitivity to time-based attributes.
However, the study is not without limitations. We have expanded the limitations section to explicitly acknowledge that the analysis is confined to a single university (Mahidol University), which, while offering a complex and policy-relevant campus mobility setting, may limit the generalizability of findings to other institutional contexts with different geographic, climatic, or infrastructural profiles. Moreover, unobserved cultural or organizational factors may also influence travel behavior in ways that are not fully captured in this study. To enhance external validity, future research is encouraged to conduct multi-campus comparative analyses or adopt longitudinal designs that can track behavioral adaptations over time, particularly in response to policy or infrastructural interventions.
Future research should explore longitudinal designs to assess how mode choice behavior evolves in response to infrastructure or policy changes. Moreover, extending the analysis to incorporate emerging mobility options such as electric scooters, autonomous shuttles, or app-based microtransit could offer deeper insights into the evolving preferences of campus travelers. Cross-campus comparative studies would also enhance external validity and support evidence-based planning for sustainable university mobility systems.
This work was partially supported by King Mongkut’s University of Technology North Bangkok.
[1] Adamos, G., Nathanail, E., Theodoridou, P., Tsolaki, T. (2020). Investigating the effects of active travel in health and quality of life. Transport and Telecommunication, 21(3): 221-230. https://doi.org/10.2478/ttj-2020-0018
[2] van Wee, B., Kroesen, M. (2022). Attitude changes, modelling travel behaviour, and ex ante project evaluations. Transportation Research Interdisciplinary Perspectives, 16: 100724. https://doi.org/10.1016/j.trip.2022.100724
[3] Chapman, R., Keall, M., Howden-Chapman, P., Grams, M., Witten, K., Randal, E., Woodward, A. (2018). A cost benefit analysis of an active travel intervention with health and carbon emission reduction benefits. International Journal of Environmental Research and Public Health, 15(5): 962. https://doi.org/10.3390/ijerph15050962
[4] Saunders, L.E., Green, J.M., Petticrew, M.P., Steinbach, R., Roberts, H. (2013). What are the health benefits of active travel? A systematic review of trials and cohort studies. PloS One, 8(8): e69912. https://doi.org/10.1371/journal.pone.0069912
[5] Sahlqvist, S., Song, Y., Ogilvie, D. (2012). Is active travel associated with greater physical activity? The contribution of commuting and non-commuting active travel to total physical activity in adults. Preventive Medicine, 55(3): 206-211. https://doi.org/10.1016/j.ypmed.2012.06.028.
[6] Spinney, J.E., Maoh, H., Millward, H. (2019). Factors affecting mode choice for the home-elementary school journey: Evidence from Halifax, Canada. The Canadian Geographer/Le Géographe Canadien, 63(2): 254-266. https://doi.org/10.1111/cag.12494
[7] Bai, Y., Cao, M., Wang, R., Liu, Y., Wang, S. (2022). How street greenery facilitates active travel for university students. Journal of Transport & Health, 26: 101393. https://doi.org/10.1016/j.jth.2022.101393
[8] Cheng, L., Chen, X., Yang, S., Cao, Z., De Vos, J., Witlox, F. (2019). Active travel for active ageing in China: The role of built environment. Journal of Transport Geography, 76: 142-152. https://doi.org/10.1016/j.jtrangeo.2019.03.010
[9] Christiansen, P., Engebretsen, Ø., Fearnley N., Usterud Hanssen, J. (2017). Parking facilities and the built environment: Impacts on travel behaviour. Transportation Research Part A: Policy and Practice, 95: 198-206. https://doi.org/10.1016/j.tra.2016.10.025
[10] Pangderm, C., Arreeras, T., Jia, X.Y. (2025). Modeling school commuting mode choice under normal and adverse weather conditions in Chiang Rai City. Future Transportation, 5(3): 101. https://doi.org/10.3390/futuretransp5030101
[11] Wöhner, F. (2023). Work flexibly, travel more healthily? How telework and flextime affect active travel in Switzerland. Transportation Research Part A: Policy and Practice, 174: 103748. https://doi.org/10.1016/j.tra.2023.103748
[12] Hamad, K., Htun, P.T.T., Obaid, L. (2021). Characterization of travel behavior at a university campus: A case study of Sharjah University City, UAE. Transportation Research Interdisciplinary Perspectives, 12: 100488. https://doi.org/10.1016/j.trip.2021.100488
[13] Goel, R., Oyebode, O., Foley, L., Tatah, L., Millett, C., Woodcock, J. (2023). Gender differences in active travel in major cities across the world. Transportation, 50(2): 733-749. https://doi.org/10.1007/s11116-021-10259-4
[14] Zhang, Y., Li, L. (2022). Research on travelers’ transportation mode choice between carsharing and private cars based on the logit dynamic evolutionary game model. Economics of Transportation, 29: 100246. https://doi.org/10.1016/j.ecotra.2021.100246
[15] Debrezion, G., Pels, E., Rietveld, P. (2009). Modelling the joint access mode and railway station choice. Transportation Research Part E: Logistics and Transportation Review, 45(1): 270-283. https://doi.org/10.1016/j.tre.2008.07.001
[16] Arreeras, T., Chongutsah, S., Asada, T., Arimura, M. (2020). Factors affecting mode choice in accessing railway station study in Nakhon Ratchasima. Transportation Research Procedia, 48: 3457-3468. https://doi.org/10.1016/j.trpro.2020.08.107
[17] Bei, H., Chen, H., Li, L., Gao, X., Xia, Y., Sun, Y. (2023). Joint prediction of travel mode choice and purpose from travel surveys: A multitask deep learning approach. Travel Behaviour and Society, 33: 100625. https://doi.org/10.1016/j.tbs.2023.100625
[18] Zhu, S., Cai, Y., Wang, M., Wang, H., Meng, Q. (2023). How will China-Singapore international land-sea trade corridor affect route choice behaviour? A discrete choice model. Transport Policy, 144: 11-22. https://doi.org/10.1016/j.tranpol.2023.09.014
[19] Kazagli, E., de Lapparent, M. (2023). A discrete choice modeling framework of heterogenous decision rules accounting for non-trading behavior. Journal of Choice Modelling, 48: 100413. https://doi.org/10.1016/j.jocm.2023.100413
[20] Bhattacharya, D., Dupas, P., Kanaya, S. (2024). Demand and welfare analysis in discrete choice models with social interactions. Review of Economic Studies, 91(2): 748-784. https://doi.org/10.1093/restud/rdad053
[21] Beeramoole, P.B., Kelly, R., Haque, M.M., Pinz, A., Paz, A. (2024). Estimation of discrete choice models considering simultaneously multiple objectives and complex data characteristics. Transportation Research Part C: Emerging Technologies, 160: 104517. https://doi.org/10.1016/j.trc.2024.104517
[22] Zhu, W., Si, W. (2024). Predicting choices of street-view images: A comparison between discrete choice models and machine learning models. Journal of Choice Modelling, 50: 100470. https://doi.org/10.1016/j.jocm.2024.100470
[23] Kim, J., Lee, B. (2023). Campus commute mode choice in a college town: An application of the integrated choice and latent variable (ICLV) model. Travel Behaviour and Society, 30: 249-261. https://doi.org/10.1016/j.tbs.2022.10.002
[24] Hesjevoll, I.S., Fyhri, A., Ciccone, A. (2021). App-based automatic collection of travel behaviour: A field study comparison with self-reported behaviour. Transportation Research Interdisciplinary Perspectives, 12: 100501. https://doi.org/10.1016/j.trip.2021.100501
[25] Yang, L., Zheng, G., Zhu, X. (2013). Cross-nested logit model for the joint choice of residential location, travel mode, and departure time. Habitat International, 38: 157-166. https://doi.org/10.1016/j.habitatint.2012.06.002
[26] Li, X., Rashidi, T.H., Koo, T.T. (2023). Tourists’ travel mode and length of stay: Application of a fully nested Archimedean copula structure. Transportation Research Part A: Policy and Practice, 172: 103678. https://doi.org/10.1016/j.tra.2023.103678
[27] Lai, X., Bierlaire, M. (2015). Specification of the cross-nested logit model with sampling of alternatives for route choice models. Transportation Research Part B: Methodological, 80: 220-234. https://doi.org/10.1016/j.trb.2015.07.005
[28] Sami, M., Eldomiaty, T.I. (2020). Modeling dynamic location expansion of multinational firms in France. Empirical Economics, 59(6): 3033-3061. https://doi.org/10.1007/s00181-019-01747-9
[29] Feilzer, J.W., Stroosnier, D., Dugundji, E., Koch, T. (2021). Predicting lessee switch behavior using logit models. Procedia Computer Science, 184: 380-387. https://doi.org/10.1016/j.procs.2021.03.048
[30] Hamadneh, J., Jaber, A. (2023). Modeling of intra-city transport choice behaviour in Budapest, Hungary. Journal of Urban Mobility, 3. https://doi.org/10.1016/j.urbmob.2023.100049
[31] Rankavat, S., Gurram, A.R., Pawar, D.S., Kushwaha, V. (2023). Study of COVID-19 impact on users' perception for transport modes choice in India. Iatss Research, 47(1): 73-83. https://doi.org/10.1016/j.iatssr.2023.01.005
[32] Chansuk, C., Arreeras, T., Chiangboon, C., Phonmakham, K., Chotikool, N., Buddee, R., Pumjampa, S., Yanasoi, T., Arreeras, S. (2022). Using factor analyses to understand the post-pandemic travel behavior in domestic tourism through a questionnaire survey. Transportation Research Interdisciplinary Perspectives, 16: 100691. https://doi.org/10.1016/j.trip.2022.100691
[33] Liu, D., Du, H., Southworth, F., Ma, S. (2017). The influence of social-psychological factors on the intention to choose low-carbon travel modes in Tianjin, China. Transportation Research Part A: Policy and Practice, 105: 42-53. https://doi.org/10.1016/j.tra.2017.08.004
[34] Rahman, M.S. (2008). Future mass rapid transit in Dhaka city: Options, issues and realities. Jahangirnagar Planning Review, 6: 69-81.
[35] Mahidol University. Location and Map, Mahidol University, Salaya-Nakhon Pathom Campus. https://science.mahidol.ac.th/th/mapsalaya.php, accessed on Jan. 26, 2025.
[36] Scott, D.M., Ciuro, C. (2019). What factors influence bike share ridership? An investigation of Hamilton, Ontario’s bike share hubs. Travel Behaviour and Society, 16: 50-58. https://doi.org/10.1016/j.tbs.2019.04.003
[37] Guadagnoli, E., Velicer, W.F. (1988). Relation of sample size to the stability of component patterns. Psychological Bulletin, 103(2): 265-275. https://doi.org/10.1037/0033-2909.103.2.265
[38] Kaiser, H.F. (1974). An index of factorial simplicity. Psychometrika, 39(1): 31-36. https://doi.org/10.1007/BF02291575
[39] Likert, R. (1932). A technique for the measurement of attitudes. Archives of Psychology, 22(140): 55.
[40] Williams, H.C. (1977). On the formation of travel demand models and economic evaluation measures of user benefit. Environment and Planning A, 9(3): 285-344. https://doi.org/10.1068/a090285
[41] McFadden, D. (1977). Modelling the choice of residential location. Cowles Foundation Discussion Papers No. 477.
[42] Zenelabden, N., Dikgang, J. (2022). Satisfaction with water services delivery in South Africa: The effects of social comparison. World Development, 157: 105861. https://doi.org/10.1016/j.worlddev.2022.105861
[43] Bhat, C.R. (1995). A heteroscedastic extreme value model of intercity travel mode choice. Transportation Research Part B: Methodological, 29(6): 471-483. https://doi.org/10.1016/0191-2615(95)00015-6
[44] Saneinejad, S., Roorda, M.J., Kennedy, C. (2012). Modelling the impact of weather conditions on active transportation travel behaviour. Transportation Research Part D: Transport and Environment, 17(2): 129-137. https://doi.org/10.1016/j.trd.2011.09.005
[45] Chen, J., Zhang, Y., Zhang, R., Cheng, X., Yan, F. (2019). Analyzing users’ attitudes and behavior of free-floating bike sharing: An investigating of Nanjing. Transportation Research Procedia, 39: 634-645. https://doi.org/10.1016/j.trpro.2019.06.065