Muhammad Nanang Prayudyanto![]() | Khalid Saifullah
| Khalid Saifullah![]() | Fitrah Satrya Fajar Kusumah
| Fitrah Satrya Fajar Kusumah![]() | Arief Goeritno
| Arief Goeritno![]() | Budi Susetyo*
| Budi Susetyo*![]()
© 2025 The authors. This article is published by IIETA and is licensed under the CC BY 4.0 license (http://creativecommons.org/licenses/by/4.0/).
OPEN ACCESS
Traffic congestion in Bogor City has led to significant fuel waste and severely impeded the flow of vehicles in this densely populated urban area. To solve this issue and help individuals plan their travels more effectively, creative solutions that offer real-time traffic information are needed. The goal of this research is to create an Android-based traffic monitoring information system that makes it easier to access data on traffic conditions. The waterfall approach utilizes the React Native Maps package for digital map creation and the React Native framework for Android application development. The Android-based information system technology then serves as a useful traffic monitoring tool. Digital maps connected with CCTV and Google Traffic enable the visualization of current traffic conditions, allowing individuals to readily determine the traffic situation, including information on public transportation routes. Test findings utilizing the black-box method reveal that the system works well on Android devices running 7.0 Nougat or higher. The system's key functions, such as real-time traffic monitoring, public transit route information, and the locations of traffic service facilities, were successfully deployed as designed. Even with basic data from CCTV connection, the Waterfall-based Android Traffic Information System has the advantage of being easy to use and flexible enough to adjust to local demands. Although 78% of respondents were satisfied with the system, 22% of users reported delayed system access during peak hours. Alternative routes from SIJAB using Google Maps or Waze led to a reduction in the average time taken to travel by 12.5%, and in some cases, up to 30% compared to traditional paths during peak hours.
real time, traffic monitoring, Android application, React Native, dense populated city
Transportation challenges in Indonesia are becoming more prevalent as urban populations grow in productivity, particularly in densely populated cities. Traffic systems are getting more advanced, and there is an increasing number of cars and crimes on the road. As a result, the need for traffic monitoring has clearly become a major issue. Crime and traffic congestion are two of the most pressing concerns facing the transportation system. Developing a trustworthy and easy-to-use traffic monitoring system that can successfully handle these issues and is available to everyone is one way to solve the problem. Significant time loss, property damage, and environmental pollution have resulted from traffic jams and accidents in recent years. Sixty percent of Indonesians live in cities, which are still expanding. One of Indonesia's most densely populated cities is Bogor City.
Bogor City's population is still growing, and the city's population density is getting denser. Between 2013 and 2021, the total number of cars in Bogor City went from 379,724 to 462,030, a 21.62% growth of 82,306 units [1]. The number of motorbikes increased significantly, accounting for 77.86% of all vehicles. Despite having a population of 1,052,359, Bogor City is just 11,850 hectares in size. With 9,385 inhabitants per km2, Bogor City is rated 11th on the list of Indonesian cities with the highest population density. Up to 80,000 commuters travel the 783.412-kilometer road to Jakarta every day, which causes extreme traffic during rush hour. Congestion has led to fuel waste, tension, and exhaustion. Bogor City ranks sixth among Indonesia's most congested cities, per the INRIX Global Traffic Scorecard 2021 report [2]. The annual fuel loss in West Bogor District as a result of traffic congestion has an economic potential of IDR 152,460,925,983.00, or US$10.2 million [3].
It is vital that Bogor City's traffic congestion be minimized. Road users demand a system that can evaluate traffic operations as they stand and use real-time traffic data to help drivers in selecting the optimal routes. In developed nations in Asia and Europe, strategies for tracking traffic flow in crowded cities are a field of study that is increasing quickly. In Europe [4] and Asia [5], surveillance cameras positioned at crossroads are utilized to anticipate accurate traffic flow and detect vehicle trends. This information was then used to automatically manage the timing of traffic light signals. As long as there are enough simulated gaps or spaces, motor cycles can move in a tangle alongside cars, which makes it tougher to estimate traffic flow [6].
One way that technology is used to keep an eye on traffic conditions is through digital maps on Android applications. This makes it easier to convey visual information and enables the production of an accurate representation of the area with the user's position [7]. The Google Traffic tool from Google Maps on digital maps can be used to see the current traffic conditions as a color plot of the route on the map [8].
In the meantime, technology like Closed Circuit Television (CCTV), which shows and records traffic conditions in real time, has emerged as an efficient monitoring tool. Along with keeping an eye on traffic conditions, the public can also benefit greatly from knowing traffic service information, such as public transit routes and the locations of public amenities like bus stops and terminals. This attempts to make it easier to plan how to use the public transportation that is available, particularly in Bogor, by utilizing BisKita (medium buses) and Angkot (small buses). In order to give real-time information about road conditions and transportation in Bogor City, this project will create an Android-based application called SIJAB mobile. The high usage of smartphones running Android in 2024 is the basis for the Android platform's decision. In May 2024, Android will have 87.45% of the Indonesian smartphone market, compared to IOS's 12.43% share, according to Statcounter statistics [9]. The majority of Indonesian smartphone users, according to this statistic, use Android, thus creating applications for Android is more pertinent, may reach a larger user base, and facilitates the community's access to the information they require.
Diaz et al. [10] conducted research on related subjects, specifically Mobile Application for Traffic Monitoring in Bali Province, which deals with the use of CCTV to enable real-time traffic monitoring via Android mobile devices. In order to make it easier for the general public to find information about public transportation routes, Widyaningsih et al. [11] have also carried out additional research on the Web-Based Public Transportation Route Information System. There will be some variances between this study and earlier research. React Native, a JavaScript framework for cross-platform development as a programming language, and the React Native Maps module are used to incorporate interactive maps into React Native applications, which is how the SIJAB mobile application was developed. Applications can use maps from different map service providers, such as Google Maps, as a foundation for displaying map layers by using React Native Maps.
The advancement of mobile technology, data collecting and analysis, and their integration into many important applications, such as transportation systems, has the potential to provide a more efficient, intelligent, and secure infrastructure for traffic monitoring and control [9]. Using the state-of-the-art you-only-look-once (YOLO) algorithm and advanced deep learning techniques, a new real-time traffic surveillance system has been created that offers vehicle recognition, classification, and segmentation [10]. A Traffic Detection System employing an Android application to determine traffic behavior in a specific place was built in an Indian city [11]. The rapid growth of information and communication system technology, particularly in Android-based smartphone applications, has a significant impact on obtaining information, including traffic on Indonesian roads. One example of using technology to monitor traffic conditions is the use of digital maps on Android applications, which make it easier to convey visual information and build an accurate picture of the area based on the user's location [12].
In the last decade, there have been some iterations to develop basic traffic monitoring systems, and we have seen initiatives to include crowdsourcing and location data extraction. A look at existing systems is essential for gaining a greater understanding of the problem and analyzing potential solutions. Waze is a geographical GPS-based navigation program designed for Android devices with GPS compatibility that offers clients with turn-by-turn data and journey times supplied by users, as well as route information. Waze is a community-driven application. Users are gathering complementing map and traffic data [13]. One element of Google Maps is Google Traffic, which shows traffic on major roads and highways and can be viewed on a smartphone using the Google Maps app. The GPS location data that users generate and send to Google is analyzed. A color plot of the road on the map can be used to visualize the current traffic conditions by using the Google Traffic feature from Google Maps on digital maps. "Beat the Traffic" offers live traffic cameras, a color-coded map showing regions of traffic congestion, and real-time traffic statistics [14].
Users can manually submit reports by transmitting information about accidents, hazards, construction zones, etc. It gathers data from smartphones and automobile navigation systems on roads and highways [15]. Technology like CCTV has become an effective solution for monitoring by displaying and recording traffic conditions in real time [16]. Along with keeping an eye on traffic conditions, the public can also benefit greatly from knowing traffic service information, such as public transit routes and the locations of public amenities like bus stops and terminals [17].
2.1 Traffic flow
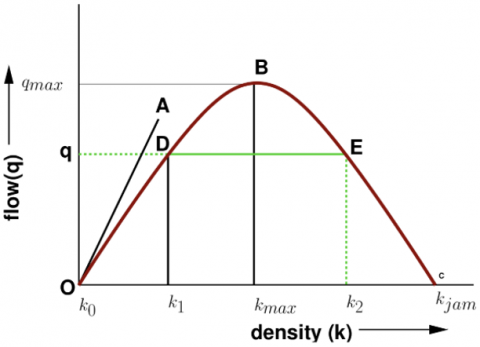
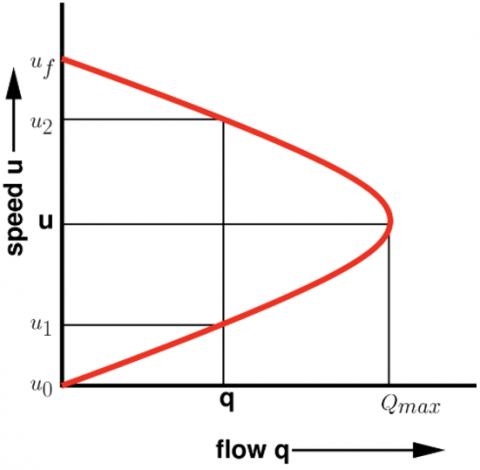
Most of the existing traffic flow theories are established considering the traffic stream with strict lane discipline. Several studies from South Asian countries have revealed substantial variability in the traffic stream with minimal or no lane discipline [18]. Figure 1 depicts the relationship between traffic flow (q) and vehicle density (k), known as the fundamental diagram of traffic flow. The red curve shows the non-linear relationship between flow and density [19]. The link between vehicle speed (u) and traffic flow (q) is seen in Figure 2. The parabolic curve shape of this graph is typical of macroscopic traffic flow models [19].
However, a straightforward concept of the link between flow, speed, and density was constructed in order to idealize the form of the relationship between flow and speed in a densely populated city like Bogor City. The identified lanes on the roadway will be useful in estimating the volume of traffic. Total traffic volume is the sum of the volume values of each type of vehicle multiplied by its equivalent value (pcu factor).
$Q=\sum_{i=1}^n Q_i \times p c u_i$ (1)
where, Q is hourly volume (vehicle/h), and $Q_i$ is volume each vehicle including motor cycle, car, bus and truck (vehicle/hour) and $p c u_i$ is passenger equivalent unit fro each vehicle. The average travel speed of the vehicles in a distance L (km) is then determined by:
$u=\frac{n L}{\sum_{i=1}^n t_i}=\frac{L}{\frac{1}{n} \sum_{i=1}^n t_i}=\frac{L}{t_a}$ (2)
where, u is the average speed (km/h), L is the length of the highway segment (km), $t_i$ is the ith vehicle's travel time to traverse the section (h), n is the number of travel times observed, and $t_a$ = average travel time over L (h).
Figure 1. Flow-density curve
Figure 2. Speed-flow curve
2.2 Android
Android is a free (open source) Linux-based operating system platform designed for a variety of devices and form factors. Android is equipped with a number of core applications for email, SMS messaging, calendar, internet browsing, contacts, and more [20]. Android software can be developed using the Waterfall model, a software development methodology. The Waterfall model is a method for developing software that follows an organized and sequential procedure. Needs analysis, system design and design, implementation, and testing are some of the steps in this process. Each step in this paradigm must be finished before moving on to the next, and it is implemented in a sequential manner. Because the process is methodical and disciplined, the waterfall model is frequently utilized in software development [20]. Alternatively, it can also be developed using the Agile methodology, which highlights iterative development, frequent stakeholder collaboration, and flexibility to adapt to changing requirements [21, 22].
2.3 React Native
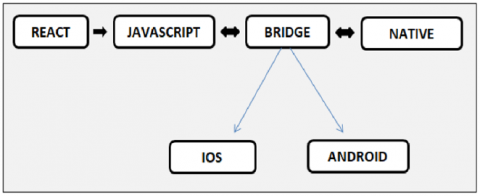
A package called React Native Maps is used for developing mobile applications with the React Native framework [23]. This library offers an interactive map component system with platform-native code that must be compiled with React Native. It will be used to demonstrate how to incorporate Google Maps into a React Native mobile application. Furthermore, as shown in Figure 3, React Native makes it simple to build concurrently for iOS and Android because the majority of the code is cross-platform.
Figure 3. How the React Native framework works
Chen et al. [24] presented a vehicle tracking algorithm-based approach for assessing urban traffic conditions. React Native can be used to create a cross-platform application that processes and shows real-time traffic data on iOS and Android smartphones.
2.4 Transport monitoring system
Urban transportation is a critical driver of mobility but faces persistent challenges in dense cities, where congestion and pollution undermine safety, efficiency, and reliability. Tailored reforms, supported by Android-based real-time monitoring, can enhance congestion detection, improve public transport performance, and promote sustainable mobility [25]. Rising mobility demand further intensifies these challenges, making advanced traffic management essential. Methods such as the Speed Transition Matrix, integrated into Android-based platforms, enable accurate traffic state detection, optimize transit operations, and support environmentally sustainable urban transport [26].
Smart mobility approaches combine eco-friendly transport systems with intelligent technologies to improve accessibility, safety, and environmental performance. Embedding real-time monitoring capabilities into Android platforms can enhance traffic control, reduce delays, and strengthen public transport efficiency in congested urban areas [27]. In order to identify congestion and improve transportation management, Sarrab et al. [28] suggested an Internet of Things (IoT)-based urban traffic monitoring system that can gather data in real-time. Rapid traffic situation analysis and the delivery of pertinent information to drivers and transportation authorities are made possible by the incorporation of IoT technology into the urban traffic monitoring system.
Sustainable Urban Mobility Plans (SUMPs) provide a strategic framework for integrated planning, targeted infrastructure investment, policy coordination, and ongoing performance evaluation. When combined with Android-based monitoring, SUMPs can further improve congestion management, optimize public transport services, and promote sustainable mobility in dense cities [29]. In Europe, SUMPs aim to boost efficiency, reduce congestion and pollution, and expand travel options. Continuous monitoring using structured models and decision-support tools such as the Analytic Hierarchy Process (AHP) ensures progress evaluation, prioritizes interventions, and maximizes public benefit [30].
Islam et al. [31] demonstrated that the effectiveness of adaptive traffic signal control systems is highly dependent on the level of vehicle connectivity and traffic observability. With higher connected vehicle penetration and improved data observability, the system can significantly reduce delays and queue lengths, thus supporting congestion management in urban areas.
2.5 Research objectives
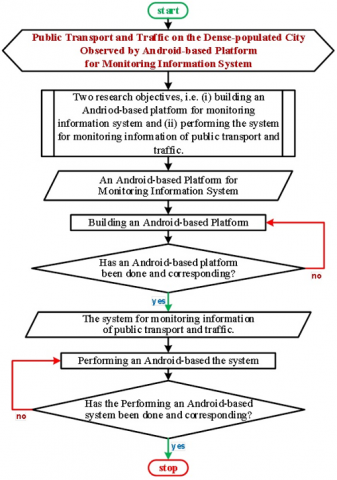
The research objectives are (i) to build an Android-based platform for monitoring information systems, and (ii) to develop an information system for monitoring public transport and traffic.
3.1 Traffic data
According to Upadhyay et al. [32], traffic data collecting is the process of compiling traffic data from multiple sources, including mobile devices, GPS, CCTV cameras, and car sensors. Road conditions, travel patterns, vehicle density, average speed, and traffic volume are among the data gathered.
Information about Bogor City traffic, including CCTV footage and public transit routes acquired from the Bogor City Transportation Agency, served as the study's primary source of data. The Geospatial Information Agency's official Indonesian Topographic Map (RBI) is the source of the JSON data that describes Bogor City's borders. Google Maps provides information about the locations of Bogor City's public facilities and traffic infrastructure [33].
Table 1. Software
|
Software |
Description |
|
Windows 11 |
The operating system used to design systems |
|
Visual Studio Code |
The text editor used for coding application programs |
|
Draw.io |
An application for creating UML diagrams |
|
Android Studio |
An application with a built-in Android emulator for efficiently testing Android applications |
|
React Native |
JavaScript framework for creating and developing Android applications |
|
React Native Map |
The React Native library provides map system components for features such as interactive maps and location marker creation |
|
Figma |
Design a platform for creating custom assets, such as markers on a map |
3.2 Computer
The resources utilized to assist in the completion of this study fall into two categories:
1. Hardware: The following pieces of equipment were used in this study:
2. Software: The software used in this study can be seen in Table 1.
3.3 Methodology
The research technique is the methodology that a researcher employs in order to carry out the study. This methodology is carried out in stages in order to succeed and in accordance with the objectives of the study. Figure 4 displays the research methodology flowchart. This research method uses the waterfall method, including data collection, analysis, design, coding, and testing. The waterfall method was chosen because it provides a structured and systematic approach, allowing each phase of the project to be fully completed before the next phase begins, thus ensuring that each stage of application development is well prepared and documented in detail. In addition, by using the waterfall method, the risk of error can be minimized because each phase is reviewed and validated before proceeding to the next phase.
Figure 4. Flowchart of the research methods
The design is implemented in program code using the JavaScript programming language and the React Native framework. This process is a transformation of the design into a format that can be understood by the computer. After the coding process is complete, testing is carried out on the system that has been developed. The system testing process is carried out using the black-box testing method to test the function of each menu that has been created in the Bogor City traffic monitoring information system application based on Android. The black-box testing method was chosen because it focuses on testing the functionality of the application without requiring an in-depth understanding of the internal code or structure of the application.
However, the waterfall method's drawbacks include [34]: (a) Less Flexible: The waterfall model prioritizes the first phases of thorough planning and design. Since each step must be finished before the next one starts, changing to a later stage is extremely challenging, if not impossible; (b) Long Time: Projects using the waterfall approach typically take longer than those using alternative, more flexible development methods because of this sequential and linear procedure; (c) Unsuitable for Uncertain Needs Projects: Projects with well-defined requirements from the outset are best suited for the waterfall paradigm. It will be extremely challenging to apply this paradigm if needs or requirements change while the project is being developed. Waterfall was chosen for this study due to its short research period and as a preliminary study choice, so that a better model may be used for subsequent development.
3.4 Analysis
An analysis process is carried out, which aims to formulate system requirements and analyze the processing of collected data. This process includes user requirements analysis, functional system requirements analysis, identification of non-functional requirements, and determination of system architecture. Kong et al. [35, 36] used floating automobile trajectory data—location and speed information periodically sent by GPS-equipped vehicles—to estimate and forecast urban traffic congestion. Traffic conditions on different road segments are determined by analyzing this data, which includes travel routes, journey times, and average speeds.
3.4.1 Traffic conditions
Based on traffic survey data [1], road network performance analysis was carried out by calculating the volume capacity ratio (VCR) and level of service (LoS) indicators. In addition, following the approach of Mitchell and Seaman [34], efficient traffic state estimation methods can be applied to large-scale urban road networks by integrating real-time traffic data from multiple sources, enhancing the precision assessment of congestion patterns and network performance. Based on Table 2, the level of road service in Bogor City in 2024 has reached the LoS D with a VCR above 0.75, which is indicated by traffic jams and low vehicle speeds.
Table 2. Road traffic performance in Bogor (2024)
|
Road |
Class. |
Capacity (PCU/hr) |
Volume (PCU/hr) |
VCR |
LoS |
|
Tol Jagorawi |
Highway |
7,339 |
5,085 |
0.70 |
C |
|
Pajajaran 1 |
National |
6,807 |
4,967 |
0.73 |
C |
|
Pajajaran 2 |
National |
6,807 |
4,828 |
0.71 |
C |
|
Pajajaran 3 |
National |
7,413 |
3,984 |
0.54 |
C |
|
Pajajaran 4 |
National |
5,741 |
2,645 |
0.47 |
C |
|
Gintung |
Local |
3,912 |
2,382 |
0.61 |
C |
|
Pahlawan 1 |
Province |
3,912 |
3,108 |
0.80 |
D |
|
Pahlawan 2 |
Province |
3,912 |
3,018 |
0.78 |
D |
|
Empang |
Local |
5,678 |
3,237 |
0.58 |
C |
|
H. Juanda 1 |
Province |
5,560 |
4,240 |
0.77 |
D |
|
H. Juanda 2 |
Province |
7,413 |
4,161 |
0.57 |
C |
|
Kapten Muslihat |
Province |
5,810 |
4,424 |
0.77 |
D |
|
Sudirman |
Province |
5,928 |
3,993 |
0.68 |
C |
|
Jalak Harupat |
Province |
3,744 |
3,322 |
0.89 |
E |
|
Otista |
Province |
4,406 |
4,155 |
0.95 |
E |
|
Batu Tulis 1 |
Province |
3,669 |
2,889 |
0.79 |
D |
|
Batu Tulis 2 |
Province |
3,669 |
2,890 |
0.79 |
D |
3.4.2 Additional fuel consumption due to traffic jams
Additional fuel expenditure is taken into consideration when calculating congestion charges. Furthermore, following the approach of Chen et al. [37], integrating map-matching algorithms for large-scale low-frequency floating car data can improve the accuracy of traffic congestion assessment. According to the findings of a survey conducted over the course of eighteen hours in the Bogor Botanical Gardens, 46,199 motorcyclists, 18,308 passenger cars and public transportation, and 1,090 buses and trucks passed by Prayudyanto et al. [1]. Table 3 explains the estimated additional fuel costs from the escalation of calculations during the closure of bridge construction in Bogor City for a period of one year. Additional congestion costs in the city center of Bogor are estimated to reach Rp. 94 billion per year.
Table 3. Additional Fuel Cost (AFC) in IDR (Mio)
|
Vehicle Type |
Add. Fuel Cost /Veh. (IDR) |
Number of Vehicles |
AFC (During Cosntr., IDR) |
AFC (per Year, IDR) |
|
Motor cycle |
1,275 |
46,199 |
15,904 |
23,856 |
|
Car |
9,588 |
18,308 |
47,395 |
71,092 |
|
Bus/Truck |
7,081 |
1,090 |
2,083 |
3,125 |
|
|
|
Total |
65,382 |
98,074 |
3.4.3 User need analysis
The purpose of user needs analysis is to comprehend the users who interact with the system directly. Users of the Android-based Bogor City (West Java Province) traffic monitoring information system are members of the general public who visit the website and use the main page to obtain information. Mobile devices, like cell phones, can be used as active data sources for detecting and predicting traffic congestion in addition to being information points, as shown by Hansapalangkul et al. [38]. By allowing crowdsourced traffic data gathering and information distribution, comparable features could improve user engagement in the system design.
3.4.4 Functional need analysis
This study's functional needs analysis phase outlines the procedure or feature application must have in order to meet user needs. Table 4 lists the primary tasks that the application must complete in accordance with the requirements.
Table 4. Function needs analysis
|
Function |
Description |
|
Home view function |
To view information about the application and the total services available. |
|
Digital maps |
To visually view traffic information in Bogor City through maps that can be accessed through Android-based smartphones. |
|
Changing Layer Type |
To customize the type of digital map layer according to the user's preference. |
|
Traffic View |
To view real-time traffic conditions on a digital map integrated with the Google Traffic layer. |
|
Road Path View |
To view the routes of toll roads, national roads, and provincial roads. |
|
Public Transportation Routes |
To view public transportation routes operating in the city of Bogor. |
|
Location of Public Facilities, |
To view detailed information selected from a public facility, CCTV, and traffic police location in Bogor City. |
|
Emergency Contacts |
To display information on emergency numbers from the police or other emergency services. |
|
User Location |
To display the location points of the application user. |
|
Size of Digital Maps |
To enlarge or reduce the size of the map to make it easier for users to view locations. |
|
View News |
To view traffic news so that users can easily get the latest information. |
|
View CCTV |
To view the current traffic conditions through available CCTV cameras. |
3.4.5 Non-functional need analysis
Non-functional application requirements include the following:
3.4.6 System architecture analysis
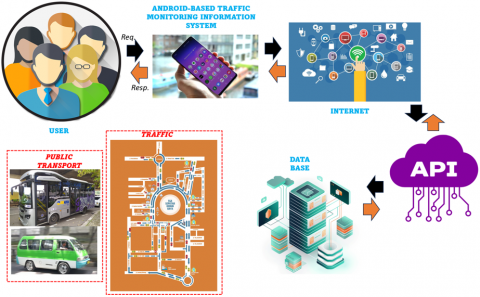
The client-server model, in which the server offers services to clients who actively submit and request services, is referred to in the system architecture analysis [29]. Figure 5 displays the study of the system design. Users are people who access Android-based traffic monitoring information systems through mobile applications. As a client, the program makes queries to the server and shows the information it receives. By linking mobile applications to servers or other Internet-connected equipment, the Internet acts as a worldwide communications infrastructure. Mobile applications and linked system services communicate and exchange data through an intermediary called the Application Programming Interface (API). One of the key elements of a system design that is in charge of managing, storing, and granting access to data is a database.
Figure 5. System architecture
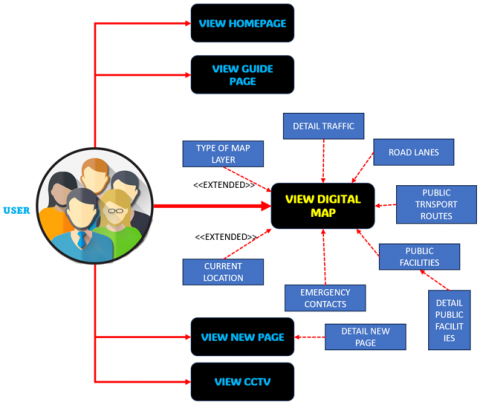
Use case diagrams, activity diagrams, class diagrams, component diagrams, deployment diagrams, and Android application interfaces are the six categories of system design. Interactive work activities between actors and visitors are diagrammatically explained in Figure 6. The purpose of use case diagrams in system design is to explain how actors or visitors interact with the system that will be developed. This research will develop an Android-based application named SIJAB Mobile, which stands for "Sistem Informasi Jalan Kota Bogor," or "road traffic information system for Bogor city," to provide real-time information about road conditions and transit in the city.
Figure 6. Activity diagram
4.1 Results
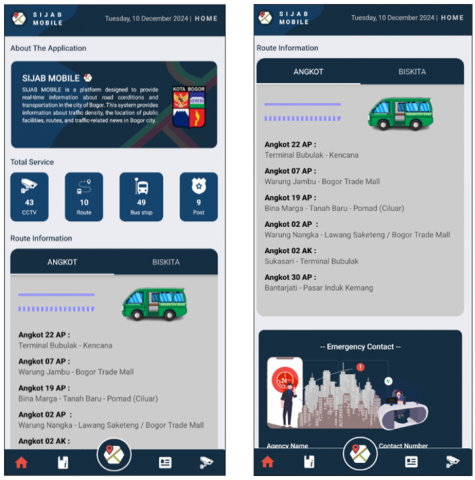
The stage of applying the developed and implemented interface design in the application is known as system implementation. The first thing users see when they launch is the home page. On the home page, users can view information about the application, the number of services in Bogor City, including CCTV, bus stops, routes, and police posts, as well as details on public transit routes, specifically Angkot and BisKita. They can also view emergency contacts. Additionally, the home page's navigation is by default located at the bottom of the screen, thus other sites like news, guides, and CCTV will follow suit. In Figure 7, the home page is displayed. The guide page is a display of an instruction manual for utilizing the application's digital maps. It covers fundamental usage, how to examine routes, how to use features, emergency contacts, and definitions of each legend icon's function. The primary function of the application that displays traffic data is the Digital Map page.
Figure 7. The guide page
SIJAB described the BusKita and Angkot routes in Bogor City, including the starting and ending terminal sites, vehicle routes, and bus stop locations, as shown in Figure 8.
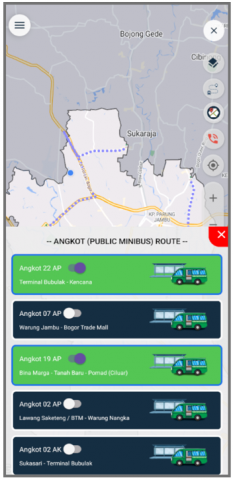
Figure 8. Public transport routes
The navigation menu display and the digital map's home page are situated on the left side of the screen. Selecting the type of map layer, map traffic information, public transportation routes, SIJAB Points, emergency contacts, the Global Positioning System (GPS) button for viewing the user's current location, and buttons to zoom in and out of the digital map display are among the features on the digital map page.
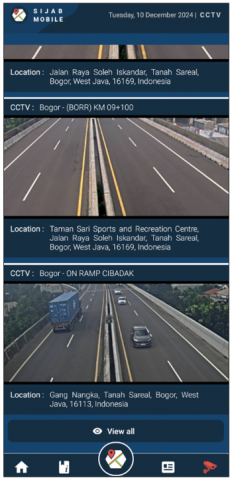
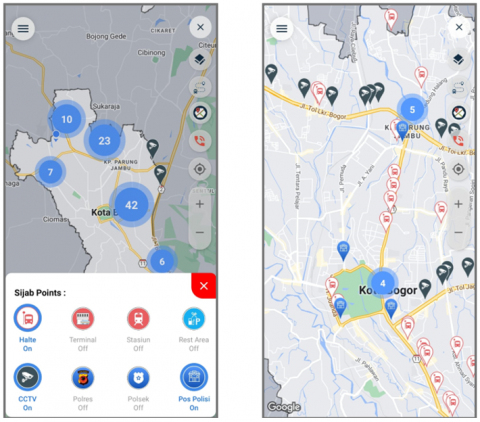
SIJAB Points is a feature on a digital map that shows a location's distribution points together with comprehensive details, such as the locations of CCTV (Figure 9) and traffic police, as well as public facilities, including bus stops, terminals, stations, and rest spaces (Figure 10). Moreover, CCTV is shown on a digital map, allowing users to view traffic conditions in real time according to the CCTV's location.
Figure 9. CCTV page
Figure 10. Public facilities map
4.2 Testing of the model
4.2.1 Blackbox test
The purpose of the system testing is to confirm that the created Android-based Bogor City traffic monitoring information system operates as intended. Every system function is tested in this study using the black-box testing technique. This approach was selected because it concentrates on evaluating the functionality of the application without necessitating an understanding of the internal workings or computer code. The outcomes of system testing with the black-box approach are shown in Table 5. Numerous system elements, including access to the home page and particular capabilities like reading digital maps, altering the types of map layers, seeing traffic information, and other features, were tested.
Table 5. Outcomes of the model test
|
Function |
Scenario |
Output |
Result-Android 7 or More |
Result- Android 7 or Less |
|
View Home |
Test accessing the home page |
Displays the application's home page, which includes details on the program and all of its services. |
Testing successful |
Testing successful |
|
View Digital Map |
Trial accessing digital maps |
Displays digital maps and loads necessary data from the API. |
Testing successful |
Test failed |
|
Changing Map Layer Type |
Test by selecting the terrain map layer type and satellite type |
Standard layers were first shown on the digital map, followed by topography layers, satellite layers, and finally standard layer types once more. |
Testing successful |
Test failed |
|
View Traffic Map Details |
Test enabling map of road traffic condition |
Displays current traffic conditions according to Google Traffic. |
Testing successful |
Test failed |
|
View Road Lane |
Test of Road Classifications |
Displaying provincial highways in thin light orange, national roads in thin medium red, and toll roads in thick dark red. |
Testing successful |
Test failed |
|
View Public Transportation Routes |
Trial to activate public transportation routes on the map |
Displays public transportation and BisKita routes in Bogor City on the map. |
Testing successful |
Test failed |
|
Viewing the Location of Public Facilities |
Trial to activate bus stop and police station icons |
When the icon button becomes blue (active), the number of bus stops and police stations in the city of Bogor is displayed. |
Testing successful |
Test failed |
4.2.2 System performance test
In the testing of the system, functional analysis and simulations based on dense traffic scenarios in urban areas were carried out. Several system performance metrics were evaluated as follows:
4.2.3 Route choice test
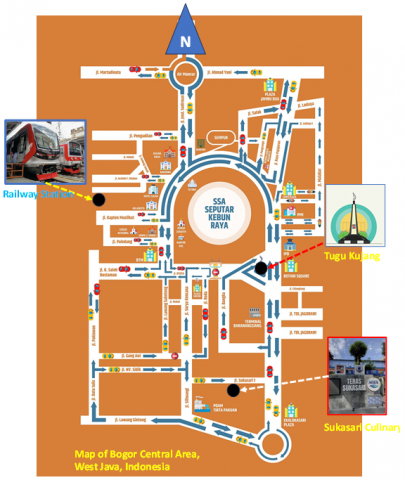
SIJAB presently lacks its own route selection system and is limited to operating as a traffic monitoring information platform rather than serving as a navigation application. Sijab can exhibit current traffic situations using the Google Traffic layer, visualize traffic congestion using color coding (green/yellow/red), indicate CCTV locations for visual observation, and offer details on public transportation routes (Angkot, BisKita). In order to choose a route through routing/navigation, the user needs to utilize a different application like Google Maps or Waze. SIJAB can serve as an additional tool to view traffic conditions prior to route selection (Figure 11).
Figure 11. Bogor CBD area
SIJAB, when paired with Google Maps or Waze, proves useful in offering immediate alternative paths, even utilizing basic information from Dishub CCTV integration alongside route data. It can save up to 30% of travel time, especially during peak hours (Table 6). This approach, which suggests a combination of public transportation and walking, is also innovative.
Table 6. Estimated travel time reduction advantage with SIJAB paired with Google Maps or Waze
|
Route |
Distance (km) |
Travel Time |
Traffic Jam |
Benefit |
|
Without SIJAB (Pajajaran - Otista) |
4.2 |
30 min |
Heavy traffic jam |
- |
|
With SIJAB (Siliwangi - Juanda) |
4.5 |
21 min |
Moderate- Smooth |
Time saving ±30% |
|
Public Transport: Angkot “03” (existing route) |
4.2 |
38–45 min |
Heavy traffic jam |
- |
|
Public Transport with SIJAB (Angkot “08” + walking) |
3.8 |
23 min |
Light traffic jam |
Time saving & energy |
Private Car Route Choice. CCTV visual data is used at Tugu Kujang (the Kujang Monument, the iconic location of the city) and Ekalokasari (a culinary center in the east of Bogor city) to identify traffic jams and provide suggestions for alternate, less congested routes. The suggested route when using SIJAB along with Waze or Google Maps is as follows: Baranangsiang Terminal to Jl. Siliwangi to Jl. Juanda to Bogor Station. Distance is ±4.5 kilometers and travel time estimate is ±21 minutes. Savings in time of about 9 minutes (30%).
Route Selection for Public Transportation. To get to the railway station via traditional public transport, take Angkot Route 03, which runs from Baranangsiang Terminal to Jl. Pajajaran to Jl. Otista. At the intersection of Tugu Kujang and BTM, there is a traffic jam. SIJAB integrates with Google Maps and Waze to recommend different travel paths (using Angkot and walking). Travelers can board Angkot line 08 at Baranangsiang Terminal, disembark at PMI Hospital, and proceed on foot along Jl. Juanda to reach the Station. The duration of the trip is approximately 23 minutes, which prevents two significant traffic congestions from happening.
4.2.4 Satisfaction
Based on feedback from 78% of participants who found the system management satisfactory, the integration of SIJAB with platforms like Google Maps or Waze was advantageous. However, 17% of those surveyed indicated that while the system was quite useful, there were aspects that required enhancement. Only 5% expressed dissatisfaction owing to different tech-related issues. Additionally, 15% of users considered the user interface to be less user-friendly, 22% reported slow access to the system during busy times, and 8% encountered issues with the camera system's ability to detect license plates.
4.3 Discussion
The test results from compatibility, core functionality, technological integration, and restriction demonstrate several important features of system performance.
Table 7. SIJAB comparison with Waze and Google Maps
|
Features |
SIJAB |
Waze |
Google Maps |
|
CCTV Traffic Integration |
Yes (only selected cities) |
Not available |
Not available directly |
|
Public Transport Route Information |
Yes (local public transport) |
Not available |
Yes (major public transport) |
|
Real-Time Navigation |
Limited (manual update) |
Yes (community based) |
Yes |
|
Crowdsourcing (user report) |
Not available |
Yes |
Limited (automation) |
|
Travel Time Estimation |
Yes (local) |
Yes |
Yes |
|
Offline Map Integration |
Not available |
Not available |
Yes |
|
Accident/ Congestion Detection |
Limited |
Yes (user report) |
Yes (automation via GPS data) |
|
Map Display |
Simple (traffic focus) |
Engaging and interactive |
Detailed & profesional |
|
Transportation Mode |
Focus on public transport and private vehicles |
Private vehicles |
All (car, public transport, pedestrian, bicycle) |
|
Stable Internet Requirement |
Yes, for CCTV |
Yes |
Can be offline with maps |
|
Navigation Personalization and Voice |
Not available |
Yes |
Yes |
The public can avoid traffic jams by monitoring traffic conditions in real-time through the combination of CCTV and Google Traffic on a digital map. People can more easily plan their journey in their everyday activities when this technology is used to assure accurate visualization of traffic conditions. The Waterfall-based Android Traffic Information System has advantages in adapting to local needs and simplicity of use. The model is quite effective in providing real-time alternative routes, even with simple data such as Dishub CCTV integration and route data. The average latency to display CCTV images from the Dishub server to the user application is around 2.3 seconds in a stable connection (4G). On an unstable network (3G), the delay time increases to 4.8 seconds. This is still within the tolerance limit for passive visual traffic monitoring. Different routes from SIJAB using Google Maps or Waze led to a reduction in the average time taken to travel by 12.5%, and in some cases, up to 30% compared to traditional paths. However, compared to applications such as Waze and Google Maps, this system has limitations in terms of features, interactivity, and real-time data updates. By using alternative software development paradigms like Agile, Scrum, Rapid Application Development (RAD), and Object Oriented Technology (OOT), the drawbacks of the Waterfall process can be lessened. Since these models are more adaptable, they could be modified as the project progresses.
[1] Prayudyanto, M.N., Hariati, F., Rulhendri, Chayati, N., Hudjimartsu, S.A. (2023). Penyusunan Kajian Antisipasi Dampak Sosial Ekonomi Pembangunan di Kawasan Jalan OTISTA Kota Bogor terhadap Pergerakan Lalu Lintas dan Pelayanan Angkutan Umum Orang, Barang dan Jasa (Laporan akhir). https://bapperida.kotabogor.go.id/po-content/uploads/penyusunan_kajian_antisipasi_dampak_sosial_ekonomi_pembangunan_di_kawasan_jalan_otista__kota_bogor_terhadap_pergerakan_lalu_lintas_dan_pelayanan_angkutan_umum_orang_barang_dan_jasa.pdf.
[2] INRIX Inc. (2021). 2021 INRIX Global Traffic Scorecard. https://smarttransportpub.blob.core.windows.net/web/1/root/inrix-2021-global-traffic-scorecard-updated46.pdf.
[3] Marwan, F., Putri, E.I.K. (2011). Analisis dampak kemacetan lalu lintas dengan pendekatan willingness to accept (Studi kasus: Kecamatan Bogor Barat). Undergraduate thesis, UT-Faculty of Economics and Management, IPB University, Indonesia. http://repository.ipb.ac.id/handle/123456789/64846.
[4] Wan, Y., Jankauskas, T., Odartey, L.K. (2019). Lithuanian traffic monitoring system (LTTMS) based on Android. Journal of Physics: Conference Series, 1176(2): 022012. https://doi.org/10.1088/1742-6596/1176/2/022012
[5] Hung, N.V., Dung, N.H., Hoang, T.M., Dzung, N.T. (2016). A traffic monitoring system for a mixed traffic flow via road estimation and analysis. In 2016 IEEE Sixth International Conference on Communications and Electronics (ICCE), Ha-Long, Vietnam, pp. 375-378. https://doi.org/10.1109/CCE.2016.7562665.
[6] Mandal, V., Mussah, A.R., Jin, P., Adu-Gyamfi, Y. (2020). Artificial intelligence-enabled traffic monitoring system. Sustainability, 12(21): 9177. https://doi.org/10.3390/su12219177
[7] Kharima, K.D., Fanida, E.H. (2021). Inovasi aplikasi transportasiku di dinas perhubungan Kota Surabaya. PUBLIKA, 9(1): 199-214. https://doi.org/10.26740/publika.v9n1.p199-214.
[8] Hossain, I., Nower, N. (2022). Traffic data collection and visualization tool for knowledge discovery using Google Maps. International Journal of Software Innovation, 10(1): 1-12. https://doi.org/10.4018/IJSI.293270
[9] Global Stats. (2021). Mobile Operating System Market Share Indonesia. https://gs.statcounter.com/os-market-share/mobile/indonesia.
[10] Diaz, R.A.N., Novianti, K.D.P., Parasu, I.B.E. (2017). Mobile application untuk traffic monitoring wilayah Provinsi Bali. E-Proceedings KNS&I STIKOM Bali, 67-72.
[11] Widyaningsih, T.W. (2018). Sistem informasi trayek angkutan umum berbasis web. Ultima InfoSys: Jurnal Ilmu Sistem Informasi, 9(1): 58-62. https://doi.org/10.31937/si.v9i1.862
[12] Daraojimba, E.C., Nwasike, C.N., Adegbite, A.O., Ezeigweneme, C.A., Gidiagba, J.O. (2024). Comprehensive review of agile methodologies in project management. Computer Science & IT Research Journal, 5(1): 190-218. https://doi.org/10.51594/csitrj.v5i1.717
[13] Traffic Monitor. TrafficMonitor.ai: Open source roadway object detection and radar speed monitoring. https://trafficmonitor.ai/.
[14] Ahonen, T., Hadid, A., Pietikäinen, M. (2004). Face recognition with local binary patterns. In Computer Vision-ECCV 2004: 8th European Conference on Computer Vision, Prague, Czech Republic, pp. 469-481. https://doi.org/10.1007/978-3-540-24670-1_36.
[15] Ahmed, A., Ngoduy, D., Adnan, M., Baig, M.A.U. (2021). On the fundamental diagram and driving behavior modeling of heterogeneous traffic flow using UAV-based data. Transportation Research Part A: Policy and Practice, 148: 100-115. https://doi.org/10.1016/j.tra.2021.03.001
[16] Gerlough, D.L., Huber, M.J. (1975). Traffic Flow Theory: A Monograph TRB. Special Report 165. Transportation Research Board, Washington DC. https://onlinepubs.trb.org/onlinepubs/sr/sr165/165.pdf.
[17] Ross, P. (1988). Some properties of macroscopic traffic models. Transportation Research Record, (1194): 129-34. http://onlinepubs.trb.org/Onlinepubs/trr/1988/1194/1194-014.pdf.
[18] Knoop, V., Hoogendoorn, S.P., van Zuylen, H. (2009). Empirical differences between time mean speed and space mean speed. In Traffic and Granular Flow’07. Springer, Berlin, Heidelberg. https://doi.org/10.1007/978-3-540-77074-9_36
[19] May, A.D. (1990). Traffic Flow Fundamentals. Prentice Hall.
[20] Eisenman, B. (2015). Learning React Native: Building Native Mobile Apps with JavaScript. CA: O'Reilly Media, Inc.
[21] Uikey, N., Suman, U. (2012). An empirical study to design an effective agile project management framework. In CUBE '12: Proceedings of the CUBE International Information Technology Conference, Pune, India, pp. 385-390. https://doi.org/10.1145/2381716.2381788
[22] Fidyawan, M.A., Raharjo, T. (2023). A systematic review of the aspects and benefits of agile project management innovation. Indonesian Journal of Computer Science, 12(6): 1494-1506. https://doi.org/10.33022/ijcs.v12i6.3531
[23] React Native Maps. React Native Maps components for iOS+Android. https://github.com/react-native-maps/react-native-maps, accessed on Jul. 21, 2023.
[24] Chen, Y., Gao, L., Li, Z.P., Liu, Y.C. (2007). A new method for urban traffic state estimation based on vehicle tracking algorithm. In 2007 IEEE Intelligent Transportation Systems Conference, Bellevue, WA, USA, pp. 1097-1101. https://doi.org/10.1109/ITSC.2007.4357646
[25] Wicaksana, L., Setyowati, K., Suharto, D.G. (2020). Sustainable transportation reform development through partnerships based on bounded rationality and incremental model. In Proceedings of the Third International Conference on Social Transformation, Community and Sustainable Development (ICSTCSD 2019), Atlantis Press. https://doi.org/10.2991/icstcsd-19.2020.31
[26] Skhosana, M., Ezugwu, A.E. (2021). A real-time machine learning-based public transport bus-passenger information system. International Journal of Sustainable Development and Planning, 16(7): 1221-1238. https://doi.org/10.18280/ijsdp.160703
[27] Meyer, B., Szaja, M. (2019). Transport as the basis for functioning of a smart city – An example of Szczecin. Prace Komisji Geografii Komunikacji PTG, 22(3): 53-63. https://doi.org/10.4467/2543859XPKG.19.017.11283
[28] Sarrab, M., Pulparambil, S., Awadalla, M. (2020). Development of an IoT based real-time traffic monitoring system for city governance. Global Transitions, 2: 230-245. https://doi.org/10.1016/j.glt.2020.09.004
[29] Tišljarić, L., Carić, T., Abramović, B., Fratrović, T. (2020). Traffic state estimation and classification on citywide scale using speed transition matrices. Sustainability, 12(18): 7278. https://doi.org/10.3390/su12187278
[30] Damidavičius, J., Burinskienė, M., Ušpalytė-Vitkūnienė, R. (2019). A monitoring system for sustainable Urban mobility plans. The Baltic Journal of Road and Bridge Engineering, 14(2): 158-177. https://doi.org/10.7250/bjrbe.2019-14.438
[31] Islam, S.B.A., Tajalli, M., Mohebifard, R., Hajbabaie, A. (2021). Effects of connectivity and traffic observability on an adaptive traffic signal control system. Transportation Research Record, 2675(10): 800-814. https://doi.org/10.1177/03611981211013036
[32] Upadhyay, A., Kumar, A., Singh, V. (2020). Traffic data collection and visualization using intelligent transport systems. In Smart Cities—Opportunities and Challenges. Springer, Singapore, pp. 127-134. https://doi.org/10.1007/978-981-15-2545-2_12
[33] Rachmawati, F., Widhyaestoeti, D. (2020). Deteksi jumlah kendaraan di jalur SSA Kota Bogor menggunakan algoritma deep learning YOLO. Prosiding LPPM UIKA Bogor, 360-370. https://pkm.uika-bogor.ac.id/index.php/prosiding/article/download/657/564/.
[34] Mitchell, S.M., Seaman, C.B. (2008). A comparison of software cost, duration, and quality for waterfall vs. iterative and incremental development: A systematic review. In 2009 3rd International Symposium on Empirical Software Engineering and Measurement, Lake Buena Vista, FL, USA, pp. 1-10. https://doi.org/10.1109/ESEM.2009.5314228
[35] Kong, X., Xu, Z., Shen, G., Wang, J., Yang, Q., Zhang, B. (2016). Urban traffic congestion estimation and prediction based on floating car trajectory data. Future Generation Computer Systems, 61: 97-107. https://doi.org/10.1016/j.future.2015.11.013
[36] Kong, Q.J., Zhao, Q., Wei, C., Liu, Y. (2013). Efficient traffic state estimation for large-scale urban road networks. IEEE Transactions on Intelligent Transportation Systems, 14(1): 398-407. https://doi.org/10.1109/TITS.2012.2218237
[37] Chen, B.Y., Yuan, H., Li, Q., Lam, W.H., Shaw, S.L., Yan, K. (2014). Map-matching algorithm for large-scale low-frequency floating car data. International Journal of Geographical Information Science, 28(1): 22-38. https://doi.org/10.1080/13658816.2013.816427
[38] Hansapalangkul, T., Keeratiwintakorn, P., Pattara-Atikom, W. (2007). Detection and estimation of road congestion using cellular phones. In 2007 7th International Conference on ITS Telecommunications, Sophia Antipolis, France, pp. 1-4. https://doi.org/10.1109/ITST.2007.4295851