Nguyen Cao Duc![]() | Le Van Hung
| Le Van Hung![]() | Won Joong Kim
| Won Joong Kim![]() | Nguyen Ngoc Trung*
| Nguyen Ngoc Trung*![]()
© 2025 The authors. This article is published by IIETA and is licensed under the CC BY 4.0 license (http://creativecommons.org/licenses/by/4.0/).
OPEN ACCESS
The rapid emergence of the sharing economy has introduced significant changes to the structure of urban transport systems, particularly in terms of labour dynamics and social interaction. This paper investigates the impact of ridesharing platforms on social perspectives, new labour market structures, and evolving value systems within urban transport. The study aims to understand how these platforms influence drivers' perceptions of life, social connectedness, and work-related satisfaction by examining the role of new labour characteristics and platform-induced values. To address these aims, data were collected from over 2,000 Grab driver-partners across Vietnam through a nationwide questionnaire survey. Responses were analysed using Covariance-Based Structural Equation Modelling (CB-SEM) to explore the interrelation between latent constructs representing labour market dynamics, emerging values, and social perspectives. Findings indicate that ridesharing platforms enable higher autonomy in work scheduling, foster stronger connections between drivers and customers, and contribute positively to drivers’ income, well-being, and social engagement. These transformations suggest a paradigm shift in urban transport labour and social integration, driven by digital mobility platforms. The results provide insights for policymakers and transport planners regarding the governance of platform-based labour and its integration with smart mobility strategies in urban areas.
ridesharing platforms, platform labour, urban mobility, social perspectives, CB-SEM, worker well-being
In recent years, the sharing economy has emerged as a disruptive force that reshapes how individuals interact, access services, and engage in economic activities. Among its most transformative applications is urban transport, where ridesharing platforms have redefined the traditional taxi industry and introduced new dynamics to labour markets and social relationships. These platforms enable flexible work arrangements for drivers, foster digital customer interactions, and promote value systems rooted in peer-to-peer labour exchange. However, their rapid expansion has also raised questions about labour rights, regulation, and long-term social impacts.
While existing studies have extensively examined the economic and employment effects of ridesharing—such as increased labour force participation, improved accessibility, and price competition—most of this literature is concentrated in developed contexts and focuses on supply-demand or consumer behaviour dimensions [1]. Much less attention has been paid to the social consequences of ridesharing platforms, particularly from the perspective of driver-partners. These include changes in personal well-being, social connectivity, and perceptions of work autonomy, which remain underexplored, especially in developing countries.
This study addresses this research gap by focusing on Vietnam, where Grab has become the potential ridesharing provider in urban areas. The country presents a relevant context for investigating how digital platforms alter labour conditions and social life, given its rapid urbanisation and evolving digital infrastructure. This paper explores how ridesharing platforms contribute to new labour market characteristics and emerging digital values, and how these dimensions, in turn, influence drivers’ social perspectives.
The novelty of this research lies in its use of primary data from over 2,000 Grab drivers across Vietnam and the application of Covariance-Based Structural Equation Modelling (CB-SEM) to examine latent relationships among labour structure, values, and perceived social outcomes. By integrating perspectives on digital labour and value systems, the study provides a multidimensional understanding of how platform work is reshaping urban social life.
Accordingly, this research aims to examine how the ridesharing economy affects drivers’ social perspectives by analysing their perceived autonomy, engagement, and satisfaction. Specifically, the study seeks to:
(1) Identify key indicators that shape new values and labour structures in the platform economy;
(2) Explore the interrelationship between these two constructs;
(3) Assess the extent to which they influence drivers’ social well-being and integration.
This section reviews previous studies related to the social impacts of ridesharing platforms, with a focus on three major dimensions: (1) labour market dynamics, (2) value creation and transformation, and (3) social perceptions and engagement. By organising the literature thematically, this review highlights key empirical findings and identifies gaps that this study seeks to address.
2.1 Labour dynamics in the ridesharing economy
The sharing economy has created a new labour market with a relatively large full-time and part-time workforce in many places worldwide. Employees help to reduce transaction and transportation costs in this new labour market and control their own employment. Uber has been hailed as a revolutionary peer-sharing platform, disrupting the archaic taxi industry and creating employment and transportation opportunities for an increasingly imperilled middle class. Generally, innovations or start-up subsidies are not companies’ application but the creation of part-time vs. full-time drivers and employees’ wellbeing [2, 3].
The members of the workforce in this sharing economy work as independent agents, as shown in another similar study [4], which analyses the labour process and labour supply of drivers for a Chinese mobile-travel platform. Contrary to the traditional labour process control, such platforms have a more fragmented control, which coexists with workers’ task autonomy.
The sharing economy does not always prove advantageous to employees since they may not feel comfortable with the new labour management and technology companies sometimes push risk onto drivers. Labour has been regarded as one type of asset exchanged in the sharing economy, as part of the customer interface when services are sold, or as a party vulnerable to exploitation [5]. When platform owners and algorithms control labour, as traced by the use of labour process theory, Chai and Scully [5] believe workers may not fully enjoy the freedoms the sharing economy implies, even if their engagement across time and place becomes freer.
While these studies shed light on flexible labour conditions and control mechanisms within ridesharing platforms, limited attention has been paid to how such changes affect drivers’ social well-being, satisfaction, or social identity, particularly in the context of developing countries.
2.2 Value creation and user engagement in digital ridesharing platforms
New values such as commitment, collaboration, ownership and social engagement may have never existed like this before among sharing-economy companies, partners and customers. In general, the sharing economy goes with new things, values, or co-values compared to the existing traditional business models [6].
The sharing economy can generate new attributes with new behaviours as a result of customers’ valuation of the services provided. With the rapid development of information technology, platform-facilitated collaborative consumption has become attractive to consumers. A comparative study of consumers’ online review behaviour and its impact on overall satisfaction and demand in the accommodation-sharing economy and the hotel industry indicates that consumers’ perceptions and behaviour change gradually with the level [7]. Greater participation in sharing moves consumer valuation away from tangible attributes toward experiential ones. At higher levels of sharing, people prioritize social interaction and perceived economic value more than at lower levels. Purchasing choices are also strongly influenced by transaction costs, particularly information search and acquisition.
The other values that are generated from the sharing economy in using assets to obtain income are more incentives for smaller partners and individuals by lowering regulatory barriers to entry. According to Ferreri and Sanyal [8], the discourse of ‘sharing’, connoting a convivial aspect to these practices, highlighting the opportunity for average families to make use of un- or under-utilized assets to supplement their income, not only seeks to maximize the appeal of these companies to ordinary citizens, but masks more complex arrangements that mark their profits.
2.3 Social perspectives and well-being in platform labour
Recent studies focus on how social job characteristics and algorithmic management affect the well-being of platform workers. Lin et al. [9] conduct in-depth interviews with 25 food delivery workers in China to discern the social job attributes of gig work and then empirically investigate the relationships between these attributes, off-the-job embeddedness, and workers’ well-being. They identify five social job characteristics and find that the relationships between these features and workers’ well-being vary across the dimensions of social job characteristics. Notably, social respectfulness, mutual trust, and interdependence influence well-being indirectly through off-the-job embeddedness, while platform support and recognition/feedback show no significant effect.
Similarly, Margerison et al. [10] conduct a scoping review of peer-reviewed studies from 2000 to 2024 and assess the size, depth, and rigor of empirical literature on platform-mediated gig work and health. The review emphasizes the need for more prospective data, validated physical and mental health measures, and attention to how algorithmic control, ratings, and surveillance influence worker health.
In a comparative study in Poland, Stachura-Krzyształowicz et al. [11] examine psychosocial working conditions and subjective well-being among platform workers, freelancers, and traditional employees. The analysis shows fundamental differences in the level of influence at work, development opportunities, and experiences of violent behavior. Although the study does not reveal major differences in overall well-being across groups, it creates a field for discussion on the importance of differentiating traditional and non-traditional employees.
In addition, Mbare et al. [12] explore the psychosocial risks of algorithmic management using the Job Demand-Control-Support model. Based on 30 interviews with platform food couriers in Finland, they find that algorithmic management has direct and indirect intertwined negative psychosocial influence on couriers. It increases work demands, decreases control, and limits support. The study confirms the model’s applicability and highlights the need for regulation to ensure a healthy work environment for digital labor.
While social perspectives such as well-being and satisfaction have become crucial indicators in digital labour studies, there remains a lack of empirical evidence focusing on how ridesharing drivers perceive their work-life balance, social engagement, and sense of community within the platform ecosystem. Despite highlighting the emergence of new value systems and community-oriented engagement in digital platforms, few studies have directly assessed how these values influence drivers’ personal and social satisfaction in the ridesharing context. Based on the theoretical framework and prior literature, the following hypotheses are proposed:
H1: The construct of new labour market in the ridesharing economy has a positive effect on the social perspectives of driver-partners.
H2: The construct of new values in the ridesharing economy has a positive effect on the social perspectives of driver-partners.
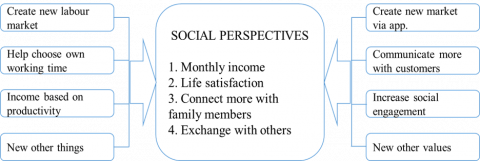
An approach combining literature review, quantitative data collection and statistical tests was used in this study. The first step presented a review of the current literature to single out measures that can enhance social perspectives regarding wages, job fulfillment and social inclusion of partners in the ridesharing economy. This section describes the method, statistical tests and structure of this study. The whole process is illustrated in Figure 1.
Figure 1. Theoretical framework for analyzing
3.1 Quantitative sampling and data collection
Quantitative data were collected through a nationwide survey conducted in 2020 across the South, North, and Central regions of Vietnam, where the Grab company provides pilot ridesharing to customers. The sampling process followed a combination of purposive and convenience techniques. Driver-partners were selected based on their current activity on the Grab platform and were required to have at least six months of driving experience to ensure their familiarity with the ridesharing work environment.
The questionnaires were pre-tested with 50 driver-partners before official distribution to ensure clarity, consistency, and ease of understanding. After final revision, two formats of the questionnaire—both printed and online—were distributed. Printed copies were delivered directly at Grab offices and driver hubs, while online forms were shared through social media groups and driver communities. This mixed approach facilitated broader access and increased participation.
Approximately 2,300 questionnaires were distributed, and 2,213 valid sets of responses were received, resulting in a response rate of over 96 percent. Among the respondents, 2,091 (94.49%) were male, 120 (5.52%) were female, and 2 (0.09%) identified as other. In terms of age, the largest group was between 30 and 34 years old (23.14%), followed by those aged 35 to 39 (19.79%) and 25 to 29 (17.98%). Regarding experience on the Grab platform, 31.19 percent of respondents had worked between one and two years, 22.94 percent had two to three years, and 18.18 percent had more than three years.
In addition to questions for demographic and descriptive purposes, a 5-point Likert scale was used for key questions to measure responses, where 5 was the highest score and 1 the lowest. The Likert scale is suitable for comparing among groups and is appropriate for use in structural equation models.
Although some participants did not answer every question, missing values were minimal and handled using listwise deletion in the modelling process. These omissions did not significantly affect the analysis results. Table 1 presents key demographic characteristics of the respondents.
Table 1. Demographic characteristics of the respondents
|
|
Item |
Frequency |
Percentage (%) |
||
|
Gender |
Male |
2,091 |
94.49 |
||
|
Female |
120 |
5.52 |
|||
|
Other |
2 |
0.09 |
|||
|
Age |
18-24 |
293 |
13.24 |
||
|
25-29 |
398 |
17.98 |
|||
|
30-34 |
512 |
23.14 |
|||
|
35-39 |
438 |
19.79 |
|||
|
40-44 |
245 |
11.07 |
|||
|
≥ 45 |
327 |
14.78 |
|||
|
Year of experience as a motorbike/ car partner |
≤ 0.5 |
248 |
123 |
12.96 |
20.85 |
|
0.5-1 |
282 |
57 |
14.73 |
9.66 |
|
|
1-2 |
597 |
145 |
31.19 |
24.58 |
|
|
2-3 |
439 |
132 |
22.94 |
22.37 |
|
|
≥ 3 |
348 |
133 |
18.18 |
22.54 |
|
Notes: Some respondents work both as motorbike and car partners for Grab company
3.2 Data cleaning and reliability analysis
Before modeling multi-equation structures, it is necessary to clean the data and delete outliers so that results from the statistical models are reliable sources of evidence for proposing suggestions. The cleaning process involved data inputting staff checking the answers as several respondents did not select the choices using the 1 to 5 scale properly. In some cases, if there were no responses from interviewees, inputted values were treated as missing. Firstly, exploratory factor analysis and principal component analysis were used to ensure the deletion of any items for which values did not reach the accepted level. Fortunately, the values of all exogenous and endogenous variables were higher than 0.4, so they were retained for modeling purposes, see Table A1 in the Appendix for more details.
To ensure the items in the models were suitable and reliable, Cronbach’s alpha was calculated. Cronbach’s alpha presents the reliability or internal consistency of each essential item and the whole set of latent variables. The accepted value of Cronbach’s alpha is from 0 to 1 and excellent values are at around 0.9, so the calculated values for the items in this study were within the permitted limits [13]. There were no items deleted as a result of this reliability test for three sets of latent variables. Cronbach’s alpha values for each item are shown in Table 2.
Table 2. Non-parametric analysis of observed indicators
|
Label |
Observed Items for Analysis |
Cronb. Alpha |
Kruskal-Wallis Chi-Squared Val. |
|
|
Social perspectives after joining as a Grab partner |
0.891 |
|
|
c151 |
Driver partner’s monthly income |
0.899 |
7.269 |
|
c152*** |
Job fulfillment, life satisfaction |
0.833 |
29.89 |
|
c153*** |
More connections with family members |
0.849 |
27.62 |
|
c154*** |
Exchanging more with relatives, friends or customers |
0.857 |
20.52 |
|
|
Grab has the advantage of creating new values compared to a traditional model |
0.969 |
|
|
c171*** |
Creating a new vibrant market via the application platform |
0.968 |
24.10 |
|
c172 |
Increasing efficiency of mobilizing partners’ idle private assets |
0.966 |
5.120 |
|
c173 |
Increasing efficiency of using partners’ idle private assets |
0.966 |
10.57 |
|
c174 |
Increasing efficiency of allocating idle private assets to customers |
0.966 |
6.363 |
|
c175 |
Connecting small businesses to reach new customers |
0.966 |
4.906 |
|
c176 |
Striving to maintain the commitment to be safer & better every day |
0.965 |
9.455 |
|
c177 |
Increasing partners' sharing with relatives and friends |
0.965 |
5.187 |
|
c178 |
Strengthening communication/connection of partner with customer |
0.964 |
8.901 |
|
c179*** |
Increasing social engagement through connection/sharing by the Grab community |
0.965 |
14.645 |
|
c1710 |
Creating new social links between Grab, partner and customer |
0.965 |
10.011 |
|
|
Grab has the advantage of creating a new labour market |
0.969 |
|
|
c181 |
Grab helps build a new flexible labour market |
0.966 |
20.576 |
|
c182 |
Grab has a partnership with a driver who has their own vehicle |
0.966 |
8.421 |
|
c183 |
Helping connect quickly between driver partner and customer via an application |
0.966 |
8.129 |
|
c184 |
Lowering the cost of entering the labour market for driver partner |
0.969 |
3.315 |
|
c185** |
Helping increase customers' trust of driver partner via application |
0.965 |
14.10 |
|
c186 |
Helping driver partner choose appropriate and suitable jobs |
0.965 |
9.150 |
|
c187 |
Helping driver partner do many things in the same day |
0.966 |
7.337 |
|
c188 |
Helping driver partner to be proactive about working time |
0.965 |
14.59 |
|
c189 |
Helping driver partner to be proactive about workplace |
0.965 |
5.739 |
|
c1810 |
Helping driver partner improve their income based on productivity |
0.965 |
2.995 |
Notes: The accepted value of Cronbach's alpha is 0.7. *** and ** response to significant levels of 1% and 5% in consequence
3.3 Kruskal-Wallis analysis
The Kruskal-Wallis test, similar to an analysis of variance test, was adopted to check whether the medians in different groups of driver partners were statistically significant at p< 5%. The results were used to determine whether partners in distinct groups responded differently to economic, social or behavioural changes after joining the ridesharing economy. As presented in Table 2, the Kruskal-Wallis chi-squared values show the significance of medians among items such as income, happiness level, connections and increased interaction with relatives, family members and friends or customers. Only three questions from the latent constructs of the new labour market and new values of the respondents’ medians were statistically significant at 1% and 5% (c171, c179 and c185). This means that most of the items within the two latent exogenous variables can be assessed in one measurement. However, further analysis on social views could be carried out for specific age groups partners with regard to income, happiness level or exchanging more with others.
3.4 Modeling structural equations
Structural Equation Modelling (SEM) is a multivariate technique suitable for testing relationships among latent constructs and observed variables. This study employed Covariance-Based SEM (CB-SEM) rather than Partial Least Squares SEM (PLS-SEM), based on both theoretical and statistical considerations. CB-SEM is more appropriate when the research objective is to confirm theory-driven hypotheses and test overall model fit using global goodness-of-fit indices [14, 15]. Given that our model is grounded in a well-defined conceptual framework—linking new labour dynamics and value systems to social perspectives—CB-SEM enables a rigorous assessment of model structure, error terms, and factor loadings. Moreover, the large sample size (n > 1300 after missing data exclusion) meets the assumption requirements for maximum likelihood estimation in CB-SEM, further justifying its use.
SEM is used with confirmatory factor analysis (CFA) to measure contributions and influences among indicators and constructs. Specifically, CFA was conducted to validate the measurement structure of the latent constructs within new values, the new labour market and social aspects relating to the self-estimation of partners. With CFA results, if any items have more influence than others, suggested implications would be proposed for further implications.
3.5 Model fitness
Unlike the technique of PLS-SEM, in which R squared is appropriate to manifest the goodness of a model, the results in CB-SEM are checked with several criteria, including Chi-Square, Root Mean Square Error of Approximation (RMSEA) and Comparative Fit Indices (CFI). Table 3 provides more information about these criteria calculated from the initial model and the final model. In this table, other indices such as AIC, BIC, Standardized Root Mean Square Residual (SRMR) or CD are also presented to measure the goodness of fit after running CFA and SEM.
Table 3. Model fit indices
|
|
Initial Model |
Final Model |
|
X2/ degree of freedom |
3545.531*** |
2735.693*** |
|
RMSEA |
0.062 |
0.051 |
|
90% CI, lower bound |
0.095 |
0.082 |
|
90% CI, upper bound |
0.101 |
0.088 |
|
AIC |
53511.433 |
52705.596 |
|
BIC |
53903.888 |
53108.516 |
|
CFI |
0.917 |
0.937 |
|
TLI |
0.908 |
0.930 |
|
SRMR |
0.033 |
0.032 |
|
CD |
0.998 |
0.998 |
Notes: *** denotes statistical significance probability with p < 0.001
Different indices are applied in checking the goodness of fit. The two most popular indices, which are commonly used to determine model suitability are RMSEA, which is preferred at intervals of 0.01 to 0.08 (0.08 to 0.1 represents a fairly good fit) and CFI or TLI, which should be close to 1, as shown by Chen et al. [16].
3.6 Hypothetical model
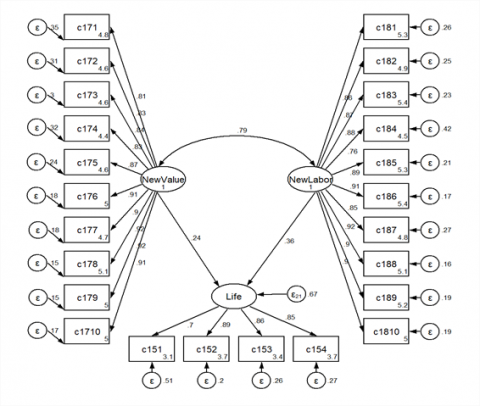
CFA was used to understand the two main latent variables and their impact on the social perspectives as an endogenous latent variable. Each of the two latent explanatory variables included ten items and the endogenous latent construct had four indicators. The directional coefficients between the two exogenous variables and the endogenous construct provide a foundation for interpreting their relationships. To signal an addition, Figure 2 illustrates the initial model of interactions among these items and constructs in which the first order includes three reflective measurements and the second order consists of specific items within the variables of new values, new labour market and social perspectives.
To improve model fit, two error covariances were added based on Modification Indices (MI) suggested by Stata. The first was between c172 and c173, both measuring perceived efficiency in utilizing idle private assets, which are conceptually and semantically related. The second was between c179 and c1710, which both reflect drivers’ social engagement and network formation through the platform. These covariances were theoretically justified and led to improved model fit indices in the final model.
Figure 2. Initial model of social perspectives and the ridesharing economy
3.7 Confirmatory factor analysis
CFA was used to measure the latent variables composing the indicators as scheduled. The total sample size was more than 2200, but the statistical program excluded missing cases. Thus, the observations in the models contained 1384. Maximum Likelihood technique and standardized results were reported in the final model, as shown in Table 4.
Table 4. Results of initial model hypothesis
|
|
Estimate |
S.E |
Z |
P-Value |
|
First-order CFA |
|
|
|
|
|
c171 < -- New values |
0.805 |
0.010 |
81.76 |
*** |
|
c172 < -- New values |
0.828 |
0.009 |
92.81 |
*** |
|
c173 < -- New values |
0.836 |
0.009 |
97.53 |
*** |
|
c174 < -- New values |
0.827 |
0.009 |
92.25 |
*** |
|
c175 < -- New values |
0.871 |
0.007 |
125.85 |
*** |
|
c176 < -- New values |
0.906 |
0.005 |
172.15 |
*** |
|
c177 < -- New values |
0.904 |
0.005 |
170.02 |
*** |
|
c178 < -- New values |
0.922 |
0.005 |
204.09 |
*** |
|
c179 < -- New values |
0.922 |
0.005 |
203.43 |
*** |
|
c1710 < -- New values |
0.910 |
0.005 |
177.41 |
*** |
|
c181 < -- New labour market |
0.862 |
0.007 |
118.32 |
*** |
|
c182 < -- New labour market |
0.866 |
0.007 |
121.21 |
*** |
|
c183 < -- New labour market |
0.878 |
0.007 |
133.69 |
*** |
|
c184 < -- New labour market |
0.763 |
0.012 |
65.58 |
*** |
|
c185 < -- New labour market |
0.889 |
0.006 |
146.24 |
*** |
|
c186 < -- New labour market |
0.911 |
0.005 |
182.38 |
*** |
|
c187 < -- New labour market |
0.853 |
0.008 |
110.84 |
*** |
|
c188 < -- New labour market |
0.917 |
0.005 |
194.29 |
*** |
|
c189 < -- New labour market |
0.902 |
0.005 |
165.18 |
*** |
|
c1810 < -- New labour market |
0.898 |
0.006 |
158.21 |
*** |
|
c151 < -- Social perspectives |
0.699 |
0.015 |
45.75 |
*** |
|
c152 < -- Social perspectives |
0.893 |
0.008 |
111.2 |
*** |
|
c153 < -- Social perspectives |
0.858 |
0.009 |
94.34 |
*** |
|
c154 < -- Social perspectives |
0.852 |
0.009 |
90.31 |
*** |
|
SEM |
|
|
|
|
|
Social perspectives <--New values |
0.245 |
0.041 |
6.02 |
*** |
|
Social perspectives <--New labour market |
0.364 |
0.040 |
9.05 |
*** |
|
Covariance |
|
|
|
|
|
New values & New labour market |
0.795 |
0.011 |
74.42 |
*** |
Notes: P – Significant probability; *** denotes statistical significance probability with p < 0.001
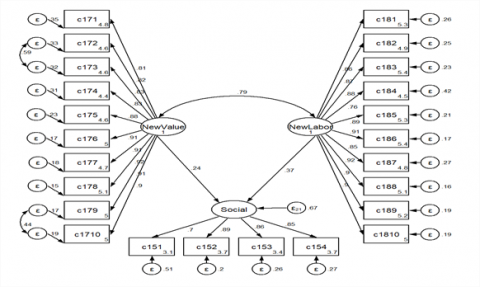
Improvement to the goodness of fit of the initial model was achieved through modifications made with suggestions from the statistical program by adding covariances between the error terms of the indicators. When adding these co-directions, this study carefully considered the theoretical links between items within new values, new labour market and social perspectives. Figure 3 illustrates the final results for indicators, latent variables and impacts, and Table 5 provides the results in detail, including estimates, standard errors, z values and significant signals.
Figure 3. Final model of social perspectives and the ridesharing economy
Table 5. Results of final model hypothesis
|
|
Estimate |
S.E |
Z |
P-Value |
|
First-order CFA |
|
|
|
|
|
c171 < -- New values |
0.805 |
0.010 |
81.31 |
*** |
|
c172 < -- New values |
0.817 |
0.009 |
86.74 |
*** |
|
c173 < -- New values |
0.826 |
0.009 |
91.18 |
*** |
|
c174 < -- New values |
0.829 |
0.009 |
92.76 |
*** |
|
c175 < -- New values |
0.878 |
0.007 |
132.28 |
*** |
|
c176 < -- New values |
0.912 |
0.005 |
180.46 |
*** |
|
c177 < -- New values |
0.907 |
0.005 |
172.04 |
*** |
|
c178 < -- New values |
0.922 |
0.005 |
201.43 |
*** |
|
c179 < -- New values |
0.910 |
0.005 |
175.76 |
*** |
|
c1710 < -- New values |
0.898 |
0.006 |
155.33 |
*** |
|
c181 < -- New labour market |
0.862 |
0.007 |
118.31 |
*** |
|
c182 < -- New labour market |
0.866 |
0.007 |
121.04 |
*** |
|
c183 < -- New labour market |
0.878 |
0.007 |
133.82 |
*** |
|
c184 < -- New labour market |
0.762 |
0.012 |
65.53 |
*** |
|
c185 < -- New labour market |
0.889 |
0.006 |
146.38 |
*** |
|
c186 < -- New labour market |
0.911 |
0.005 |
182.36 |
*** |
|
c187 < -- New labour market |
0.853 |
0.008 |
110.77 |
*** |
|
c188 < -- New labour market |
0.917 |
0.005 |
194.21 |
*** |
|
c189 < -- New labour market |
0.902 |
0.005 |
165.27 |
*** |
|
c1810 < -- New labour market |
0.897 |
0.006 |
158.17 |
*** |
|
c151 < -- Social perspectives |
0.699 |
0.015 |
45.73 |
*** |
|
c152 < -- Social perspectives |
0.893 |
0.008 |
111.13 |
*** |
|
c153 < -- Social perspectives |
0.858 |
0.009 |
94.37 |
*** |
|
c154 < -- Social perspectives |
0.852 |
0.009 |
90.33 |
*** |
|
SEM |
|
|
|
|
|
Social perspectives <--New values |
0.236 |
0.041 |
5.8 |
*** |
|
Social perspectives <--New labour market |
0.372 |
0.040 |
9.3 |
*** |
|
Covariance |
|
|
|
|
|
e.c172 & e.c173 |
0.018 |
|
31.96 |
*** |
|
e.c179 & e.c1710 |
0.025 |
|
17.92 |
*** |
|
New values & New labour market |
0.011 |
|
72.57 |
*** |
Notes: P – Significant probability; *** denotes statistical significance probability with p<0.001
Analyses of SEM for this study were divided into two parts. In the first part, 20 fundamental indicators were grouped into two primary constructs to hypothetically support the social perspectives, which were summed up with one endogenous variable. These results go beyond statistical associations to highlight a structural transformation in the experience and perception of platform-based labour. From the drivers’ viewpoint, ridesharing is not merely a mode of earning income but a reconfiguration of their work identity and social role. This section discusses these dimensions with reference to broader labour and value creation perspectives in the digital platform economy. In the second part, the final modified SEM explored how the two key constructs affected the social aspects under these estimations. The self-estimations from driver partners on their current living conditions were treated as the endogenous construct, a proxy for social perspectives, for several reasons.
The new business model has challenged the current traditional ridesharing services and some individuals operating under the old model have lost their jobs. The most important finding is that this new economic model has created more engagement and exchange among individuals who join the sharing economy. This is why the living conditions of driver partners after joining the digital ridesharing economy are treated as social perspectives.
Preliminary empirical results of the analysis include the covariance value and the contribution of each item to the variable of social perspectives. The covariance value between the new labour market and new values is relatively high and significant at 0.79, meaning there is a solid relationship between these two variables. From the social perspective, the aspect of job fulfillment/life satisfaction is the primary contributor to this construct with a value of 0.89. And via SEM, both the two latent constructs of new values and new labour market have significant impacts on the social perspectives: These results are discussed in detail, as shown in Table 5.
4.1 New values from the ridesharing economy
Table 5 shows the standardized regression weights of the constructs and their indicators of new values generated from the ridesharing economy of the Grab company in Vietnam. The construct of new values has a positive and significant contribution to the social perspectives. The items that best explain this construct are: Strengthening communication/connection of partner with customer (0.922); Striving to maintain the commitment to be safer and better every day (0.912); Increasing social engagement through connection/sharing with the Grab community (0.910); and Increasing partners' sharing with relatives and friends (0.907). These findings suggest that driver-partners are not just passive service providers but also active co-creators of value through repeated interactions and community building. This observation is aligned with Akhmedova et al. [17], who emphasize the role of peer providers in enhancing customer experience and loyalty on sharing economy platforms. The current study also demonstrates consistency with work by Buhalis et al. [18], who confirm that the sharing economy has made major inroads into the consumption of places and into the economic and social lives of people around the world. The rapid growth of the sharing economy increasingly reflects the complexity of the ecosystem by encouraging and facilitating visitors to engage in activities in residential areas, often adopting behavioural patterns that may not be suitable for the location and using resources that they are not entitled to.
As expected, this new business model has actualized many new values compared to traditional ride services, as noted by Nadeem et al. [6], who concluded that the ancient phenomenon of sharing has become mainstream and has transformed traditional consumer behaviour due to the proliferation of online sharing economy platforms. Using an empirical approach, the authors find that social support influences ethical perceptions, further influencing value co-creation. Ethical perceptions also influence consumers’ trust, satisfaction and commitment to sharing economy platforms.
The results indicate that after being a part of this business model, driver partners and customers have created new values compared to the traditional ride model. These values are identified as more communication or exchange of information, better relationships and more social engagement between drivers and customers when they both use this service platform. This aligns with observations in other sectors where newer models have outperformed traditional frameworks in terms of connectivity, efficiency, and user satisfaction [19]. In general, the ridesharing economy platform has influenced social perspectives, so governing rules and policies can be developed based on these empirical results.
4.2 New labour market from the ridesharing economy
Compared to the construct of new values, the new labour market has the strongest effect on the social perspectives, as shown in Table 5. The variables that best explain the new labour market construct are: Helping driver partners to be proactive about working time (0.917); Helping driver partners choose appropriate and suitable jobs (0.911); Helping driver partners to be proactive in the workplace (0.902); and Helping driver partners improve their income based on productivity (0.897).
While these indicators reflect a strong sense of control and flexibility, they may mask underlying dependencies on platform algorithms. Rosenblat and Stark [20] argue that the freedom offered by platforms like Uber is often constrained by opaque algorithmic management. In this study, such nuances may be less apparent due to contextual factors in Vietnam, including high labour informality and limited regulatory scrutiny. Another study by Nurvala [21] also confirms that the new people-to-people economy (P2PE) and the sharing economy provide opportunities for unskilled workers. In the P2PE framework, independent workers maintain full control over their labour. They also retain a larger share of earnings because no staffing agency is involved. As a result, this arrangement encourages more individuals to pursue self-employment and entrepreneurship.
From the results, it could be further inferred that the ridesharing economy, in the case of the Grab company in Vietnam, has created a new labour market in which employees can be more proactive in joining the market. Employees in this labour market can determine their own working times, which is much more suitable for them in the role of a partner in this business model. Through SEM, this new labour market generated from the ridesharing economy has significantly affected social perspectives. With this finding, governing authorities and policymakers can issue regulations to ensure that this new labour market can support social aspects with positive outcomes.
Taken together, these findings offer a more nuanced view of how platform labour is perceived in an emerging economy. Unlike prior studies, which tend to focus on risks of precarity or algorithmic control, this research shows that under specific social and economic conditions, drivers can derive positive social value and identity from their platform participation. Similar insights were emphasized in Bahman et al. [22], who demonstrated how data-driven evaluations of emerging sectors could inform policy frameworks for sustainability and equity. This highlights the need for context-sensitive interpretations and policies when addressing digital labour markets in developing regions.
5.1 Summary findings and contributions
This study examined the social impacts of ridesharing platforms on urban transport labour by focusing on two key constructs: the emergence of new labour market characteristics and the formation of new value systems. Using CB-SEM on survey data from over 2,200 Grab driver-partners in Vietnam, the findings revealed that both constructs have a significant and positive effect on drivers' social perspectives, including their perceived well-being, connection with others, and sense of professional identity.
The results suggest that digital labour platforms not only reshape employment structures by enabling autonomy and flexibility but also facilitate new forms of value co-creation and community engagement. These insights contribute to the growing body of literature on platform economies, particularly by highlighting social dimensions that extend beyond economic outcomes. The study also adds empirical evidence from a developing country context, where limited research has focused on the lived experiences of ridesharing workers.
From a practical standpoint, the findings have implications for policymakers and platform managers. Policy frameworks should recognize platform workers as a distinct labour group with evolving needs, including access to training, digital tools, and forms of social protection. Platforms may consider supporting driver communities and improving engagement practices to sustain satisfaction and long-term retention. Furthermore, insights from this study can inform the development of labour codes and smart mobility strategies that align with inclusive and sustainable urban growth.
5.2 Limitations and future research directions
This study has several limitations. First, the research was conducted in the specific context of Vietnam, where labour laws, cultural norms, and platform development differ from other regions. Second, the analysis was based on cross-sectional data, which may not capture evolving perceptions over time. Third, the study focused solely on Grab drivers, excluding other platform types or service models. Future research should explore longitudinal perspectives, comparative studies across countries, or qualitative approaches to better understand driver narratives and hidden forms of control or stress.
Despite these limitations, the study provides valuable insights into how platform work reshapes social experiences in urban transport, offering a foundation for further academic inquiry and informed policy design.
Table A1. Exploratory factor analysis and principal component analysis
|
Label |
Measures |
Factor Loadings |
Eigenvalue |
CR |
AVE |
|
|
Social perspectives after joining as a Grab partner |
|
|
0.922 |
0.750 |
|
c151 |
Driver partners' monthly income |
0.79 |
3.03 |
|
|
|
c152 |
Job fulfillment, life satisfaction |
0.91 |
0.50 |
|
|
|
c153 |
More connections with family members |
0.89 |
0.25 |
|
|
|
c154 |
Exchanging more with relatives, friends or customers |
0.87 |
0.22 |
|
|
|
|
Grab has the advantage of creating new values compared to a traditional model |
|
|
0.973 |
0.782 |
|
c171 |
Creating a new vibrant market via the application platform |
0.83 |
7.82 |
|
|
|
c172 |
Increasing efficiency of mobilizing idle private assets from partner |
0.87 |
0.60 |
|
|
|
c173 |
Increasing efficiency of using idle private assets from partner |
0.87 |
0.38 |
|
|
|
c174 |
Increasing efficiency of allocating idle private assets to customer |
0.87 |
0.32 |
|
|
|
c175 |
Connecting small businesses to reach new customers |
0.89 |
0.20 |
|
|
|
c176 |
Striving to keep the commitment to be safer & better every day |
0.90 |
0.18 |
|
|
|
c177 |
Increasing partners' sharing with relatives and friends |
0.90 |
0.16 |
|
|
|
c178 |
Strengthening communication/connection of partner with customer |
0.91 |
0.12 |
|
|
|
c179 |
Increasing social engagement through connection/sharing by the Grab community |
0.91 |
0.12 |
|
|
|
c1710 |
Creating new social links among Grab, partner and customer |
0.89 |
0.10 |
|
|
|
|
Grab has the advantage of creating a new labour market |
|
|
0.973 |
0.786 |
|
c181 |
Grab helps build a new flexible labour market |
0.88 |
7.85 |
|
|
|
c182 |
Grab has a partnership with a driver who has own vehicle |
0.88 |
0.44 |
|
|
|
c183 |
Helping connect quickly between driver partner and customer via application |
0.89 |
0.38 |
|
|
|
c184 |
Lowering the cost of entering the labour market for driver partner |
0.80 |
0.27 |
|
|
|
c185 |
Helping increase customers' trust on driver partner via application |
0.90 |
0.23 |
|
|
|
c186 |
Helping driver partner choose the right and suitable job |
0.92 |
0.20 |
|
|
|
c187 |
Helping driver partner do many things in the same day |
0.87 |
0.19 |
|
|
|
c188 |
Helping driver partner be proactive about working time |
0.91 |
0.15 |
|
|
|
c189 |
Helping driver partner be proactive about workplace |
0.91 |
0.14 |
|
|
|
c1810 |
Helping driver partner improve their income based on productivity |
0.90 |
0.14 |
|
|
Notes: CR and AVE stand for the Composite Reliability (CR) and Average Variance Extracted
[1] Li, Z., Hong, Y., Zhang, Z. (2021). The empowering and competition effects of the platform-based sharing economy on the supply and demand sides of the labor market. Journal of Management Information Systems, 38(1): 140-165. https://doi.org/10.1080/07421222.2021.1870387
[2] Caliendo, M., Tübbicke, S. (2022). Do start-up subsidies for the unemployed affect participants’ well-being? A rigorous look at (Un-)Intended consequences of labor market policies. Evaluation Review, 46(5): 517-554. https://doi.org/10.1177/0193841X20927237
[3] Hua, J., Ray, K. (2022). Beyond the precariat: Race, gender, and labor in the taxi and Uber economy. Social Identities, 24(2): 271-289. https://doi.org/10.1080/13504630.2017.1321721
[4] Wu, Q., Li, Z. (2019). Labor control and task autonomy under the sharing economy: A mixed-method study of drivers’ work. The Journal of Chinese Sociology, 6(1): 14. https://doi.org/10.1186/s40711-019-0098-9
[5] Chai, S., Scully, M.A. (2019). It’s about distributing rather than sharing: Using labor process theory to probe the “sharing” economy. Journal of Business Ethics, 159(4): 943-960. https://doi.org/10.1007/s10551-019-04210-y
[6] Nadeem, W., Juntunen, M., Shirazi, F., Hajli, N. (2020). Consumers’ value co-creation in sharing economy: The role of social support, consumers’ ethical perceptions and relationship quality. Technological Forecasting and Social Change, 151: 119786. https://doi.org/10.1016/j.techfore.2019.119786
[7] Xu, X. (2020). How do consumers in the sharing economy value sharing? Evidence from online reviews. Decision Support Systems, 128: 113162. https://doi.org/10.1016/j.dss.2019.113162
[8] Ferreri, M., Sanyal, R. (2018). Platform economies and urban planning: Airbnb and regulated deregulation in London. Urban Studies, 55(15): 3353-3368. https://doi.org/10.1177/0042098017751982
[9] Lin, P.M., Au, W.C.W., Baum, T., Xia, S.J. (2025). Effects of social job characteristics on gig workers’ well-being: The mediating role of off-the-job embeddedness. International Journal of Hospitality Management, 130: 104241. https://doi.org/10.1016/j.ijhm.2025.104241
[10] Margerison, C.E., Joachim, G.E., Michling, T.R., Johnson, C.Y. (2025). Platform-mediated gig work and health: A scoping review. American Journal of Industrial Medicine, 68(9): 729-739. https://doi.org/10.1002/ajim.70007
[11] Stachura-Krzyształowicz, A., Żołnierczyk-Zreda, D., Barańska, P. (2024). Psychosocial working conditions and subjective well-being amongst platform workers compared to freelancers and traditional workers in Poland. International Journal of Occupational Safety and Ergonomics, 30(4): 1087-1096. https://doi.org/10.1080/10803548.2024.2402618
[12] Mbare, B., Perkiö, M., Koivusalo, M. (2024). Algorithmic management, wellbeing and platform work: understanding the psychosocial risks and experiences of food couriers in Finland. Labour and Industry, 34(4): 386-411. https://doi.org/10.1080/10301763.2024.2423442
[13] Taber, K.S. (2018). The use of Cronbach’s alpha when developing and reporting research instruments in science education. Research in Science Education, 48(6): 1273-1296. https://doi.org/10.1007/s11165-016-9602-2
[14] Hair, J.F. (2011). Multivariate data analysis: An overview. In International Encyclopedia of Statistical Science. Springer, Berlin, Heidelberg, pp. 904-907. https://doi.org/10.1007/978-3-642-04898-2_395
[15] Kline, R.B. (2015). Principles and practice of structural equation modeling, Fourth Edition. Guilford Publications. https://books.google.com.vn/books?id=Q61ECgAAQBAJ.
[16] Chen, Y.Q., Zhang, Y.B., Liu, J.Y., Mo, P. (2012). Interrelationships among critical success factors of construction projects based on the structural equation model. Journal of Management in Engineering, 28(3): 243-251. https://doi.org/10.1061/(ASCE)ME.1943-5479.0000104
[17] Akhmedova, A., Mas-Machuca, M., Marimon, F. (2022). ‘I get my income from sharing.’ Modelling satisfaction of peer service providers on capital and labour sharing economy platforms. Journal of Hospitality and Tourism Management, 51: 452-461. https://doi.org/10.1016/j.jhtm.2022.05.002
[18] Buhalis, D., Andreu, L., Gnoth, J. (2020). The dark side of the sharing economy: Balancing value co-creation and value co-destruction. Psychology & Marketing, 37(5): 689-704. https://doi.org/10.1002/mar.21344
[19] Chen, Y., Kisselyova, O., Abzhapbarova, A., Aliakbarkyzy, D., Karsybayev, Y. (2025). Comparing intermodal and synchromodal transport systems to enhance efficiency and sustainability at the port of Aktau, Kazakhstan. International Journal of Transport Development and Integration, 9(2): 217-225. https://doi.org/10.18280/ijtdi.090201
[20] Rosenblat, A., Stark, L. (2016). Algorithmic labor and information asymmetries: A case study of Uber’s drivers. International Journal of Communication, 10: 27. https://doi.org/10.2139/ssrn.2686227
[21] Nurvala, J.P. (2015). ‘Uberisation’is the future of the digitalised labour market. European View, 14(2): 231-239. https://doi.org/10.1007/s12290-015-0378-y
[22] Bahman, N., Abahussain, A., Khan, E., Mahmood, T., Shaker, M. (2025). Integrated environmental assessment of aviation activities in the Kingdom of Bahrain. International Journal of Transport Development and Integration, 9(2): 239-247. https://doi.org/10.18280/ijtdi.090203