Siti Malkhamah*![]() | Latif Budi Suparma
| Latif Budi Suparma![]() | Novita Sari
| Novita Sari![]()
© 2025 The authors. This article is published by IIETA and is licensed under the CC BY 4.0 license (http://creativecommons.org/licenses/by/4.0/).
OPEN ACCESS
This research aims to analyze the existing vehicle speeds on a primary arterial road and to implement speed management on road segments to improve road safety. This study utilizes secondary data collected from local Police accident reports over the four preceding years (2019-2022). A road inventory survey was conducted to determine road characteristics. Traffic count surveys and spot speed surveys were used to obtain traffic characteristics. Existing speeds were analyzed using the 85th percentile speed, which reflects the operating speed of the majority of drivers. Subsequently, the 85th percentile speed was benchmarked against Indonesia’s Minister of Transportation Regulation No. PM 111/2015. A Chi-square analysis was used to test the influence of vehicle speed on the fatality rate of traffic accident victims. The results of the Chi-square test indicated a significant relationship between vehicle speed and the fatality rate of traffic accident victims on the Jalan Raya Anyer. To improve road safety, speed control was implemented through the installation of signs and markings, particularly in accident-prone areas. The installation of speed limit signs is proposed in areas with educational, commercial, and residential activities. To enhance effectiveness, speed limit signs are installed repeatedly at a distance of 35 m between signs. The results of this research can contribute to the development of more effective policies and strategies to improve traffic safety on primary arterial roads, particularly in terms of speed management.
primary arterial roads, speed management, sustainable cities and settlements, road user safety
1.1 Background
Traffic accidents are one of the major problems in many countries, including Indonesia. Road accidents not only cause significant material losses but also result in serious injuries and loss of life [1]. Vehicle speed is one of the most frequently associated factors with traffic accidents [2-4]. According to Sari et al. [5] and Turner et al. [6], vehicle speed can increase the fatality rate for collision victims.
Primary arterial roads, as part of the main transportation system, play a vital role in community mobility and the distribution of goods [7, 8]. However, some of these primary arterial roads are sites of traffic accidents [9-11]. Researchers often find that vehicle speeds exceeding the speed limit contribute to accidents on primary arterial roads [3, 12-19]. These vehicle speeds can lead to reduced driver reaction time, increased braking distance, and increased collision impact.
Traffic accidents on primary arterial roads have continued to increase in recent years, according to data from Korlantas POLRI. Studies conducted by various researchers show that there is a significant correlation between vehicle speed and accident rates [20-23]. According to WHO data [24], an increase in average speed of 1 km/h can increase accident risk by 3% to 5%.
Jalan Raya Anyer in Serang Regency, Banten Province, is one of the primary arterial roads that plays an important role in connecting various areas around Serang Regency with the Anyer beach area, which is known as a popular tourist destination. Jalan Raya Anyer is an accident-prone area, according to Cilegon City Police data. In 2019-2022, there were 48 traffic accidents on this road section. Of the 48 accidents in the last four years, 22% of traffic accident victims died, 19% suffered serious injuries, and 59% suffered minor injuries. The speed analysis revealed that 83% of vehicles on this road exceed the allowed speed limit. According to previous studies [5, 6, 25-27], vehicle speed affects the fatality rate of collision victims. According to the data from the inventory survey of road sections in 2023, this particular road section does not have any speed limit signs.
1.2 Problem statement
Based on the background provided, the following points outline the research problem statement:
1.3 Research objectives
This study aims to analyze the effect of vehicle speed on traffic accidents on primary arterial roads and conduct speed management on road sections to improve road safety. This study expects the traffic accident and vehicle speed data to offer a deeper understanding of the correlation between speed and traffic accidents.
Given the current issues, a comprehensive research strategy is required to reduce the frequency and fatality rate of traffic accidents resulting from speed limit violations on primary arterial roads. This study's design incorporates the following problem-solving approaches:
The goal of this study is to identify and understand the theories and previous research findings relevant to vehicle speed and traffic accidents. This involved conducting a literature review to gather information on the relationship between vehicle speed and traffic accidents. It then reviewed existing traffic policies and regulations related to speed limits on primary arterial roads.
Empirical data is used to analyze the effect of vehicle speed on traffic accidents. Both primary and secondary data are required.
Perform a descriptive analysis to describe the characteristics of accident and vehicle speed data. Conduct statistical testing to test the hypothesis and determine whether vehicle speed has a significant effect on crashes. Analyze other factors that may influence crashes, such as road conditions, weather, and driver behavior.
Develop policy recommendations and interventions that can reduce traffic accidents due to vehicle speed on primary arterial roads.
1.4 Research limitations
Traffic accident data sourced from the police, while being the primary source of information, has several limitations that need to be considered in analysis:
Despite its limitations, police accident data remains a highly valuable source for understanding traffic accident patterns and trends. To address these limitations, additional analysis is needed, particularly to obtain vehicle speed data in accident-prone areas.
Traffic accidents represent multifaceted issues shaped by human behavior, vehicle conditions, infrastructure, and environmental factors. Prior research consistently emphasizes the dominant role of human error, while also recognizing the influence of systemic and contextual variables. This review outlines the prevailing trends and key determinants of traffic accidents as established in the existing literature.
2.1 Traffic accident trends
Traffic accidents are multifactorial events influenced by various elements, primarily human factors, but also vehicle conditions, road infrastructure, and environmental conditions [5, 27, 28]. The following is a synthesis of the key factors contributing to traffic accidents, based on the reviewed abstracts:
Human factors are the most significant contributors to traffic accidents, followed by vehicle conditions, road infrastructure, and environmental factors [27]. Addressing these issues through improved driver education, vehicle maintenance, road design, and traffic management can significantly reduce the incidence and severity of traffic accidents. Table 1 presents a synthesis of the key factors contributing to traffic accidents, as identified in the reviewed abstracts.
Table 1. Factors causing traffic accidents
|
Factor |
Elements |
Literature |
|
Human |
Speeding, aggressive driving, alcohol consumption, inexperience, and fatigue |
[27, 29-34] |
|
Vehicle |
Technical defects, vehicle age, and collision types |
[30, 35, 36] |
|
Road and Environmental |
Poor road conditions, adverse weather, and complex traffic environments |
[3, 4, 17, 18, 21, 37, 38] |
Traffic accidents constitute unforeseen and unplanned events occurring on roadways, involving vehicles with or without other road users, resulting in casualties (human) and/or material losses [39]. Philosophically, accidents are infrequent, random occurrences involving multiple interacting factors (multi-factorial) due to the interplay of several variables. Fundamentally, the primary components of road traffic comprise three key elements: road users/humans, vehicles, and the road infrastructure. These three components exhibit distinct characteristics for each road segment location and can all contribute to the occurrence of traffic accidents. Consequently, understanding the characteristics of these three primary components is crucial for conducting identification and analysis of traffic characteristics within land use contexts, ultimately aiming to enhance road traffic safety [40, 41].
2.2 Effect of vehicle speed on traffic accidents
Vehicle speed is a critical factor influencing both the likelihood and severity of traffic accidents. Higher speeds are directly correlated with an increased risk of collisions, as they reduce the time available for drivers to react to hazards and increase stopping distances. The severity of injuries sustained in traffic accidents also escalates with increasing speed. For instance, a 5% reduction in average vehicle speed can lead to an estimated 18.5% decrease in traffic fatalities [42]. This relationship is especially significant in pedestrian-related accidents, where even small increases in speed can result in substantially worse injury outcomes [41]. The risk of serious injury rises with impact speed across various types of crashes. In the study by Doecke et al. [43], the probability of sustaining a serious injury in a head-on collision reaches 1% at an impact speed of 28 km/h, while for side-impact collisions, this same risk level is reached at 51 km/h.
Implementing and enforcing speed limits is a key strategy for reducing the incidence and severity of traffic accidents. Research indicates that increasing speed limits, particularly on rural interstates, can lead to higher fatality rates [44]. Physical interventions such as speed bumps, roundabouts, and lane narrowing have been shown to effectively reduce vehicle speeds, thereby lowering both the frequency and severity of accidents [42].
Environmental conditions also play a significant role in safe speed determination. Adverse weather, such as fog, necessitates lower driving speeds to maintain safety. Dynamic speed limits that adjust based on weather conditions can help reduce accident risks [35, 45]. In addition, vehicle-related factors, such as engine capacity, vehicle type, and age affect accident severity. Vehicles with higher engine capacities and older vehicles are associated with a greater likelihood of severe crashes [36].
In conclusion, managing vehicle speed is essential to improving road safety. Reducing vehicle speeds not only decreases the likelihood of crashes but also mitigates the severity of injuries when they occur. The development and implementation of effective speed management strategies accounting for environmental conditions and supported by technological innovations are vital to achieving safer roads. By understanding the multifaceted role of speed in traffic accidents, policymakers and road safety professionals can design more effective interventions to reduce traffic injuries and fatalities.
2.3 Speed management
The implementation of appropriate speed limits is an integral component of the Safe System approach to improving road safety. Speed significantly influences both the likelihood of a collision and the severity of its consequences [6, 20, 22, 46]. The predominant cause of traffic accidents is often attributed to human factors, particularly non-compliance with speed limits [25]. Therefore, reducing vehicle speed is one of the key factors contributing to enhanced road safety [47]. According to Noesaku et al. [26], safety factors and impact speed serve as measurable indicators of both the likelihood and consequences of accidents and are recommended as central elements in improving traffic risk management strategies. The Safe System approach emphasizes minimizing harm as its core philosophy in determining speed limits. Consequently, driver speed selection plays a crucial role in the development of a safer road system. Speed management involves a variety of approaches that can be categorized as follows:
Effective speed management requires a comprehensive and integrated approach, involving a range of strategies and collaboration among government authorities, law enforcement agencies, civil society organizations, and the general public.
This study utilizes secondary data gathered from the last four years of traffic accident records. Secondary data collected from local Police accident reports over the four preceding years (2019-2022). The primary data was collected by conducting road inventory surveys, traffic counting surveys, and vehicle spot speed surveys. A road inventory survey was conducted to determine road characteristics. Traffic count surveys and spot speed surveys were used to obtain traffic characteristics. Existing speeds were analyzed using the 85th percentile speed, which reflects the operating speed of the majority of drivers. The following analysis is used:
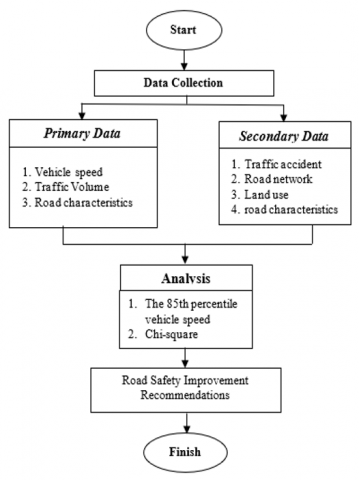
The results of this study will aid in the creation of more effective policies and strategies to enhance traffic safety on primary arterial roads, particularly in the area of speed management. To conduct this research, a systematic methodology comprising several stages was developed. These stages are presented in Figure 1.
Figure 1. Research stage
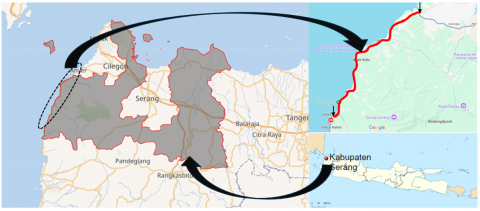
3.1 Study area
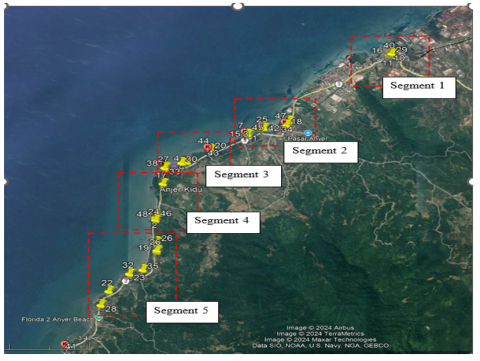
The location of this research is Serang Regency in the province of Banten, Indonesia. The district is headquartered in Ciruas Subdistrict, which is located at the northwestern tip of the island of Java. Its area is 1,467.35 km2. Serang Regency consists of 29 sub-districts and 326 villages with a density of 1,146 people/km2. Jalan Raya Anyer is one of the roads included in the accident-prone areas in Serang Regency. Figure 2 shows the research location.
Figure 2. Research location
3.2 Data collection and analysis
3.2.1 Data collection
This study utilizes secondary data obtained from traffic accident records over the past four years. Primary data were collected through road inventory surveys, traffic volume counts, and spot speed surveys. Table 2 outlines the types of data used in the study, along with their sources and methods of collection.
Table 2. Data collection
|
No. |
Data Sources |
Type of Data |
|
1 |
Police department |
Traffic accident data |
|
2 |
The Geospatial Information Agency and the Provincial or Regency Office of Spatial Planning and Land Affairs |
Road network, road classifications, land use, road length, and road width |
|
3 |
Road inventory survey |
Road length, width, roadside hazards, traffic signs, road markings, as well as intersection conditions, and accessibility |
|
4 |
Vehicle speed survey |
Vehicle speed |
|
5 |
Traffic counting survey |
Traffic volume, road capacity, V/C ratio |
Traffic accident data from Jalan Raya Anyer (2019-2022) were obtained from the Cilegon City Police Department. Based on the accident chronologies, the characteristics of the traffic accidents were identified. During this period, a total of 48 traffic accidents were recorded, with 22% of the victims suffering fatal injuries, 19% sustaining serious injuries, and 59% experiencing minor injuries. An analysis of the vehicle types involved in the accidents shows that 73% of the cases involved motorcycles, whereas 27% involved light vehicles. The detailed characteristics of the traffic accidents are presented in Table 3.
Table 3. Types of collisions in traffic accidents
|
Year |
Number of Events |
Type of Collision |
|||
|
Head-on Collision |
Side Collision |
Rear-End Collision |
T-Bone Collision |
||
|
2019 |
10 |
3 |
4 |
2 |
2 |
|
2020 |
9 |
4 |
1 |
1 |
3 |
|
2021 |
13 |
6 |
3 |
3 |
1 |
|
2022 |
16 |
8 |
7 |
0 |
0 |
|
Total |
48 |
21 |
15 |
6 |
6 |
Data from the road network provides information on the structure of national, provincial, and district roads within Serang Regency, along with corresponding land use data. The road network data used in this study includes road dimensions (length and width), road classifications, and roadside infrastructure. Land use data for the study area were also obtained and analyzed. These data were sourced from the Geospatial Information Agency and the Provincial or Regency Office of Spatial Planning and Land Affairs.
Field-obtained road inventory data include road length, width, roadside hazards, traffic signs, road markings, as well as intersection conditions and accessibility. The road inventory survey also provides road capacity estimates. The volume-to-capacity (V/C) ratio for each road section is then calculated by dividing the traffic volume (in pcu/hour) by the road capacity.
Vehicle speed surveys gather data on the current speed of vehicles at a specific point within the studied section. This survey employs a speed gun tool to determine the average vehicle speed at a specific point within the studied section.
Traffic volume is the total number of vehicles that cross a location or road segment in a certain period of time [50]. These vehicles are categorized into several groups, such as heavy vehicles (HV), light vehicles (LV), motorcycles (MC), and non-motorized vehicles.
3.2.2 Vehicle speed analysis
Vehicle speed analysis using 85th percentile speed is a commonly used method to understand vehicle speed patterns within an area, particularly to identify appropriate speed limits for safety [16, 39, 52]. The spot speed method gathers speed data by measuring the actual speed of multiple vehicles at a specific location. Furthermore, the 85th percentile speed is used as a basis for determining speed requirements in accordance with the guidelines. Table 4 outlines the speed limits determined based on the surrounding land use listed in the Minister of Transportation Regulation No. 111 of 2015.
This data was used to determine the speed at the 85th percentile. Using the 85th percentile speed as a guideline for speed limits can also reduce the number of violations, increase driver compliance, and potentially reduce the risk of accidents, as the limits set are more in line with the actual speeds adopted by motorists.
Table 4. Maximum vehicle speed by land use
|
No. |
Land Use |
Speed |
|
1 |
Education |
1. Maximum 30 km/h during school entry and dismissal hours 2. Maximum 80 km/h for motorized vehicles 3. Maximum 60 km/h for motorcycles |
|
2 |
Residential |
Maximum 40 km/h |
|
3 |
Commercial |
Maximum 40 km/h |
3.2.3 Chi-square analysis
Chi-square analysis is a statistical method that examines the relationship between two categorical variables. To determine the relationship between vehicle speed and traffic crashes, Chi-square analysis is an effective method, especially when data on vehicle speed (e.g., “high” or “low” categories) and traffic crashes (e.g., “no crash” or “no crash”) are available as categorical data.
The confidence level in this Chi-square test is 95%, or a = 5%. The Chi-square value obtained is compared with the critical value of the Chi-square at the set significance level (e.g., 0.05) and the corresponding df. If the Chi-square value is greater than the critical value, then the null hypothesis is rejected. Based on the results of the Chi-square test and the corresponding significance value, the analysis yields the following conclusions:
4.1 Road characteristics
Road characteristics refer to various physical and functional aspects of roads that impact their role in traffic safety. The road characteristics of the studied area were obtained through an inventory survey of road segments.
Road segments are classified based on the uniformity of geometric characteristics, traffic characteristics, roadside land use, and accident-prone area (Blackspot) [53-55]. A road segment is considered homogeneous if it has relatively consistent geometric elements, such as horizontal and vertical alignments. Meanwhile, the land use characteristics around the road (e.g., residential, commercial, industrial) can influence traffic characteristics. Furthermore, road segmentation also takes into account segments with a high history of traffic accidents [56]. The Jalan Raya Anyer under study spans 19 KM, so to facilitate data collection, this road is divided into five segments based on the locations of traffic accidents. Tables 5-9 present the road characteristics based on the results of the road inventory survey.
Table 5. Road characteristics Segment 1
|
Road Characteristics |
|||
|
Road classification |
Status |
National |
|
|
Function |
Arterial |
||
|
Road length |
(m) |
5,560 |
|
|
Road width |
(m) |
7.8 |
|
|
Road type |
2/2UD |
||
|
Traffic lane width |
(m) |
7 |
|
|
Lane |
Left |
(m) |
3.5 |
|
Right |
(m) |
3.5 |
|
|
Road shoulder |
Left |
(m) |
0.4 |
|
Right |
(m) |
0.4 |
|
|
Drainage |
Left |
(m) |
- |
|
Right |
(m) |
- |
|
|
Pavement condition |
|
|
good |
|
Pavement type |
Flexible |
||
|
Road markings |
Less obvious (faded) |
||
|
Land use |
Commercial |
||
Table 6. Road characteristics Segment 2
|
Road Characteristics |
|||
|
Road classification |
Status |
National |
|
|
Function |
Arterial |
||
|
Road length |
(m) |
2,430 |
|
|
Road width |
(m) |
7 |
|
|
Road type |
2/2 UD |
||
|
Traffic lane width |
(m) |
7 |
|
|
Lane |
Left |
(m) |
3.5 |
|
Right |
(m) |
3.5 |
|
|
Road shoulder |
Left |
(m) |
1 |
|
Right |
(m) |
1.5 |
|
|
Drainage |
Left |
(m) |
- |
|
Right |
(m) |
- |
|
|
Pavement condition |
|
|
good |
|
Pavement type |
Flexible |
||
|
Road markings |
Less obvious (faded) |
||
|
Land use |
Commercial |
||
Table 7. Road characteristics Segment 3
|
Road Characteristics |
|||
|
Road classification |
Status |
National |
|
|
Function |
Arterial |
||
|
Road length |
(m) |
3,250 |
|
|
Road width |
(m) |
7 |
|
|
Road type |
2/2 UD |
||
|
Traffic lane width |
(m) |
7 |
|
|
Lane |
Left |
(m) |
3.5 |
|
Right |
(m) |
3.5 |
|
|
Road shoulder |
Left |
(m) |
1 |
|
Right |
(m) |
1 |
|
|
Drainage |
Left |
(m) |
- |
|
Right |
(m) |
- |
|
|
Pavement condition |
|
|
good |
|
Pavement type |
Flexible |
||
|
Road markings |
Less obvious (faded) |
||
|
Land use |
Commercial |
||
Table 8. Road characteristics Segment 4
|
Road Characteristics |
|||
|
Road classification |
Status |
National |
|
|
Function |
Arterial |
||
|
Road length |
(m) |
3,270 |
|
|
Road width |
(m) |
7 |
|
|
Road type |
2/2 UD |
||
|
Traffic lane width |
(m) |
7 |
|
|
Lane |
Left |
(m) |
3.5 |
|
Right |
(m) |
3.5 |
|
|
Road shoulder |
Left |
(m) |
1.5 |
|
Right |
(m) |
1.5 |
|
|
Drainage |
Left |
(m) |
- |
|
Right |
(m) |
- |
|
|
Pavement condition |
|
|
good |
|
Pavement type |
Flexible |
||
|
Road markings |
Less obvious (faded) |
||
|
Land use |
Commercial & softland |
||
Table 9. Road characteristics Segment 5
|
Road Characteristics |
|||
|
Road classification |
Status |
National |
|
|
Function |
Arterial |
||
|
Road Length |
(m) |
4,440 |
|
|
Road width |
(m) |
7 |
|
|
Road type |
2/2 UD |
||
|
Traffic lane width |
(m) |
7 |
|
|
Lane |
Left |
(m) |
3.5 |
|
Right |
(m) |
3.5 |
|
|
Road shoulder |
Left |
(m) |
0.5 |
|
Right |
(m) |
0.5 |
|
|
Drainage |
Left |
(m) |
- |
|
Right |
(m) |
- |
|
|
Pavement condition |
|
|
good |
|
Pavement type |
Flexible |
||
|
Road markings |
Less obvious (faded) |
||
|
Land use |
Commercial |
||
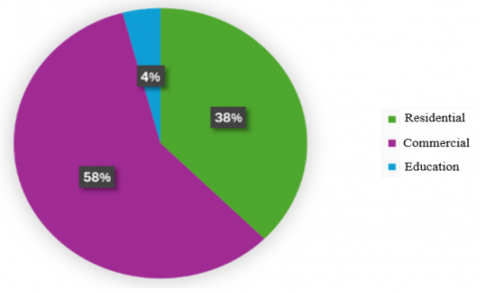
Based on the road characteristics, the width of Jalan Raya Anyer does not yet meet the standard [54]. The general condition of the road pavement is good. Figure 3 explains the percentage of land use around the Jalan Raya Anyer. Along Raya Anyer Road, commercial areas are dominated by resorts, offices, and trading areas.
Figure 3. Percentage of land use around the accident site
The analysis revealed that 58% of traffic accidents on the Raya Anyer road section occurred in commercial areas. Additionally, 38% took place in residential areas, while only 4% occurred near educational areas.
4.2 Road characteristics
The Passenger Car Unit (PCU) value is determined based on the type of vehicle. PCU is a standardized unit used in traffic engineering to express the impact of different vehicle types on traffic flow relative to a standard passenger car. It allows heterogeneous traffic, consisting of vehicles of varying sizes and operational characteristics, to be converted into a common unit for more accurate analysis and comparison. The PCU value is based on each type of vehicle. Traffic volume is calculated by Eq. (1):
$V=D . S$ (1)
V is traffic volume (pcu/hour), D is density (pcu), and S is speed (km/h). The greatest flow through a single location on a road that can be sustained per hour under specific circumstances is known as road capacity [57]. Capacity for two-way flow is established for two-lane two-way roadways. Eq. (2) provides the fundamental formula for calculating capacity:
$C= Co \times FCw \times FCsp \times FCsf \times FCcs$ (2)
where,
C: Capacity (pcu/hour).
CO: Basic capacity (pcu/hour).
FCw: Road width adjustment factor.
FCsp: Directional separation adjustment factor (only for undivided roads).
FCsf: Adjustment factors for side resistance and shoulder width or obstacle kreb distance.
FCcs: Speed adjustment factor.
One of a road section's service indicators (LoS) is the V/C ratio. Thus, traffic volume is divided by road capacity. Traffic characteristics on the Raya Anyer Road section obtained from traffic surveys in the field are described in Table 10.
Table 10. Traffic characteristics
|
Width (m) |
Road Type |
Volume (pcu/h) |
Capacity (pcu) |
V/C |
|
7 |
2/2UD |
1660 |
2552 |
0.65 |
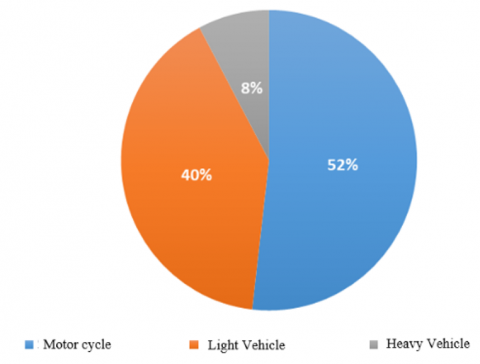
The most dominant type of vehicle traveling on Jalan Raya Anyer is motorcycles, at 53%. Meanwhile, private cars amounted to 24%. We classify each type of vehicle into three groups: MC, LV, and HV. Light vehicles are a type of four-wheeled motorized vehicle, weighing around 1,000 kg to 3,500 kg. Examples of this type of motorized vehicle are passenger vehicles, public transport, pick-up trucks, microbuses, and microtrucks. According to the Bina Marga classification system, heavy vehicles are motorized vehicles with four or more wheels, including buses, 2-axle trucks, 3-axle trucks, and combination trucks, each having a different number of axles and tires. Figure 4 describes the percentage of vehicles grouped by type (motorcycles, light vehicles, and heavy vehicles).
Figure 4. Percentage grouping of vehicle types traveling on Jalan Raya Anyer
The percentage distribution of vehicle types traveling on Jalan Raya Anyer is categorized to analyze traffic composition and assess the impact of each vehicle group on road performance and safety.
4.3 Vehicle speed analysis
The speed was obtained from the results of the spoot speed survey. Then the results of this survey were analyzed to obtain the 85th percentile speed of each type of vehicle. Table 11 describes the 85th percentile speed of each type of vehicle on the Jalan Rata Anyer.
Table 11. Results of 85th percentile vehicle speed analysis
|
Vehicle Type |
Amount of Data |
Standard Deviation |
85th Percentile |
|
Motorcycles (A) |
30 |
11.674 |
59.70 |
|
Motorcycles (B) |
30 |
11.391 |
65.35 |
|
Light Vehicle (A) |
30 |
11.463 |
57.05 |
|
Light Vehicle (B) |
30 |
6.931 |
54.00 |
|
Heavy Vehicle (A) |
30 |
6.080 |
52.00 |
|
Heavy Vehicle (B) |
30 |
6.880 |
50.05 |
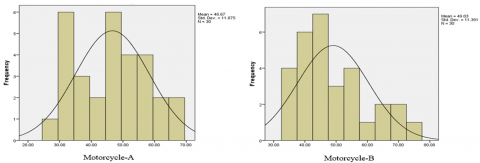
The histogram in Figure 5 shows that the mean speed is 46.67 km/h, with a standard deviation of 11.675. This means that the average speed of motorcycles in direction (A) on Jalan Raya Anyer is 46.67 km/h, with a speed variation of ±11.675 km/h around the average.
Figure 5. Histogram diagram of motor cycle speed on Jalan Raya Anyer
The histogram shows that the speed distribution varies, with the most frequent speed intervals around 30 km/h and 50 km/h, each with the highest frequency (5 vehicles). This distribution appears spread out, with the lowest speed around 20 km/h and the highest approaching 70 km/h. Based on the distribution pattern, the 85th percentile speed is at 60 km/h. This histogram helps to understand the speed pattern of vehicles at this location, including high speed variation and the dominance of moderate speed frequencies. These results can be used as a basis to set an appropriate speed limit in the area. For vehicle speeds in the direction (B), the average speed is 49.03 km/h, with a standard deviation of 11.391 km/h. This indicates that the average vehicle speed is slightly higher than the inbound motorcycle speed, and there is significant variation in vehicle speeds around the average. The histogram of outbound vehicle speeds reveals that speeds around 50 km/h have the highest frequency, reaching approximately 7 vehicles. Most vehicles travel within the range of 40-50 km/h, while a few vehicles travel faster (up to nearly 80 km/h). The distribution pattern in the histogram graph indicates that the 85th percentile speed is at 63 km/h, meaning that 85% of the vehicles are traveling below this speed. Furthermore, the histogram for light vehicles is described in Figure 6.
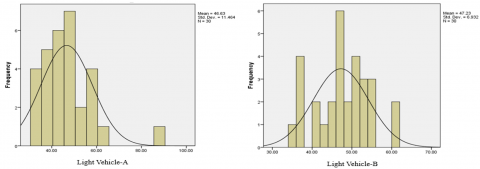
Figure 6. Histogram diagram of light vehicle speed on Jalan Raya Anyer
Based on Figure 6, the average speed of light vehicles in the direction (A) is 46.63 km/h, with a standard deviation of 11.464 km/h. This indicates that most light vehicles are moving at an average speed of around 46.63 km/h, with considerable variation around this value. Most vehicles travel at speeds between 40 and 50 km/h, with the highest frequency in this range being around 7 vehicles. A few vehicles are traveling faster, with one peak reaching approximately 80 km/h. Overall, this histogram shows that most light vehicles are traveling at moderate speeds (around 40-50 km/h) when entering the area. Some vehicles' higher speeds may raise specific safety concerns, and we can use these results to establish more suitable speed limits or policies for heavy vehicles in this area.
For light vehicles in the direction (B), the histogram shows that the average vehicle speed is 47.23 km/h, with a standard deviation of 6.932 km/h. From the histogram of outbound light vehicles, the distribution shows that the 85th percentile speed is 54 km/h, meaning that 85% of vehicles passing this road are traveling at speeds up to 54 km/h. The distribution curve in this histogram suggests a near-normal distribution, with the majority of heavy vehicles moving at moderate speeds, around 40-50 km/h. The speed variation is relatively small, indicating a more uniform movement pattern. Figure 7 then elaborates on the histogram for heavy vehicles.
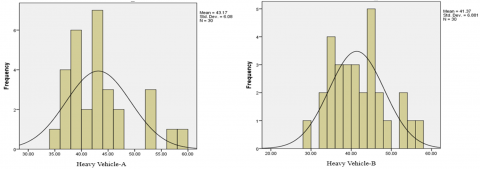
Figure 7 illustrates the speed distribution of heavy vehicles (HV) histogram. The average speed of heavy vehicles in A direction is 43.17 km/h, with a standard deviation of 6.08 km/h. Heavy vehicles mostly travel within a speed range of 35-50 km/h, with the highest frequency around 45 km/h. Some vehicles move at slower speeds around 30 km/h, while others reach speeds up to 60 km/h. This distribution shows a fairly uniform movement pattern among heavy vehicles, with minimal speed variation. For B direction, the average speed is 41.37 km/h with a standard deviation of 6.881 km/h. This means that heavy vehicles tend to travel around 41 km/h with moderate variation. Under existing conditions, most heavy vehicles travel at speeds within the 35-50 km/h range. The highest frequency is around 45 km/h, with some vehicles moving slower, in the range of 20-30 km/h, and a few reaching speeds up to 60 km/h. The 85th percentile speed of heavy vehicles in B direction is 50 km/h. This histogram also shows a pattern close to a normal distribution, with most heavy vehicles traveling near the average speed. The observed curve indicates that the speed distribution of heavy vehicles B in direction tends to be more centered.
Figure 7. Histogram diagram of heavy vehicle speed on Jalan Raya Anyer
4.4 The correlation between vehicle speed and road traffic accidents
In this study, the analysis utilized SPSS 22 software with the Chi-square statistical test. The confidence level in this Chi-square test is 95%, or $\alpha$ = 5%. The following hypotheses were used to establish a relationship between the frequency of accidents and the factors that cause traffic accidents:
A Chi-square analysis to ascertain the correlation between crash fatality and vehicle speed. Table 12 describes the volume of data analyzed.
Table 12. Total traffic accident occurrence data on Raya Anyer
|
|
Valid |
Missing |
Total |
|||
|
N |
Percent |
N |
Percent |
N |
Percent |
|
|
Traffic Accidents |
48 |
100% |
0 |
0.0% |
48 |
100% |
Furthermore, the speed frequency data on DRK in the Chi-square analysis is described in Table 13.
Table 13. Frequency data of speed exceeding the permitted limit in accident-prone areas
|
|
Severity |
Total |
|||
|
Minor Injury/Severe Injury |
Fatality |
||||
|
Speed |
Speeding |
Count |
7 |
3 |
10 |
|
% within Fatalitas |
38.9% |
10.0% |
20.8% |
||
|
% of Total |
14.6% |
6.3% |
20.8% |
||
|
Not Speeding |
Count |
11 |
27 |
38 |
|
|
% within Fatalitas |
61.1% |
90.0% |
79.2% |
||
|
% of Total |
22.9% |
56.3% |
79.2% |
||
|
Total |
Count |
18 |
30 |
48 |
|
|
% within Fatalitas |
100% |
100% |
100% |
||
|
% of Total |
37.5% |
62.5% |
100% |
||
Table 14 displays the results of the Chi-square test for the relationship between vehicle speed and traffic fatalities.
Table 14. The Chi-square analysis reveals the impact of vehicle speed on fatalities
|
|
Value |
df |
Asymptotic Significance (2-Sided) |
Exact Sig. (2-Sided) |
Exact Sig. (1-Sided) |
|
Pearson Chi-square |
5.693a |
1 |
0.017 |
|
|
|
Continuity Correctionb |
4.076 |
1 |
0.044 |
|
|
|
Likelihood Ratio |
5.565 |
1 |
0.018 |
|
|
|
Fisher's Exact Test |
|
|
|
0.027 |
0.023 |
|
Linear-by-Linear Association |
5.574 |
1 |
0.018 |
|
|
|
N of Valid Cases |
48 |
|
|
|
|
Table 14 shows the results of the Chi-square test that analyzes the relationship between vehicle speed and traffic fatalities. The Chi-square test value is 5.693 with a degree of freedom (df) of 1. The asymptotic significance value (2-sided) is 0.017, which is smaller than 0.05. This indicates that there is a statistically significant relationship between vehicle speed and traffic fatalities at the 95% confidence level. This indicates that there is a statistically significant relationship between vehicle speed and traffic fatalities at the 95% confidence level. Continuity correction was used for data with df = 1, which resulted in a correction value of 4.076 with a significance of 0.044. This result also indicates a significant relationship, although weaker than the Pearson Chi-square. The likelihood ratio value was 5.565, with a significance level of 0.018. This reinforces the Pearson Chi-square result that there is a significant relationship between vehicle speed and crash fatality. In Fisher's exact test for data with a small sample size, the 2-sided significance value was 0.027, and the 1-sided significance value was 0.023. Both indicate a significant association. The linear association test value was 5.574 with a significance of 0.018, indicating a trend towards a linear relationship between vehicle speed and crash fatality rate. Overall, the Chi-square test results indicate a significant relationship between vehicle speed and fatalities.
4.5 Speed management recommendations for road sections
Speed analysis indicates that vehicle speed has a significant impact on the fatality rate of traffic accident victims. Consequently, speed management is considered one of the most effective strategies for reducing road traffic accidents. Targeted speed management measures are typically implemented in accident-prone areas. Figure 8 illustrates a black spot location along Jalan Raya Anyer.
Figure 8. Black spot area on the Jalan Raya Anyer
Given the current issues, the researchers propose implementing speed management through the installation of signs and markings pertaining to speed control in the surrounding area [2, 3, 5, 23, 38]. Installation of speed limit signs with distances adjusted to the driver's visibility. Place speed limit signs and special warning boards at accident-prone locations on primary arterial roads. These signs can help remind drivers to adjust their speed, especially in high-risk areas and during busy road conditions. Neighborhoods with high pedestrian activity, like schools, residential areas, or shopping areas, are designated as low-speed zones.
The Guidelines for the Placement of Road Equipment Facilities [58] recommend installing speed limit signs with adjusted positioning and spacing in areas with educational, commercial and residential land use. Table 15 details the signs used in vehicle speed management based on land use.
Table 15. Signage requirements based on land use
|
Land Uses |
Speed (km/h) |
Road Signs |
Road Sign Positions |
|
Education Areas |
30 |
Warning sings Pedestrian warning signs |
|
|
No parking sign |
|
||
|
Pedestrian facility sign |
|
||
|
Maximum speed limit order signs |
|
||
|
Commercial Areas |
40 |
Maximum speed limit order signs |
|
|
Residental Areas |
40 |
Maximum speed limit order signs |
|
Source: [58]
Kurniastuti et al. [3] suggest the use of speed management systems to enhance driving safety. These systems include speed limit signs positioned within the driver’s line of sight. Similarly, Andini et al. [2] emphasize that the most effective method of speed management is the installation of speed limit signs. Zheng et al. [38] argue that using larger traffic signs with appropriate spacing can help reduce the frequency of collisions. Properly placed traffic signs, designed in accordance with the road’s geometric and functional characteristics, are a fundamental element of road design and among the most effective measures to improve road safety [9, 17, 59]. Research indicates that speed limit signs repeated at 35-meter intervals are effective in 75% of cases [16].
However, Sugiyanto and Malkhamah [25] report that the implementation of speed limit signs alone is less effective in reducing vehicle speeds. To improve the effectiveness of speed limit signs, Murti and Muthohar [60] propose installing warning lights one meter from the speed limit sign and warning banners 500 meters from the start of the road section. To enhance the effectiveness, Jomaa et al. [61] propose an alternative and more effective approach is the implementation of a graded speed-limit system, in which speed limits are gradually reduced over a defined distance. This strategy has been shown to significantly decrease vehicle speeds, resulting in better compliance with the intended speed regulations.
In curved sections, Adisthi et al. [46] recommend setting speed limits based on advisory speeds. Furthermore, Charlton et al. [23] note that road markings with specific speed limits can systematically improve speed consistency and driver compliance. Andini et al. [2] also demonstrate that transverse road markings can influence driver behavior and contribute to reduced vehicle speeds.
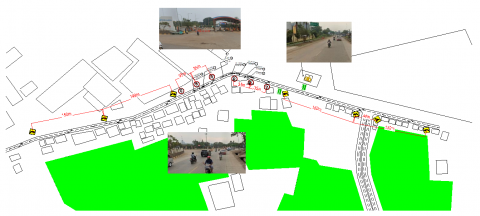
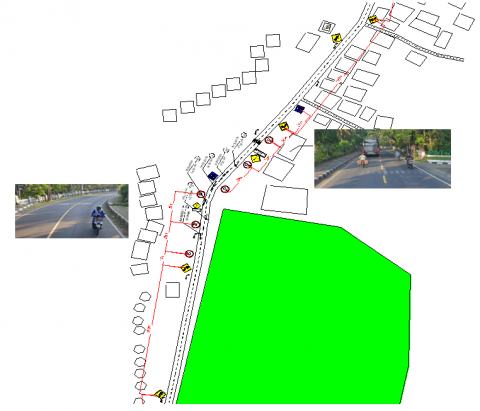
Jalan Raya Anyer, identified as a high-risk area for traffic accidents, spans 19 kilometers. For more effective speed management, the road has been divided into five segments. Figure 9 presents details of Segment 1, which is part of the studied accident-prone area.
Figure 9. Proposed installation of speed limit signs on Segment 1 of Jalan Raya Anyer
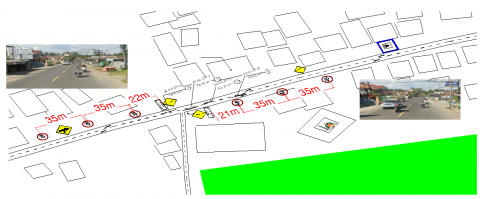
Traffic signs, when placed in accordance with the road’s geometric and functional characteristics, are a crucial element of road design and among the most effective measures for enhancing road safety. According to the Ministry of Transportation of the Republic of Indonesia (2014), bend warning signs should be installed 150 meters before the curve, with a minimum of three repetitions prior to the bend. If the bend curves to the left, the direction sign should be placed on the right side of the traffic direction. Conversely, if the bend curves to the right, the sign should be placed on the left side of the traffic direction. Further details of Segments 2, 3, 4, and 5 are presented in Figures 10-13, respectively.
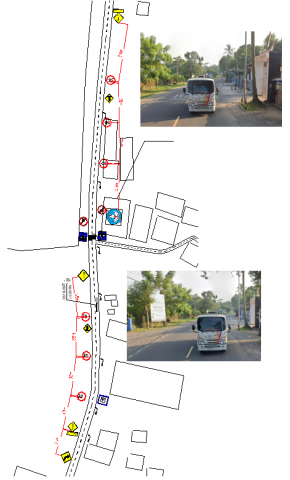
Figure 10. Proposed installation of speed limit signs on Segment 2 of Jalan Raya Anyer
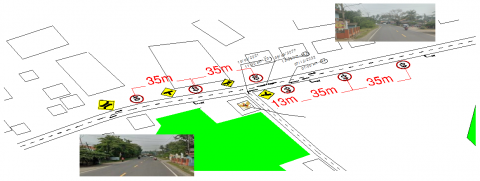
Figure 11. Proposed installation of speed limit signs on Segment 3 of Jalan Raya Anyer
Figure 12. Proposed installation of speed limit signs on Segment 4 of Jalan Raya Anyer
Figure 13. Proposed installation of speed limit signs on Segment 5 of Jalan Raya Anyer
Traditional speed limit signs often fail to significantly reduce vehicle speeds. For example, research conducted by Mu et al. [62] found that vehicles continued to travel well above the posted speed limits even after passing speed limit signs. Although speed limit signs (e.g., 100 km/h and 80 km/h) influenced some drivers’ speed choices, the overall effect was minimal, with many drivers still exceeding the limits.
A more effective approach involves implementing a graded speed-limit system, where speed limits are reduced gradually. This method has been shown to significantly lower vehicle speeds, aligning them more closely with the posted limits. Additionally, Vehicle-Activated Signs (VAS)—which are triggered when a vehicle exceeds a set speed threshold—have demonstrated high effectiveness. For instance, a pilot program in Devon reported that VAS led to greater reductions in vehicle speeds than traditional static signs [61]. Driver Feedback Signs (DFS), which provide real-time feedback to drivers about their speed, have also proven successful. A study in Edmonton, Canada, found that DFS reduced the incidence of severe speed-related collisions by 32.5% to 44.9%, making it a cost-effective safety intervention [63]. Moreover, Intelligent Speed Assist (ISA) systems, which use speed sign recognition cameras, can significantly improve compliance with speed limits and reduce speed-related fatalities and injuries. However, the effectiveness of ISA depends on the consistent presence and visibility of speed limit signs [64].
The effectiveness of traffic signs also varies depending on driver characteristics, such as age, gender, and educational background [65]. Understanding these differences is essential for designing more effective and inclusive signage. Furthermore, traffic signs must remain visible and easily comprehensible under diverse environmental conditions. Advanced detection technologies, such as those employing the YOLOv8 algorithm, can aid in real-time traffic sign detection and classification, thereby improving effectiveness in adverse conditions [51].
The analysis results indicate a significant relationship between vehicle speed and accident risk. The higher the vehicle speed, the greater the potential for accidents with higher levels of fatality. This demonstrates that controlling vehicle speed is an essential factor in reducing traffic accidents on roads. The majority of road users adopt the 85th percentile speed. In cases where the 85th percentile speed is high, it indicates that many drivers exceed the safe speed limit, increasing the risk of accidents. Therefore, setting an appropriate speed limit and regulating vehicle speed around the 85th percentile can help reduce accident potential. Speed differences between vehicles can also increase accident risk, particularly if some vehicles are traveling significantly faster or slower than the average speed. Thus, maintaining speed uniformity on highways can reduce conflicts between vehicles and lower accident risk.
This study supports the importance of consistent monitoring and law enforcement speed limits. The use of tools such as speed enforcement cameras or speed guns, along with enforcing fines for speed violations, can help control vehicle speed and enhance driver discipline. Based on the vehicle speed data for the road segment studied, recommendations for speed limits need to consider the speed percentile analysis results and existing safety standards. Setting speed limits that align with road characteristics and the speed patterns of road users can minimize accident risk.
Combining speed limit signs with automated speed enforcement systems can further enhance compliance. These systems have been shown to reduce illegal speeding behavior and improve overall road safety. While traditional speed limit signs alone may not be sufficient to control vehicle speeds effectively, enhanced measures such as grading speed limits, vehicle-activated signs, and driver feedback signs show significant promise. Technological advancements like automated enforcement and intelligent speed assist systems further bolster the effectiveness of traffic signs in improving road safety and controlling speeds. By integrating these findings, transportation agencies can develop more effective strategies to enhance road safety and ensure better compliance with speed limits.
This conclusion also emphasizes the importance of educating road users about the dangers of high speed and the benefits of complying with speed limits. Safety campaigns and safe driving training can increase driver awareness of the importance of maintaining a safe speed for collective safety. This study shows that speed regulation and monitoring are crucial steps in efforts to improve road safety. These steps include implementing appropriate speed limits, consistent law enforcement, enhancing safety education, and supporting speed monitoring technology. By implementing these recommendations, it is hoped that a safer traffic environment can be achieved.
The authors extend their gratitude to Gadjah Mada University for funding this research through the Research Assistance Program (Grant No.: 10550/UN1.P4/PT.01.03/2024). We also thank the Cilegon District Police for their administrative support and express our appreciation to everyone who contributed to the collection and processing of the research data.
[1] Rabbani, M.B.A., Musarat, M.A., Alaloul, W.S., Maqsoom, A., Bukhari, H., Rafiq, W. (2021). Road traffic accident data analysis and its visualization. Civil Engineering and Architecture, 9(5): 1603-1614. https://doi.org/10.13189/cea.2021.090530
[2] Andini, F.R., Kusumastutie, N.S., Purwanto, E., Rusmandani, P., Yusup, L.A. (2020). The effectiveness of speed limit sign and marking as the speed management devices. In Proceedings of 2nd International Symposium on Transportation Studies in Developing Countries (ISTSDC 2019), pp. 139-142. https://doi.org/10.2991/aer.k.200220.029
[3] Kurniastuti, A.S., Sari, N., Sutanto, S. (2021). Peningkatan keselamatan di ruas jalan pantura Km 46-47 kecamatan patrol kabupaten indramayu. Jurnal Transportasi, 21(2): 101-108. https://doi.org/10.26593/jtrans.v21i2.5158.101-108
[4] Zhao, X.H., Wu, Y.P., Rong, J., Ma, J.M. (2015). The effect of chevron alignment signs on driver performance on horizontal curves with different roadway geometries. Accident Analysis & Prevention, 75: 226-235. https://doi.org/10.1016/j.aap.2014.12.004
[5] Sari, N., Malkhamah, S., Suparma, L.B. (2024). Prediction model of factors causing traffic accidents on rural arterial roads: A binary logistic regression approach. Journal of Infrastructure, Policy and Development, 8(6): 6692. https://doi.org/10.24294/jipd.v8i6.6692
[6] Turner, B., Makwasha, T., Hillier, P. (2017). Infrastructure treatments for managing speeds on rural and urban arterial roads. Journal of the Australian College of Road Safety, 28(2): 13-20.
[7] Tjahjono, T. (2016). Upaya peningkatan keselamatan pada jalan nasional Indonesia. Jurnal Transportasi, 16(2): 143-150. https://doi.org/10.26593/jtrans.v16i2.2363.%25p
[8] Zhu, M.Q., Wang, Z., Cui, H.J., Yang, Y.Z., Qie, P.Q. (2023). Situation and hotspot analysis on rural transport infrastructure from the perspective of bibliometric analysis. Journal of Traffic and Transportation Engineering (English Edition), 10(6): 1074-1098. https://doi.org/10.1016/j.jtte.2023.04.009
[9] Mayuni, S., Widodo, S., Sulandari, E. (2017). Evaluasi Keselamatan infrastruktur jalan (Studi kasus jalan trans kalimantan). Prosiding Konferensi Nasional Teknik Sipil dan Perencanaan (KN-TSP), Pekanbaru, 187-195.
[10] Pamungkas, S.B., Amirotul, M., Setiono. (2017). Analisis lokasi rawan kecelakaan di jalan arteri primer kota surakarta. E-Jurnal Matriks Tek. Sipil, 1199-1206.
[11] Aswardi, T., Saleh, S.M., Isya, M. (2017). Evaluasi kecelakaan lalu lintas ditinjau dari aspek jarak pandang geometrik jalan dan fasilitas perlengkapan jalan terhadap simpang sibreh. Jurnal Teknik Sipil, 1(1): 263-270.
[12] Manggala, R., Angga J, J., Purwanto, D., Indriastuti, A.K. (2016). Studi kasus faktor penyebab kecelakaan lalu lintas pada tikungan tajam. Jurnal Karya Teknik Sipil, 4(4): 462-470. https://ejournal3.undip.ac.id/index.php/jkts/article/view/10575.
[13] Khomeini, M., Taufik, S. (2017). Analisis penanganan lokasi rawan kecelakaan lalu lintas di kota palangka raya. Jurnal Teknologi Berkelanjutan, 6(2): 67-83. http://jtb.ulm.ac.id/index.php/JTB/article/view/103.
[14] Zanuardi, A., Suprayitno, H. (2018). Analisa karakteristik kecelakaan lalu lintas di jalan ahmad yani surabaya melalui pendekatan knowledge discovery in database. Jurnal Manajemen Aset Infrastruktur & Fasilitas, 2(1): 45-55. https://doi.org/10.12962/j26151847.v2i1.3767
[15] Handayani, D., Ophelia, R.O., Hartono, W. (2017). Pengaruh pelanggaran lalu lintas terhadap potensi kecelakaan pada remaja pengendara sepeda motor. Matriks Teknik Sipil, 5(3): 838-843. https://doi.org/10.20961/mateksi.v5i3.36710
[16] Pramesti, Y.T., Budiharjo, A. (2020). Efektivitas rambu batas kecepatan di jalan kolektor. Jurnal Teknik, 18(2): 73-81. https://doi.org/10.37031/jt.v18i2.98
[17] Perdana, R.R., Permata, Y.K.A., Latifah, S., Sukoyo, S., Wasino, W. (2019). Analisis pengaruh geometrik dan kelengkapan rambu lalu lintas terhadap kecelakaan (Studi kasus: Tanjakan kethekan kec. jambu, ruas jalan ambarawa–magelang Km. 46+000 S/D 46+750). Wahana Teknik Sipil: Jurnal Pengembangan Teknik Sipil, 24(1): 60-72. https://doi.org/10.32497/wahanats.v24i1.1607
[18] Yotsutsuji, H., Kita, H., Xing, J., Hirai, S. (2017). A car-accident rate index for curved roads: A speed choice-based approach. Transportation Research Procedia, 25: 2108-2118. https://doi.org/10.1016/j.trpro.2017.05.404
[19] Sirait, W.J., Priyanto, S., Jamson, S. (2014). The efficacy of motorcycle training to reduce self-reported negative behaviour and attitude (Case study in UK and Indonesia). Journal of the Civil Engineering Forum, 23(1). https://doi.org/10.22146/jcef.18900
[20] De Pauw, E., Daniels, S., Thierie, M., Brijs, T. (2014). Safety effects of reducing the speed limit from 90km/h to 70km/h. Accident Analysis & Prevention, 62: 426-431. https://doi.org/10.1016/j.aap.2013.05.003
[21] de Oña, J., Garach, L., Calvo, F., García-Muñoz, T. (2014). Relationship between predicted speed reduction on horizontal curves and safety on two-lane rural roads in Spain. Journal of Transportation Engineering, 140(3): 04013015. https://doi.org/10.1061/(ASCE)TE.1943-5436.0000624
[22] Alhomaidat, F., Kwigizile, V., Oh, J.S., Van Houten, R. (2020). How does an increased freeway speed limit influence the frequency of crashes on adjacent roads? Accident Analysis & Prevention, 136: 105433. https://doi.org/10.1016/j.aap.2020.105433
[23] Charlton, S.G., Starkey, N.J., Malhotra, N. (2018). Using road markings as a continuous cue for speed choice. Accident Analysis & Prevention, 117: 288-297. https://doi.org/10.1016/j.aap.2018.04.029
[24] WHO. (2018). Global Status Report on Road Safety 2018. World Health Organization.
[25] Sugiyanto, G., Malkhamah, S. (2018). Determining the maximum speed limit in urban road to increase traffic safety. Jurnal Teknologi (Sciences & Engineering), 80(5): 67-77. https://doi.org/10.11113/jt.v80.10489
[26] Noesaku, D.G., Malkhamar, S., Suparma, L.B. (2017). Pengelolaan risiko kecelakaan lalu lintas: Cakupan, indikator, strategi dan teknik. PProsiding Simposium II–UNIID 2017, 195-203.
[27] Zheng, C.Y., Zhao, X.P. (2023). Analysis of the relevance degree of the influencing factors of traffic accidents. In ICBAR '23: Proceedings of the 2023 3rd International Conference on Big Data, Artificial Intelligence and Risk Management, Chengdu, China, pp. 10-15. https://doi.org/10.1145/3656766.3656768
[28] Singh, H., Kushwaha, V., Agarwal, A.D., Sandhu, S.S. (2016). Fatal road traffic accidents: Causes and factors responsible. Journal of Indian Academy of Forensic Medicine, 38(1): 52-54. https://doi.org/10.5958/0974-0848.2016.00014.2
[29] Pane, R.R., Lubis, M., Batubara, H. (2021). Studi kebutuhan fasilitas keselamatan jalan dikawasan kota kisaran kabupaten asahan. Buletin Utama Teknik, 16(3): 224-234. https://jurnal.uisu.ac.id/index.php/but/article/view/3786.
[30] Rezapour, M., Moomen, M., Ksaibati, K. (2019). Ordered logistic models of influencing factors on crash injury severity of single and multiple-vehicle downgrade crashes: A case study in Wyoming. Journal of Safety Research, 68: 107-118. https://doi.org/10.1016/j.jsr.2018.12.006
[31] Pradana, M.F., Intari, D.E. (2019). Analisa kecelakaan lalu lintas dan faktor penyebabnya di jalan raya cilegon. Jurnal Kajian Teknik Sipil, 4(2): 165-175. https://doi.org/10.52447/jkts.v4i2.1492
[32] Umair, M., Rana, I.A., Lodhi, R.H. (2022). The impact of urban design and the built environment on road traffic crashes: A case study of Rawalpindi, Pakistan. Case Studies on Transport Policy, 10(1): 417-426. https://doi.org/10.1016/j.cstp.2022.01.002
[33] Rashmi, B.S., Marisamynathan, S. (2023). Factors affecting truck driver behavior on a road safety context: A critical systematic review of the evidence. Journal of Traffic and Transportation Engineering (English Edition), 10(5): 835-865. https://doi.org/10.1016/j.jtte.2023.04.006
[34] Li, X., Zhuge, C.X., Yu, B.Y. (2019). Analysis on the impact of illegal driver behaviors on road traffic accidents case study on China. In 2019 11th International Conference on Intelligent Human-Machine Systems and Cybernetics (IHMSC), Hangzhou, China, pp. 250-253. https://doi.org/10.1109/IHMSC.2019.00065
[35] George, Y., Athanasios, T., George, P. (2017). Investigation of road accident severity per vehicle type. Transportation Research Procedia, 25: 2076-2083. https://doi.org/10.1016/j.trpro.2017.05.401
[36] Atombo, C., Turkson, R.F., Akple, M.S. (2022). Impact of vehicle-related factors on speed selection and accident severity rates. International Journal of Vehicle Safety, 12(3-4): 210-225. https://doi.org/10.1504/IJVS.2022.129621
[37] Macedo, M.R., Maia, M.L., Rabbani, E.R.K., Neto, O.C.L., Andrade, M. (2022). Traffic accident prediction model for rural highways in Pernambuco. Case Studies on Transport Policy, 10(1): 278-286. https://doi.org/10.1016/j.cstp.2021.12.009
[38] Zheng, L., Sun, J., Meng, X. (2018). Crash prediction model for basic freeway segments incorporating influence of road geometrics and traffic signs. Journal of Transportation Engineering, Part A: Systems, 144(7): 04018030. https://doi.org/10.1061/JTEPBS.0000155
[39] Sari, N., Malkhamah, S., Suparma, L.B. (2024). Road traffic accidents factor on rural arterial roads. Journal of Applied Engineering Science, 22(2): 470-482. https://doi.org/10.5937/jaes0-49183
[40] Tjahjono, N., Nugroho, I. (2018). Tanaman hias sebagai peredam kebisingan. In Conference on Innovation and Application of Science and Technology (CIASTECH), 1(1): 703-710.
[41] Verma, A., Sasidharan, S., Bhalla, K., Allirani, H. (2022). Fatality risk analysis of vulnerable road users from an Indian city. Case Studies on Transport Policy, 10(1): 269-277. https://doi.org/10.1016/j.cstp.2021.12.008
[42] Mohan, D. (2016). Speed and its effects on road traffic crashes. Transport Planning and Traffic Safety-Making Cities, Roads and Vehicles Safer, 127-137.
[43] Doecke, S.D., Baldock, M.R., Kloeden, C.N., Dutschke, J.K. (2020). Impact speed and the risk of serious injury in vehicle crashes. Accident Analysis & Prevention, 144: 105629. https://doi.org/10.1016/j.aap.2020.105629
[44] Castillo-Manzano, J.I., Castro-Nuño, M., Lopez-Valpuesta, L., Vassallo, F.V. (2019). The complex relationship between increases to speed limits and traffic fatalities: Evidence from a meta-analysis. Safety Science, 111: 287-297. https://doi.org/10.1016/j.ssci.2018.08.030
[45] Yuhua, P., Dingyue, C., Xia, L., Lihao, C., Jiayu, Y. (2016). Research on driving behavior based on vehicles safety. Journal of Computational and Theoretical Nanoscience, 13(3): 2171-2180. https://doi.org/10.1166/jctn.2016.5172
[46] Adisthi, M., Thahjono, T., Siregar, M.L. (2015). Pengembangan metode penetapan rambu kecepatan berkeselamatan di jalan nasional (Studi Kasus: Jalan Trans Sulawesi). In 18th International Symposium, Unila, Bandar Lampung.
[47] Alhomaidat, F., Kwigizile, V., Oh, J.S. (2021). Impacts of freeway speed limit on operation speed of adjacent arterial roads. IATSS Research, 45(2): 161-168. https://doi.org/10.1016/j.iatssr.2020.08.007
[48] Mora, O., Figueroa, M., Borrero, D., Abello, J., Mattos-Rodriguez, A., Naranjo, T., Urrego, C. (2023). Operational assessment of speed Control measures on capacity of urban roads in metropolitan area of barranquilla, Colombia. Civil Engineering and Architecture, 11(1): 22-35. https://doi.org/10.13189/cea.2023.110103
[49] Hasyim, I.D.M.A., Karyawan, Rohani. (2023). Effect of median application on section road performance based on degree of saturation and speed at road of small town in Lombok, Indonesia. Civil Engineering and Architecture, 11(2): 784-793. https://doi.org/10.13189/cea.2023.110219
[50] Guan, W., Zhao, X.H., Qin, Y.L., Rong, J. (2014). An explanation of how the placement of traffic signs affects drivers’ deceleration on curves. Safety Science, 68: 243-249. https://doi.org/10.1016/j.ssci.2014.04.007
[51] Kingsly, J., Bhalaji, C.K., Selvalakshmi, C.B., Radhika, A. (2024). Traffic sign categorization using YOLO algorithm: Leveraging real-time object detection for improved road safety. In 2024 9th International Conference on Communication and Electronics Systems (ICCES), Coimbatore, India, pp. 1547-1553. https://doi.org/10.1109/ICCES63552.2024.10860011
[52] Reddy, D.M., Kavuri, N.C. (2021). Black spot analysis using weighted severity index method at Bhongir Zone-Rachakonda police commissionerate-hyderabad. Civil Engineering and Architecture, 9(6): 1687-1697. https://doi.org/10.13189/cea.2021.090603
[53] AAASHTO (American Association of State Highway Transportation Officials). (2018). A Policy on Geometric Design of Highways and Streets: The Green Book (7th edition). https://kankakeerecycling.com/wp-content/uploads/2023/04/THE_GREEN_BOOK_A_Policy_on_Geometric_Des.pdf.
[54] Umum, K.P., Rakyat, P. (2021). Pedoman desain geometrik jalan . Direktorat Jenderal Bina Marga, Jakarta. https://binamarga.pu.go.id/index.php/konten/ebook_show/nspk/1313_surat-edaran-direktur-jenderal-bina-marga-nomor-20sedb2021-tentang-pedoman-desain-geometrik-jalan-pedoman-nomor-13pbm2021.
[55] Yu, Q.F., You, K.S., Chu, Y.M. (2019). Hierarchical division method of road network for critical points identification. In IOP Conference Series: Earth and Environmental Science, 330(5): 052005. https://doi.org/10.1088/1755-1315/330/5/052005
[56] Elyasi, M.R., Saffarzade, M., Boroujerdian, A.M. (2016). A novel dynamic segmentation model for identification and prioritization of black spots based on the pattern of potential for safety improvement. Transportation Research Part A: Policy and Practice, 91: 346-357. https://doi.org/10.1016/j.tra.2016.06.020
[57] Direktorat Jenderal Bina Marga. (2023). Pedoman kapasita jalan Indonesia. https://binamarga.pu.go.id/uploads/files/1942/09pbm2023-pedoman-kapasitas-jalan-indonesia-.pdf.
[58] Departemen Perhubungan. (2014). Panduan Penempatan Fasilitas Perlengkapan Jalan. https://cvmatrik.com/wp-content/uploads/2012/06/juknisperlengkapanjalan.pdf.
[59] Sujanto, S., Mulyono, A.T. (2010). Inspeksi keselamatan jalan di jalan lingkar selatan yogyakarta. Jurnal Transportasi, 10(1): 13-22. https://doi.org/10.26593/jtrans.v10i1.364.%25p
[60] Murti, R.T., Muthohar, I. (2012). Evaluasi kinerja rambu pembatasan kecepatan sebagai upaya mendukung aksi keselamatan jalan. Jurnal Transportasi, 12(3): 227-236, https://doi.org/10.26593/jtrans.v12i3.505.%25p
[61] Jomaa, D., Dougherty, M., Yella, S., Edvardsson, K. (2016). Effectiveness of trigger speed of vehicle-activated signs on mean and standard deviation of speed. Journal of Transportation Safety & Security, 8(4): 293-309. https://doi.org/10.1080/19439962.2014.976690
[62] Mu, M.H., Guangxun, E., Yang, Y.Y., Ma, Y.J. (2023). Study on the influence of speed limit sign on driver’s speed choice. In Eighth International Conference on Electromechanical Control Technology and Transportation (ICECTT 2023), Hangzhou, China, pp. 856-867. https://doi.org/10.1117/12.2689465
[63] Wu, M., El-Basyouny, K., Kwon, T.J. (2020). Before-and-after empirical Bayes evaluation of citywide installation of driver feedback signs. Transportation Research Record, 2674(4): 419-427. https://doi.org/10.1177/0361198120912243
[64] Peiris, S., Newstead, S., Berecki-Gisolf, J., Fildes, B. (2022). Quantifying the foregone benefits of intelligent speed assist due to the limited availability of speed signs across three Australian states. Sensors, 22(20): 7765. https://doi.org/10.3390/s22207765
[65] Taheri, F., Torshizi, Y.F., Saremi, M., Pronin, M. (2022). Effects of traffic sign design and personal characteristics on the usability of traffic signs. Work, 71(4): 917-925. https://doi.org/10.3233/WOR-213636