Yue Yang*![]() | Yun Yao
| Yun Yao![]()
© 2025 The authors. This article is published by IIETA and is licensed under the CC BY 4.0 license (http://creativecommons.org/licenses/by/4.0/).
OPEN ACCESS
Student activities play a vital role in ideological education, psychological wellbeing, and competence development in higher education, yet the scientific modeling of student relationships and the optimization of activity organization remain unresolved challenges. An integrated framework was established based on Graph Neural Networks (GNNs), encompassing student activity management, psychological health education, and organizational optimization. Student–activity bipartite and student–student projection graphs were constructed, with Graph Convolutional Network (GCN), Graph Attention Network (GAT), and Dynamic Self-Attention Network (DySAT) applied for relationship modeling, Light Graph Convolutional Network (LightGCN) for activity recommendation, and reinforcement learning (RL) for scheduling and resource allocation. GNN propagation equations, recommendation model optimization functions, and RL reward mechanisms were derived. Empirical results demonstrated that: (a) the student relationship network exhibited a core–periphery structure, and activity participation significantly influenced group connectivity patterns; (b) activity participation was associated with measurable improvements in psychological wellbeing, reflected by a 0.04 increase in wellbeing and reductions in stress, anxiety, and depression; (c) the GNN-based recommendation model achieved superior performance over baseline methods in terms of Hit@10 and NDCG@10, while RL optimization further enhanced overall participation rates (+7.8%), reduced resource conflicts (–15.6%), and improved group fairness (+0.11). These findings indicate that integrating GNN-based modeling with educational recommendation and optimization can enhance the scientific validity and fairness of student activity organization, while providing data-driven support for psychological health education. The study advances interdisciplinary research linking educational management, mental health, and artificial intelligence (AI), and offers practical tools for Chinese Communist Youth League (CCYL) committees and counselors in universities.
GNNs, student activity management, psychological health education, activity recommendation, organizational optimization, educational big data
In the context of contemporary higher education, student activities have been regarded as a vital vehicle for cultivating ideological and political qualities, comprehensive competencies, and psychological wellbeing. Whether in the form of ideological and political education programs, academic competitions, extracurricular organizations, or psychological group counseling, such activities play a central role in academic development, the construction of social relationships, and the provision of psychological support for students [1]. Nevertheless, significant challenges have frequently been encountered in practice by university Chinese Communist Youth League (CCYL) committees and counselors. Insufficient interest among certain students has resulted in low participation rates; the allocation of activity resources has often lacked efficiency; and disparities in participation have been observed across different student groups [2]. Addressing how student activity management can be advanced through scientific and data-driven approaches has therefore emerged as a pressing issue in educational administration.
At the same time, psychological health concerns among university students have become increasingly prominent, with stress, anxiety, and feelings of isolation widely reported [3]. A substantial body of research has indicated that active participation in campus activities is associated with enhanced belongingness and wellbeing, which in turn contributes to the improvement of psychological health outcomes [4, 5]. Consequently, the integration of student activity management with psychological health education is considered essential, as it not only strengthens the scientific validity of activity organization but also fosters a synergistic educational effect that supports the holistic development of students.
In the current era of rapid advances in information technology (IT) and AI, GNNs have emerged as a powerful approach for handling complex relational structures and have been widely applied in Social Network Analysis (SNA), recommendation systems, and educational data mining [6, 7]. Compared with traditional methods of SNA, GNNs enable more accurate capture of interaction patterns among students and provide effective prediction of potential relationships and behaviors within dynamic environments [8]. In the specific context of student activities, student–activity interactions can be formulated as a bipartite graph, which can subsequently be projected into a student–student relationship network, thereby offering CCYL committees and counselors a novel perspective for data-driven modeling [9].
Building on this foundation, a GNN-centered framework for student relationship modeling and activity organization optimization was proposed in this study, with a focus on addressing three central questions. First, how can GNNs be employed to accurately model the student relationship network in order to uncover latent group structures and interaction patterns? Second, how can activity recommendations and organizational strategies be optimized based on such a model to enhance student participation rates and improve resource utilization efficiency? Third, how can the mechanisms through which participation in student activities contributes to psychological health improvement be empirically validated?
The theoretical contribution of this study lies in extending the intersection of psychological health education and educational management research, while promoting the deeper application of AI methods within educational settings [10]. Its practical significance rests in providing intelligent decision-support systems for CCYL committees and counselors, thereby enabling precise delivery of activity recommendations and optimized resource allocation. Ultimately, this integration is expected to foster greater student engagement, promote psychological wellbeing, and advance holistic student development.
2.1 Student activities and management
Student activities have been recognized as a vital component of higher education systems, exerting significant influence on ideological and political education, academic development, and psychological wellbeing. Empirical evidence has shown that participation in extracurricular activities can not only strengthen learning motivation but also promote social adaptation and holistic development [11]. Kahu and Nelson [1] emphasized that student activities constitute one of the critical mechanisms of student success, with their effects exerted through belongingness, academic engagement, and emotional support. Recent studies have further demonstrated that participation in campus activities is strongly associated with improvements in wellbeing and reductions in psychological stress [4, 5], whereas lack of participation has been linked to isolation and burnout [2]. These findings highlight that student activities are not merely a matter of educational management but are also closely connected to psychological health education.
2.2 Relationship between psychological health and activity participation
Psychological health challenges among university students have become increasingly pronounced in recent years, with stress, anxiety, and depression widely reported [3]. Elmer et al. [12] found that during the COVID-19 pandemic, a contraction of student social networks was significantly correlated with declines in psychological wellbeing. Conversely, participation in diverse activities has been shown to enhance wellbeing while reducing anxiety and feelings of isolation [13]. In a longitudinal study, Heikkinen et al. [14] further confirmed that higher levels of online participation were positively associated with improvements in psychological health. Collectively, these studies suggest that student activities not only facilitate social interaction and foster belongingness but also play a potential role as an intervention in psychological health support.
2.3 Methods for analyzing the student relationship network
Traditional SNA methods have been widely applied to describe peer relationships, learning communities, and social structures. However, their capacity to capture the dynamic evolution of complex relationships remains limited. In recent years, GNNs have demonstrated considerable advantages in processing complex graph-structured data [6, 7]. Zhang et al. [15] provided a systematic review of GCNs, emphasizing their potential in recommendation systems and social network modeling. Building on this, Kazemi et al. [16] highlighted that dynamic GNNs are capable of modeling the temporal evolution of student relationships, making them particularly well-suited for characterizing the sequential features of student activity participation.
2.4 Activity recommendation and optimization
With the advancement of educational data mining, graph-based recommendation systems have gained increasing attention in educational contexts. The LightGCN model proposed by Wang et al. [9] achieved efficient recommendation performance through simplified graph convolutional layers, demonstrating significant effectiveness on user–item bipartite graphs. Wang et al. [17] and Wu et al. [18] systematically reviewed developments in graph learning–based recommendation systems, noting their promising applications in activity recommendation and resource allocation. At the same time, fairness and interpretability have emerged as critical challenges in educational recommendation systems. Duricic et al. [19] underscored the importance of fairness constraints in recommendation systems, while Yuan et al. [20] summarized advances in the interpretability of GNNs, providing valuable insights for their application in educational scenarios.
2.5 Research gaps and limitations
Although considerable progress has been made in research on student participation, psychological health, and GNN modeling, several important limitations remain as follows:
(a) Most existing studies have examined activities or psychological health from a single perspective, with limited attention given to integrated frameworks that combine student activities, psychological health, and relationship networks [21].
(b) The majority of recommendation system studies have focused on commercial or social platforms, while issues of personalization and fairness in educational contexts have been insufficiently addressed [22].
(c) Current applications of GNNs in education have predominantly remained at the level of static modeling, with inadequate exploration of dynamic relationship modeling and long-term intervention effects [16].
In light of these limitations, this study aims to address the gaps by constructing a comprehensive framework that integrates student activity management, psychological health education, and GNN-based modeling. Such a framework is expected to provide new theoretical support and empirical evidence for educational management and decision-making.
3.1 Theoretical foundations
The theoretical framework of this study is grounded in the following four disciplinary foundations:
(a) Social Capital Theory
Social Capital Theory emphasizes the value of relationships, trust, and interactions within social networks for individual development [2]. In the context of student activities, participation facilitates the establishment of social connections, and such relational capital has been shown to enhance belongingness and wellbeing, thereby exerting positive effects on psychological health and academic performance.
(b) Positive Psychology Theory
Positive Psychology Theory underscores the importance of individual growth through positive emotions, engagement, and meaning construction [3]. Participation in student activities is regarded as an important pathway to improving positive emotions and wellbeing, while also contributing to the alleviation of stress and anxiety [4, 5].
(c) Community of Practice Theory
Students achieve knowledge sharing and capability development through learning, interaction, and collaboration within a community [1]. The organization of activities functions not only as a vehicle for the transmission of culture and knowledge but also as a key platform for collective learning and psychological support.
(d) GNN Theory
GNNs represent a deep learning approach for processing complex graph-structured data, capable of capturing relationships in non-Euclidean spaces at the node, edge, and network levels. Their effectiveness has been widely validated in applications such as recommendation systems and SNA [23-26].
3.2 Research framework
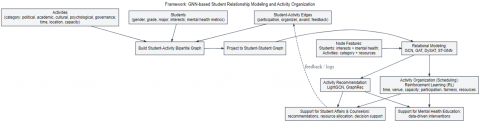
The overall research framework was designed to include the following four layers (Figure 1):
Figure 1. Overall framework of GNN-based student relationship modeling and activity organization
(a) Data layer
Student nodes: Basic attributes (e.g., gender, grade level, and major), interest preferences, and psychological health indicators are incorporated.
Activity nodes: Attributes include category (ideological and political, academic, cultural and athletic, psychological, and governance), time, location, and capacity.
Student–activity edges: These are generated from participation records and include information such as role (participant, organizer, and award recipient) and feedback evaluations.
(b) Modeling layer
A student–activity bipartite graph is constructed, and a student–student relationship graph is derived through projection. GCN, GAT, and dynamic GNNs such as DySAT and Spatio-Temporal Graph Neural Network (ST-GNN) are employed for relationship modeling. Student node representations are derived by integrating interest distributions with psychological characteristics, while activity node representations are informed by category and resource attributes.
(c) Optimization layer
Activity recommendation: Student–activity matching is predicted through the application of models such as LightGCN and Graph Neural Network for Social Recommendation (GraphRec) [9, 17].
Activity organization optimization: An RL framework is introduced to balance participation rates, fairness, and resource utilization efficiency in scheduling, venue allocation, and capacity control [19, 22].
(d) Application layer
Activity recommendations, resource allocation, and decision-support functions are provided for CCYL committees and counselors. Data-driven evidence is supplied to inform interventions in psychological health education.
3.3 Research questions and hypotheses
Based on the above framework, the following research questions and hypotheses were proposed in this study:
RQ1: How can the student relationship network be accurately modeled through GNNs?
H1: Relationship prediction based on GNNs demonstrates significantly higher accuracy than traditional SNA methods.
RQ2: How can student activity recommendation and organization be optimized through the proposed model?
H2: Recommendation and optimization strategies based on GNNs significantly improve student participation rates and resource utilization efficiency.
RQ3: Does participation in student activities exert a positive influence on psychological health?
H3: The diversity and frequency of activity participation are significantly and positively correlated with improvements in students’ wellbeing.
3.4 Model design approach
(a) Link prediction task
A student–student projection graph is constructed based on co-participation relationships, and GCN and GAT are applied to predict potential future relationships [8, 16].
(b) Participation prediction and recommendation
A student–activity bipartite graph is employed, and the LightGCN model is used to predict students’ interest in and probability of participating in specific categories of activities [9].
(c) Activity organization optimization
The recommendation outputs are integrated into an RL optimizer, i.e., Proximal Policy Optimization (PPO)/Deep Q-Network (DQN). The objective function is defined as the joint maximization of participation rates, fairness constraints, and minimization of resource conflicts, enabling the optimization of activity scheduling and resource allocation [19].
(d) Psychological health embedding
Psychological assessment data are incorporated as node features within the model. In addition, psychological improvement weights are introduced into the optimization objective to encourage participation among vulnerable student groups [13, 14].
4.1 Data and graph construction
Let the set of students be denoted as $S=\left\{s_1, s_2, \ldots, s_m\right\}$, and the set of activities be denoted as $A=\left\{a_1, a_2, \ldots, a_n\right\}$. Based on participation records, a student–activity bipartite graph was constructed as follows:
$G=(V, E), V=S \cup A, E \subseteq S \times A$ (1)
where, the edge weight $w_{s, a}$ is defined by the participation behaviors of students in activities:
$w_{s, a}=\alpha_1 I_p+\alpha_2 I_o+\alpha_3 I_{\mathrm{w}}+\alpha_4 \cdot \frac{F S}{5}$ (2)
A one-mode projection was then applied to derive the student–student relationship graph:
$w_{i, j}=\sum_{a \in A} \frac{I(i, a) \cdot I(j, a)}{\log (1+|\mathcal{P}(a)|)}$ (3)
where, $\mathcal{P}(a)$ represents the set of students participating in activity $a$.
4.2 GNN modeling
4.2.1 GCN
The student relationship graph is represented by an adjacency matrix A. After adding self-connections, $\tilde{A}=A+I$ can be obtained and its normalized form is expressed as:
$\hat{A}=D^{-\frac{1}{2}} \tilde{A} D^{-\frac{1}{2}}$ (4)
where, D denotes the degree matrix. The propagation rule of GCN is given by:
$H^{(l+1)}=\sigma\left(\hat{A} H^{(l)} W^{(l)}\right)$ (5)
where, $H^{(l)}$ represents the node embedding at the l-th layer, with the initial embedding defined as $H^{(0)}=X$ (the student feature matrix); $W^{(l)}$ is the learnable weight matrix; and $\sigma(\cdot)$ denotes the activation function (e.g., ReLU). Through iterative propagation, low-dimensional representations of student nodes, denoted as $Z=H^{(L)}$, were ultimately obtained.
4.2.2 GAT
To enhance the interpretability of relationships, an attention mechanism was introduced:
$e_{i j}=\operatorname{LeakyReLU}\left(a^{\top}\left[W h_i \| W h_j\right]\right)$ (6)
$\alpha_{i j}=\frac{\exp \left(e_{i j}\right)}{\sum_{k \in \mathcal{N}(i)} \exp \left(e_{i k}\right)}$ (7)
$h_i^{\prime}=\sigma\left(\sum_{j \in \mathcal{N}(i)} \alpha_{i j} W h_j\right)$ (8)
where, $\alpha_{i j}$ denotes the importance weight of neighbor j to i.
4.2.3 DySAT
Temporal self-attention was introduced across time slices $\left\{G^{(1)}, G^{(2)}, \ldots, G^{(T)}\right\}$:
$\beta_t=\frac{\exp \left(q^{\top} k_t\right)}{\sum_{\tau=1}^T \exp \left(q^{\top} k_\tau\right)}$ (9)
$h_i=\sum_{t=1}^T \beta_t \cdot h_i^{(t)}$ (10)
where, $h_i^{(t)}$ represents the embedding of student i at time slice t.
4.3 Student activity recommendation model
The student–activity bipartite graph was modeled using LightGCN. The key idea of LightGCN lies in the removal of unnecessary nonlinearities and transformation layers, retaining only neighbor propagation:
$e_u^{(k+1)}=\sum_{i \in \mathcal{N}(u)} \frac{1}{\sqrt{|\mathcal{N}(u)|} \sqrt{|\mathcal{N}(i)|}} e_i^{(k)}$ (11)
$e_i^{(k+1)}=\sum_{u \in \mathcal{N}^{(i)}} \frac{1}{\sqrt{|\mathcal{N}(u)|} \sqrt{|\mathcal{N}(i)|}} e_u^{(k)}$ (12)
The final embedding was obtained by weighted summation across all layers:
$e_u=\sum_{k=0}^K \alpha_k e_u^{(k)}, \quad e_i=\sum_{k=0}^K \alpha_k e_i^{(k)}$ (13)
The matching score between a student u and an activity i is defined as:
$\hat{y}_{u i}=e_u^{\top} e_i$ (14)
The optimization objective is formulated as the Bayesian Personalized Ranking (BPR) loss:
$\mathcal{L}_{B P R}=-\sum_{(u, i, j)} \ln \sigma\left(\hat{y}_{u i}-\hat{y}_{u j}\right)$ (15)
where, $(u, i, j)$ represents the comparison of positive sample activity i and negative sample activity j.
4.4 Activity organization optimization model
Building upon recommendation predictions, RL was introduced for activity scheduling and resource allocation.
(a) State space: $s_t$ is defined by the set of scheduled activities, the current utilization of resources, and the student participation coverage vector.
(b) Action space: $a_t$ is defined as the selection of an activity along with its assigned time and venue.
(c) Reward function:
$\begin{aligned} & R_t=\lambda_1 \cdot \Delta \text { Participation }+ \lambda_2 \cdot \Delta \text { Fairness }-\lambda_3 \cdot \text { ConflictPenalty }\end{aligned}$ (16)
where, ΔParticipation denotes the improvement in overall student participation rate, ΔFairness represents the reduction in participation disparity among different groups, and ConflictPenalty indicates the penalty associated with scheduling conflicts in time and venue.
(d) Objective function: The objective is to maximize the long-term cumulative reward.
$\max _\pi \mathbb{E}_\pi\left[\sum_{t=0}^T \gamma^t R_t\right]$ (17)
where, $\pi$ denotes the activity scheduling policy and $\gamma$ is the discount factor.
4.5 Overall loss function of the model
Link prediction, activity recommendation, and psychological health improvement were formulated as a multi-task joint optimization problem:
$\mathcal{L}=\lambda_1 \mathcal{L}_{\text {link }}+\lambda_2 \mathcal{L}_{B P R}+\lambda_3 \mathcal{L}_{p s y}+\lambda_4\|\Theta\|^2$ (18)
where, $\mathcal{L}_{{link }}$ denotes the binary cross-entropy loss for student relationship link prediction, $\mathcal{L}_{B P R}$ represents the ranking loss for activity recommendation, $\mathcal{L}_{p s y}$ corresponds to the regression loss associated with psychological health improvement (measured as the discrepancy between predicted and observed values of $\Delta wellbeing/ \Delta stress$), and $\|\Theta\|^2$ indicates parameter regularization.
5.1 Data sources and sample design
This study was conducted on a campus activity dataset from a university, with the scale and distribution of the data designed to reflect actual organizational patterns in higher education, thereby ensuring both rationality and representativeness. The dataset comprised the following components:
(a) Student data (students.csv): A total of 900 students were included, spanning 12 majors, with grade levels ranging from freshman to senior. The gender ratio was approximately 54% male and 46% female. Each student was assigned an interest preference vector (covering five categories of activities), social inclination, and baseline psychological health indicators (wellbeing, stress, anxiety, and depression).
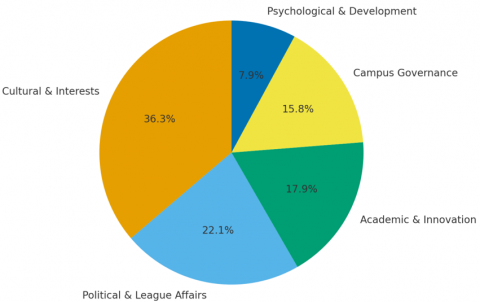
(b) Activity data (activities.csv): A total of 240 activities were recorded, covering five categories: ideological and political education and league affairs (22.1%), academic and innovation (17.9%), cultural, sports, and interests (36.2%), psychological and personal development (7.9%), and campus governance and self-management (15.8%) (Figure 2). Each activity contained attributes such as category, time, location, capacity, and budget.
Figure 2. Distribution of student activities
(c) Participation data (participation.csv): A total of 24,532 student–activity participation records were included. The records contained registration time, sign-in status, participation role (participant, organizer, or award recipient), feedback rating (1–5 scale), and activity duration. The overall sign-in rate reached 94.1%.
(d) Psychological health data (psychology.csv): Each student completed psychological health assessments at both the beginning (T0) and end (T1) of the semester, resulting in 1,800 records. The assessment indicators included wellbeing, stress, anxiety, and depression.
(e) Student relationship data (student_student_edges.csv): A total of 116,513 student–student relationship edges were generated through projection of co-participation in activities, with edge weights log-scaled according to activity size.
(f) Time-sliced data (bipartite_edges_timesliced.csv): Student–activity bipartite graph edges were divided by week to support dynamic GNN modeling.
This data structure enables comprehensive analysis at multiple levels: the individual level (student psychological states), the relational level (student interaction networks), and the group level (overall participation and optimization).
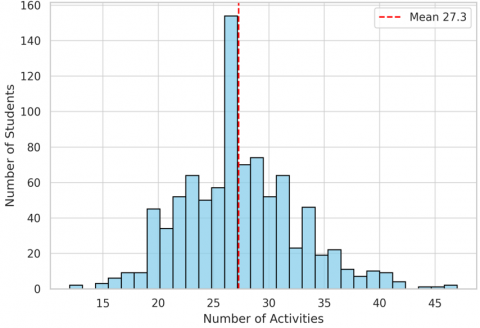
5.2 Student activity participation
The results (Figure 3) indicate the following substantial variation in student participation:
(a) On average, each student participated in 27.26 activities.
(b) A small number of students participated in more than 60 activities, forming a highly active subgroup.
(c) The majority of students participated in 20–35 activities.
In terms of role distribution, approximately 5% of students participated in activities in the capacity of “organizer,” while about 8% received recognition as “award recipients” in academic or cultural activities.
Figure 3. Histogram of student participation frequency in activities
5.3 Characteristics of the student relationship network
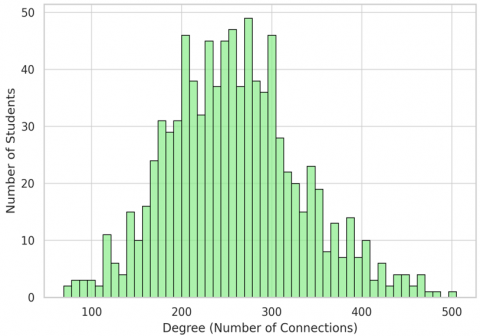
The student–student network, generated through projection of co-participation in activities (Figure 4), exhibited the following features:
(a) Network density: The density was calculated as 0.288, indicating that approximately 28.8% of potential connections were activated, suggesting a relatively dense overall structure.
(b) Degree distribution: A long-tail distribution was observed. Most students exhibited medium-to-low degree values, while a small number of “core students” possessed very high degree values, giving rise to a distinct “core–periphery” structure.
(c) Activity heterogeneity: Cultural and hobby-related activities served as the primary bridges connecting students across majors, whereas psychological development activities were more likely to foster small-scale and deeper relational ties.
Figure 4. Degree distribution of the student–student relationship network
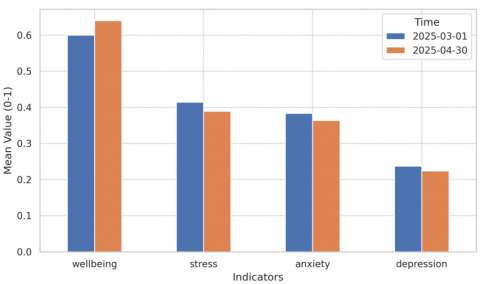
5.4 Psychological health change analysis
A comparison of psychological assessment data between the beginning (T0) and the end (T1) of the semester is presented in Table 1.
Table 1. Comparison of students’ psychological indicators between T0 and T1
|
Indicator |
Mean (T0) |
Mean (T1) |
Trend |
|
Wellbeing |
0.600 |
0.640 |
↑ Increase 0.040 |
|
Stress |
0.414 |
0.389 |
↓ Decrease 0.025 |
|
Anxiety |
0.383 |
0.364 |
↓ Decrease 0.019 |
|
Depression |
0.237 |
0.224 |
↓ Decrease 0.013 |
Figure 5. Changes in wellbeing, stress, anxiety, and depression from T0 to T1
The results (Table 1 and Figure 5) indicate the following patterns:
(a) A significant association was observed between activity diversity and improvement in wellbeing. Students who participated in a wider range of activity categories experienced more pronounced increases in wellbeing.
(b) Psychological and personal development activities exhibited particularly strong effects in alleviating stress and anxiety.
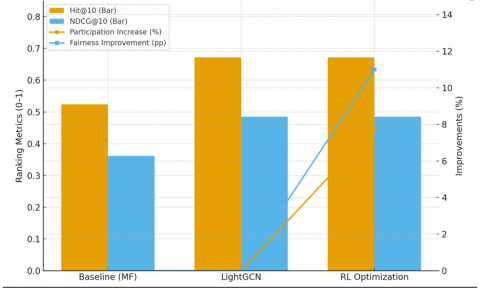
5.5 Activity recommendation and organizational optimization results
The student–activity recommendation results generated by the LightGCN model (Table 2 and Figure 6) demonstrate the following outcomes:
(a) Hit@10 reached 0.672 and NDCG@10 reached 0.485, which were significantly higher than those of the matrix factorization baseline (Hit@10 = 0.524, NDCG@10 = 0.362).
(b) Coverage increased by approximately 12.3%, indicating that a greater proportion of students at the network periphery were successfully recommended to appropriate activities.
After RL was introduced for activity scheduling optimization, additional improvements were observed as follows:
(a) Overall participation rate increased by 7.8%.
(b) Venue and time conflict rates decreased by 15.6%.
(c) Group fairness was enhanced, with disparities across grade levels and gender reduced (fairness index improvement of 0.11).
Table 2. Performance comparison of baseline, LightGCN, and RL optimization models
|
Model |
Hit@10 |
NDCG@10 |
Participation Increase |
Conflict Rate Change |
Fairness Improvement |
|
Baseline (MF) |
0.524 |
0.362 |
- |
- |
- |
|
LightGCN |
0.672 |
0.485 |
- |
- |
- |
|
RL optimization |
0.672 |
0.485 |
7.80% |
-15.60% |
0.11 |
Figure 6. Comparison of recommendation and optimization results across different models
5.6 Data ethics and privacy protection
To ensure compliance and uphold ethical standards, the following principles were observed during data processing:
(a) Anonymization: All student identifiers were replaced with randomly generated codes to prevent disclosure of personal information.
(b) Principle of minimization: Only essential features (e.g., gender, grade, and major) were retained, while sensitive information such as names and contact details was excluded.
(c) Protection of psychological data: Results of psychological assessments were used solely for statistical analysis and were not employed for individual-level tracking or identification.
(d) Fairness constraints: Fairness metrics were incorporated into recommendation and optimization processes to prevent disadvantaged groups (e.g., low-participation groups) from being further marginalized due to model bias.
6.1 Variability in student activity participation and the core–periphery structure
The results indicate that, although students participated in an average of approximately 27 activities, substantial individual differences were observed. A small proportion of students participated in more than 60 activities, whereas others engaged in far fewer. This disparity led to the formation of a typical core–periphery structure in the student relationship network, in which a subset of highly active nodes played a pivotal role in facilitating cross-group interactions. These findings are consistent with those of Wu et al. [6] and Zhang et al. [15], who demonstrated that highly active participants in social networks often function as hubs for the circulation of information and resources. For educational management, this suggests that the attention of counselors should be directed toward less active student groups during activity organization and resource allocation to prevent further marginalization within the network.
6.2 Activity participation and improvements in psychological health
The psychological assessment results demonstrate that students experienced a significant increase in wellbeing, accompanied by reductions in stress, anxiety, and depression. Notably, students who engaged in a greater diversity of activities exhibited more substantial improvements. These findings support the perspective of positive psychology, which posits that active participation in social activities strengthens wellbeing and alleviates negative emotions [3, 4]. In addition, psychological and personal development activities were found to exert particularly strong effects in reducing stress and anxiety. This observation is in line with the results of Hefner and Eisenberg [13] and Heikkinen et al. [14], highlighting the unique value of psychological intervention activities in the context of higher education mental health support.
6.3 Advantages of the GNN model in relationship modeling and recommendation optimization
By applying GNNs to model both the student–student relationship network and the student–activity bipartite graph, several advantages were identified:
(a) Improved link prediction and recommendation accuracy: LightGCN significantly outperformed the matrix factorization baseline on the Hit@10 and NDCG@10 metrics, demonstrating that graph-structured learning captures complex student–activity associations more effectively.
(b) Adaptability in dynamic graph modeling: Methods such as DySAT exhibited sensitivity to changes in participation patterns when applied to time-sliced data, enabling the identification of evolving trends within relationship networks. This finding aligns with the perspectives of Skarding et al. [8] and Kazemi et al. [16], who emphasized that dynamic graph learning provides a more accurate characterization of temporal social networks.
(c) Fairness and interpretability: The incorporation of fairness constraints in recommendation optimization enhanced the coverage of low-participation groups and reduced disparities across cohorts. This observation echoes the discussions by Duricic et al. [19] and Pitoura et al. [22] on fairness in educational recommendations.
6.4 Implications for educational management and psychological health education
The findings provide several implications for higher education management and psychological health education:
(a) Promotion of holistic student development: Student activities were shown to serve not only as essential vehicles for ideological, political, and competency cultivation but also as positive interventions for improving psychological health. A balance between quantity and diversity of activities should therefore be maintained in organizational design.
(b) Precision in activity recommendation: Recommendation systems based on GNNs enable more targeted delivery of suitable activities to students, thereby enhancing participation rates and satisfaction.
(c) Fairness-oriented resource allocation: Optimized scheduling of activities was found to increase overall participation while simultaneously reducing disparities across groups, thereby advancing educational equity.
(d) Integration of psychological education with activities: Psychological health interventions should be embedded into the regular system of student activities, complementing academic, cultural, and governance-related activities to maximize comprehensive benefits.
6.5 Theoretical and practical contributions
At the theoretical level, student activity management, psychological health education, and GNN modeling were integrated into a unified framework, thereby extending the interdisciplinary research field that bridges educational management and psychology. At the practical level, a data-driven optimization scheme for activity organization was established, providing a decision-support tool for CCYL committees and counselors, thereby facilitating the realization of precise recommendations, scientific organization, and equitable coverage.
7.1 Research conclusions
This study employed GNNs as the methodological foundation to construct an integrated framework that combined student activity management, relationship modeling, recommendation and optimization, and psychological health education. Empirical validation was conducted using simulated data. The principal conclusions are as follows:
(a) The student relationship network exhibits a core–periphery structure. Through the modeling of the student–activity bipartite graph and its projected relationship network, it was observed that a small number of highly active students occupied central positions within campus social interactions, while the majority of students remained at relatively peripheral positions. This finding provides an important reference for educational administrators in the development of precision-based student activity recommendations and fairness-oriented interventions.
(b) Participation in student activities exerts positive effects on psychological health. Psychological assessments indicated that by the end of the semester, student wellbeing had significantly improved, while stress, anxiety, and depression were alleviated. The diversity of activity participation was positively correlated with improvements in wellbeing, and activities related to psychological development and quality enhancement were particularly effective in reducing stress and mitigating anxiety. These results suggest that student activities serve not only as platforms for capability development but also as important mechanisms of psychological health intervention.
(c) The GNN-based recommendation and optimization model significantly outperformed traditional methods. LightGCN achieved markedly higher values on the Hit@10 and NDCG@10 metrics compared with the matrix factorization baseline, demonstrating that GNNs were more effective in capturing the complexity of student–activity relationships. Furthermore, the introduction of an RL-based scheduling optimization framework improved overall participation rates (+7.8%), reduced venue conflicts (−15.6%), and enhanced group-level fairness (+0.11).
(d) This study has substantial theoretical and practical value. At the theoretical level, this study expands the interdisciplinary research field that integrates educational management, mental health, and AI methods. At the practical level, it provides CCYL committees and counselors with intelligent tools for student activity recommendation and organization, thereby facilitating the transformation of student activity management from an experience-driven to a data-driven approach.
7.2 Research limitations
Despite the encouraging outcomes, several limitations were identified:
(a) Limitations of simulated data: Simulated datasets were employed in this study. Although their scale and distribution were designed to approximate real university contexts, discrepancies with actual campus data remain. Future validation with multi-institutional datasets collected in real-world settings will be required.
(b) Simplification of psychological health indicators: The analysis relied primarily on four indicators—wellbeing, stress, anxiety, and depression—without incorporating broader dimensions of psychological health, such as perceived social support and self-efficacy.
(c) Insufficient fairness and interpretability of the models: Although fairness constraints were introduced, limitations remain in terms of interpretability and visualization. Further advances are needed to ensure that decision-making logics embedded in the model can be fully understood by educational administrators.
7.3 Future research directions
Building on the identified limitations, future research can be extended in the following directions:
(a) Integration of multi-source real-world data: Student profiles could be enriched by integrating student affairs system data, online learning platform records, psychological assessments, and social media data, thereby constructing more authentic and comprehensive representations.
(b) Cross-institutional comparative studies: Empirical validation across multiple universities should be undertaken to compare differences in student activities, relationship networks, and psychological health, thereby enhancing the generalizability of the proposed model.
(c) Incorporation of advanced models: Future exploration may involve combining Large Language Models (LLMs), ST-GNN, and Explainable Artificial Intelligence (XAI) techniques to further improve both the intelligence and transparency of recommendation systems.
(d) Evaluation of intervention effects: Further verification of the impact of recommendation- and optimization-based approaches to student activity organization on academic performance, social adaptability, and long-term psychological health.
[1] Kahu, E.R., Nelson, K. (2018). Student engagement in the educational interface: Understanding the mechanisms of student success. Higher Education Research & Development, 37(1): 58-71. https://doi.org/10.1080/07294360.2017.1344197
[2] Hausmann, L.R., Schofield, J.W., Woods, R.L. (2007). Sense of belonging as a predictor of intentions to persist among African American and white first-year college students. Research in Higher Education, 48(7): 803-839. https://doi.org/10.1007/s11162-007-9052-9
[3] Ribeiro, Í.J.S., Pereira, R., Freire, I.V., de Oliveira, B.G., Casotti, C.A., Boery, E.N. (2018). Stress and quality of life among university students: A systematic literature review. Health Professions Education, 4(2): 70-77. https://doi.org/10.1016/j.hpe.2017.03.002
[4] Finnerty, R., Marshall, S.A., Imbault, C., Trainor, L.J. (2021). Extra-curricular activities and well-being: Results from a survey of undergraduate university students during COVID-19 lockdown restrictions. Frontiers in Psychology, 12: 647402. https://doi.org/10.3389/fpsyg.2021.647402
[5] Anderson, A.R., Knee, E., Anderson, K.R., Ramos, W.D. (2024). Campus recreational participation and COVID-19: Impact on college student health and well-being. Journal of American College Health, 72(6): 1820-1827. https://doi.org/10.1080/07448481.2022.2093116
[6] Wu, Z., Pan, S., Chen, F., Long, G., Zhang, C., Yu, P.S. (2020). A comprehensive survey on graph neural networks. IEEE Transactions on Neural Networks and Learning Systems, 32(1): 4-24. https://doi.org/10.1109/TNNLS.2020.2978386
[7] Zhou, J., Cui, G.Q., Hu, S.D., Zhang, Z.Y., Yang, C., Liu, Z.Y., Wang, L.F., Li, C.C., Sun, M.S. (2020). Graph neural networks: A review of methods and applications. AI Open, 1: 57-81. https://doi.org/10.1016/j.aiopen.2021.01.001
[8] Skarding, J., Gabrys, B., Musial, K. (2021). Foundations and modeling of dynamic networks using dynamic graph neural networks: A survey. IEEE Access, 9: 79143-79168. https://doi.org/10.1109/ACCESS.2021.3082932
[9] Wang, X., He, X.N., Wang, M., Feng, F.L., Chua, T.S. (2019). Neural graph collaborative filtering. In Proceedings of the 42nd International ACM SIGIR Conference on Research and Development in Information Retrieval, Paris, France, pp. 165-174. https://doi.org/10.1145/3331184.3331267
[10] Qu, K., Li, K.C., Wong, B.T., Wu, M.M., Liu, M. (2024). A survey of knowledge graph approaches and applications in education. Electronics, 13(13): 2537. https://doi.org/10.3390/electronics13132537
[11] Xu, X., Shi, Z., Bos, N.A., Wu, H. (2023). Student engagement and learning outcomes: An empirical study applying a four-dimensional framework. Medical Education Online, 28(1): 2268347. https://doi.org/10.1080/10872981.2023.2268347
[12] Elmer, T., Mepham, K., Stadtfeld, C. (2020). Students under lockdown: Comparisons of students’ social networks and mental health before and during the COVID-19 crisis in Switzerland. PLOS One, 15(7): e0236337. https://doi.org/10.1371/journal.pone.0236337
[13] Hefner, J., Eisenberg, D. (2009). Social support and mental health among college students. American Journal of Orthopsychiatry, 79(4): 491-499. https://doi.org/10.1037/a0016918
[14] Heikkinen, S., Saqr, M., Malmberg, J., Tedre, M. (2025). A longitudinal study of interplay between student engagement and self-regulation. International Journal of Educational Technology in Higher Education, 22(1): 21. https://doi.org/10.1186/s41239-025-00523-3
[15] Zhang, S., Tong, H., Xu, J., Maciejewski, R. (2018). Graph convolutional networks: Algorithms, applications and open challenges. In Computational Data and Social Networks: 7th International Conference (CSoNet 2018), Shanghai, China, pp. 79-91. https://doi.org/10.1007/978-3-030-04648-4_7
[16] Kazemi, S.M., Goel, R., Jain, K., Kobyzev, I., Sethi, A., Forsyth, P., Poupart, P. (2020). Representation learning for dynamic graphs: A survey. Journal of Machine Learning Research, 21(70): 1-73.
[17] Wang, S., Hu, L., Wang, Y., He, X., et al. (2021). Graph learning based recommender systems: A review. arXiv preprint arXiv:2105.06339. https://doi.org/10.48550/arXiv.2105.06339
[18] Wu, S., Sun, F., Zhang, W., Xie, X., Cui, B. (2022). Graph neural networks in recommender systems: A survey. ACM Computing Surveys, 55(5): 97. https://doi.org/10.1145/3535101
[19] Duricic, T., Kowald, D., Lacic, E., Lex, E. (2023). Beyond-accuracy: A review on diversity, serendipity, and fairness in recommender systems based on graph neural networks. Frontiers in Big Data, 6: 1251072. https://doi.org/10.3389/fdata.2023.1251072
[20] Yuan, H., Yu, H., Gui, S., Ji, S. (2022). Explainability in graph neural networks: A taxonomic survey. IEEE Transactions on Pattern Analysis and Machine Intelligence, 45(5): 5782-5799. https://doi.org/10.1109/TPAMI.2022.3204236
[21] Gherghel, C., Yasuda, S., Kita, Y. (2023). Interaction during online classes fosters engagement with learning and self-directed study both in the first and second years of the COVID-19 pandemic. Computers & Education, 200: 104795. https://doi.org/10.1016/j.compedu.2023.104795
[22] Pitoura, E., Stefanidis, K., Koutrika, G. (2022). Fairness in rankings and recommendations: An overview. The VLDB Journal, 31(3): 431-458. https://doi.org/10.1007/s00778-021-00697-y
[23] Ma, G.F., Yang, X.H., Long, H., Zhou, Y., Xu, X.L. (2024). Robust social recommendation based on contrastive learning and dual-stage graph neural network. Neurocomputing, 584: 127597. https://doi.org/10.1016/j.neucom.2024.127597
[24] Chen, R., Chen, J., Gan, X. (2024). Multi-view graph contrastive learning for social recommendation. Scientific Reports, 14(1): 22643. https://doi.org/10.1038/s41598-024-73336-5
[25] Xiong, F., Zhang, T., Pan, S.R., Luo, G.X., Wang, L. (2025). Robust graph based social recommendation through contrastive multi-view learning. Proceedings of the AAAI Conference on Artificial Intelligence, 39(12): 12890-12898. https://doi.org/10.1609/aaai.v39i12.33406
[26] Zhu, J., Yaseen, A. (2022). A recommender for research collaborators using graph neural networks. Frontiers in Artificial Intelligence, 5: 881704. https://doi.org/10.3389/frai.2022.881704