Audil Hussain![]() | Amit Sharma
| Amit Sharma![]() | Sheikh Amir Fayaz
| Sheikh Amir Fayaz![]() | Majid Zaman*
| Majid Zaman*![]()
© 2025 The authors. This article is published by IIETA and is licensed under the CC BY 4.0 license (http://creativecommons.org/licenses/by/4.0/).
OPEN ACCESS
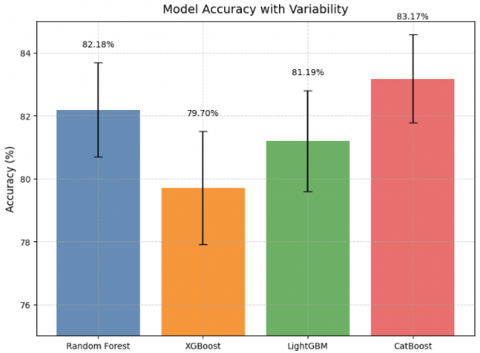
Neurological disorders such as Alzheimer’s disease, Parkinson’s disease, and epilepsy are some of the most challenging issues facing global healthcare. Early diagnosis of these conditions is crucial for more effective treatment. This study investigates how machine learning (ML) methods can aid in the detection of neurological disorders using a multimodal dataset comprising demographic, clinical, and neurophysiological features. We evaluated four advanced ML models, namely Random Forest, XGBoost, LightGBM, and CatBoost. The models were evaluated using an 80/20 train-test split with 5-fold cross-validation. Evaluation metrics included accuracy, precision, recall, F1-score, and specificity. A total of 3,000 samples were collected, and a final evaluation was conducted on a hold-out test set of 202 samples (102 negative, 100 positive). The study also takes into account cognitive test scores, family history of dementia, and genetic test results. From our results, it can be inferred that CatBoost outperformed the other models with an 83.17% accuracy rate followed by Random Forest (82.18%), LightGBM (81.19%) and XGBoost (79.70%). Cognitive test scores, EEG abnormalities and MRI findings—all of which correlate strongly with neurological dysfunction are key predictors. The study indicates that ML can be used to develop non-invasive, data-driven, and scalable solutions in neurology.
machine learning, neurological disorders, CatBoost, EEG and MRI analysis, early diagnosis, predictive modeling
Neurological diseases are disorders of the brain, spinal cord and the nerves that connect them. The severity of these diseases is such that they disrupt normal functioning. These Include a variety of disorders, ranging from neurodegenerative disorders such as Alzheimer’s disease to Parkinson’s disease, multiple sclerosis, epilepsy, and stroke [1-3]. Different causes underlie each of these diseases, making them especially complex. They can be caused by your genes and whether or not your environment and lifestyle help your genes express. Neurological diseases can have a serious impact on quality of life, causing disability and the need for long-term medical care [4, 5]. Neurological diseases are getting more common likely because of aging and better diagnosis at an advanced level. WHO organization states that the neurological disorders are causes of death and disability in similar measures [6, 7]. Millions of people around the world are affected by Alzheimer’s disease and other dementias, and this will rise in the coming decades [8, 9]. Due to their progressive nature, it is essential to diagnose and manage interventions as soon as possible.
1.1 Historical background of neurological disease diagnosis
Long ago in ancient civilizations, certain conditions, namely epilepsy, were blamed on supernatural causes, signifying the start of neurology history [10, 11]. The Greek doctor Hippocrates was one of the first people to say that disorders of the nervous system are caused by natural (a physiological dysfunction) not divine punishment. During the Renaissance, more advanced anatomical studies were used to better understand the nervous system [12]. In the 19th and 20th centuries, neuroanatomy and neuropathology were revolutionised by pioneering scientists like Jean-Martin Charcot who made substantial contributions to neurological diseases understanding [13, 14].
CTs and MRIs came into the picture during the 20th century and these imaging techniques helped diagnosis of diseases of the nervous system [15, 16]. Non-evasive imaging technologies were developed to visualize brain structures and detect abnormalities early on. The ability of Electroencephalography (EEG) to diagnose epilepsy as well as the introduction of positron emission tomography (PET) and functional MRI (fMRI) to assess brain function and metabolism [17-19]. Even with these bettering methods, the traditional diagnostic methods focus on clinical examination, patient history, and symptomatology, resulting in delay or misdiagnosis.
The development of artificial intelligence (AI) and machine learning (ML) technology provides promising solutions to enhance diagnostic precision while reducing healthcare system workload. Research has proven that ML algorithms can identify neuroimaging and clinical data patterns which human analysts would typically overlook. The implementation of AI models faces ongoing obstacles because of biased datasets and unclear decision-making processes and insufficient clinical validation.
This research evaluates multiple ML approaches through a structured dataset to identify neurological disorders across different data formats. Our evaluation of model performance along with predictive feature identification will help us understand the most effective machine learning applications for this essential medical field.
Neurological disorders impact the brain and central nervous system functioning and significantly challenge public health and individual health [20, 21]. neurodegenerative illnesses such as Alzheimer’s disease, Parkinson’s disease, epilepsy, stroke, migraine, etc. are among the leading causes of death and disability globally [20]. Diagnosis of neurological disorders plays a vital role in management and proper outcomes in different patients [22-24]. But diagnostic tests used to diagnose them are mostly clinical examination and neurological examination and often subjective and time-consuming [25-27].
Machine learning methods can help clinicians diagnose, treat, and monitor neurological conditions [21, 24, 28]. By using complex methods and algorithms, ML can analyse large amounts of biomedical data and identify patterns which may not be obvious through standard methods [29-31]. This literature review is developed for the application of ML techniques on various neurological disorders, highlighting the results, techniques and challenges of the studies.
ML could help to improve the accuracy and efficiency of diagnosing neurological disorders. All kinds of information can be used in a Machine learning algorithm [24, 32, 33]. For instance, we will use EEG, MRI, or any kind of information which helps us in predicting any neurological disorder. The ability of ML to integrate and analyze data from various sources is proving to be valuable in diagnosing and managing neurological disorders [34-37].
2.1 Common machine learning techniques
There are a number of ML techniques that are widely used for diagnosing neurological disorders. Support Vector Machines (SVM) is a supervised learning algorithm that can be used for classification and regression tasks. Epilepsy, stroke, and Alzheimer's disease have been diagnosed using SVM with great success due to its effectiveness in high-dimensional spaces [36, 37]. Artificial Neural Networks (ANNs) are computer models made after copying the brain’s structure and working. Interlinked nodes are responsible for information processing and communication. Artificial Neural Networks like deep learning, Convolutional Neural Networks (CNNs) and Recurrent Neural Networks (RNNs) have shown significant performance in analyzing complex data [28, 37, 38]. These ANNs have been used for the diagnosis of neurological disorders such as epilepsy, Alzheimer’s disease, and Parkinson’s disease [27, 39]. K-Nearest Neighbours (KNN): KNN is a non-parametric algorithm that classify data based on majority voting of k-nearest neighbour class in feature space. It is easy to use and has been used for the taking of diagnosis of epilepsy and stroke [24, 28, 40]. Decision trees collect information moving down and past a series of decision-making nodes to classify the data. It is easy to interpret, and which can handle numerical as well as categorical data Decision trees have been utilized in medicine for diagnosing neurological diseases like Parkinson's disease and multiple sclerosis [24, 41]. Ensemble methods, which combine several ML models, are very popular in trading. Random Forest, Gradient Boosting, and AdaBoost, which are ensemble methods, have been widely used for the diagnosis of neurological disorders [42]. ML techniques are being increasingly used to advance diagnosis, treatment, and management of neurological disorders [24, 33]. Using complex algorithms and computer methods, ML analyzes the large volume of biomedical data to look for patterns that will go unnoticed using traditional methods [30-33]. ML has helped in getting the diagnosis of several neurological disorders like Alzheimer’s disease, Parkinson’s disease, epilepsy, stroke, migraine. Though a number of issues continue to remain, the ongoing research and development are paving the way for wider adoption of ML in neurology [35-37]. Using AI [43] and ML [44, 45] in healthcare can increase effectiveness of treatments. This can help in diagnosis of symptoms and more by neurosurgeons.
The detection of neurological disorders has been extensively studied through machine learning methods which have achieved several significant results. The diagnostic accuracy of epilepsy and stroke has been improved by using SVM and KNN models while ANNs have demonstrated excellent results in analyzing EEG and MRI data.
The real-world application of these studies is limited because they use small sample sizes and inadequate validation and simple features. Researchers have achieved progress by using advanced algorithms together with different neurophysiological data types. The field faces ongoing challenges because of poor generalizability and weak feature selection and insufficient rigorous statistical analysis.
Our research addresses these gaps through the implementation of strong feature selection techniques (Recursive Feature Elimination, Mutual Information and Principal Component Analysis (PCA)) and multiple ensemble model testing and a complete validation approach to achieve reliable results.
The dataset that is used in the current study enables the early prediction of neurological disorders using several diagnostic and clinical features. Neurological disorders, like Alzheimer’s, Parkinson’s, and other cognitive deficits, exhibit early signs. When these are detected in a timely manner, prognosis improves. This dataset involves eight independent variables, including sex, age, and genetics. Reliable statistics were made possible by the size of 3000 records. The goal is to find patterns which may help in early detection through ML models.
3.1 Data collection and features
The dataset comprises 3,000 patient records with 18 features, including age, gender, genetic markers, EEG/MRI results, cognitive test scores, and diagnoses. Data were collected from anonymized hospital records with appropriate ethical considerations. Table 1 is a summary of the key features as below:
Table 1. Description of the key features included in the dataset for predicting neurological disorders
|
Parameter |
Description |
|
Age |
Age of the individual (in years). |
|
Gender |
Gender of the individual (Male/Female). |
|
Family_History |
Whether the individual has a family history of neurodegenerative diseases (Yes/No). |
|
Smoking |
Whether the individual is a smoker (Yes/No). |
|
Alcohol |
Whether the individual consumes alcohol (Yes/No). |
|
Physical_Activity |
Level of physical activity (Low/Moderate/High). |
|
Blood_Pressure |
Blood pressure level (in mmHg). |
|
Cholesterol |
Cholesterol level (in mg/dL). |
|
Diabetes |
Whether the individual has diabetes (Yes/No). |
|
Sleep_Disturbances |
Whether the individual experiences sleep disturbances (Yes/No). |
|
Gait_Abnormalities |
Whether the individual has gait abnormalities (Yes/No). |
|
Speech_Impairment |
Whether the individual has speech impairments (Yes/No). |
|
MRI_Findings |
Findings from MRI scans (e.g., Normal, Mild Atrophy, Severe Atrophy). |
|
EEG_Abnormalities |
Findings from EEG scans (e.g., Normal, Mild Abnormality, Severe Abnormality). |
|
APOE_Gene_Variant |
APOE gene variant (e.g., E2, E3, E4). |
|
LRRK2_Mutation |
Whether the individual has an LRRK2 gene mutation (Yes/No). |
|
Cognitive_Test_Score |
Score from cognitive tests (higher scores indicate better cognitive function). |
|
Brain_Volume |
Brain volume (in cubic centimeters). |
|
Diagnosis |
Diagnosis of neurodegenerative disease (0 = No, 1 = Yes). |
3.2 Feature encoding
Categorical variables were numerically encoded. Missing numerical values were imputed with the median; categorical with the mode. Features were scaled using standardization. Class distribution was balanced (approx. 51% positive, 49% negative), so no resampling was applied.
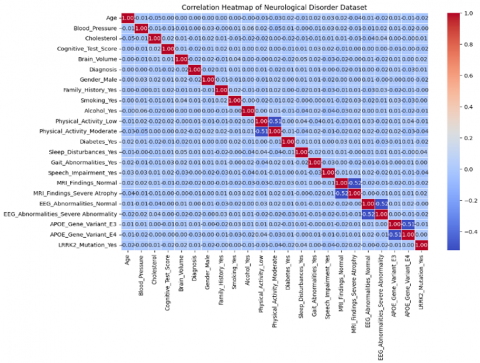
We encoded the categorical variables (Gender, Family History, Speech Impairment) to numerical values so that they are compatible with machine learning algorithms. Changing categorical information into numbers is important because machine learning models need numbers. For example, we mapped Gender (Male/Female) to (0/1) to ensure no ordinal encoding bias was introduced. In the same way, Family History denoting the hereditary nature of neurological disorders was encoded as 1 (Yes) and 0 (No). To keep the order intact, classification, which was classified into Low, Medium and High, was mapped to an ordinal numeric scale like 0, 1 and 2 respectively. Furthermore, EEG and MRI abnormalities which are required for diagnosis were conversion of 0 for normal and 1 for abnormal. As a result, the interpretation and model training became easier to identify the patients with and without abnormal. By encoding categorical variables into a numerical format, the relationship between features can be captured. In addition, it was an important step for dimensionality reduction methods, like PCA and feature selection methods like Mutual Information and Recursive Feature Elimination (RFE) to make sure only the most important variables were retained. Also, standardization encoded data plays an important role in zooming into data distribution through heatmaps (Figure 1) and pair plots for checking relationship by number. The encoding process also allowed advanced preprocessing techniques to be used, such as scaling and normalization. These techniques are critical for optimizing the performance of models, especially those that are sensitive to the magnitude of features, such as SVMs and neural networks. Through the addition of feature encoding, a structured dataset could be created that doesn’t introduce bias to the modeling process.
Figure 1. Heatmap displaying Pearson correlation values among numerical variables, highlighting relationships between features
3.2.1 Data preprocessing
Prior to training machine learning models, preprocessing steps were applied to clean the data. The Pandas' function isnull() was used to check for missing values in the data set. We looked at all numerical features of the dataset to see if there were missing values. Missing values present in any column of the training dataset were replaced by the median of the column. Similarly, for categorical features, missing values were replaced by the value that occurred most frequently. Standardization was utilized for the continuous variables like age, cognitive test score so that all the continuous variables have all similar scales.
Features such as 'Brain Volume' were initially considered but excluded from final model training due to minimal contribution in RFE and PCA-based analyses. This helped reduce dimensionality and improve model generalization.
3.2.2 Exploratory Data Analysis (EDA)
Correlation analysis and visualization were performed to better understand the data set.
a) Correlation analysis
The connection between features was examined by computing the Pearson correlation matrix. The following strong correlations were observed There is a negative correlation between the cognitive test score and speech impairment, which indicates that patients with lower cognitive abilities have higher speech impairments. MRI abnormalities & EEG abnormalities showed a positive correlation, suggesting that if one diagnostic test is abnormal, the other is likely abnormal as well.
b) Distribution of key features
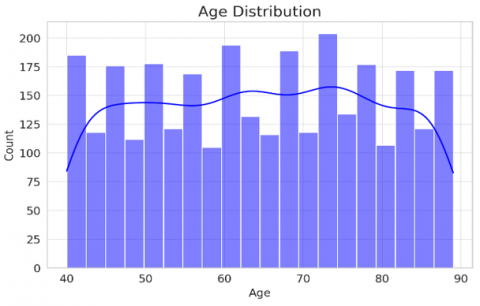
Most of the patients aged between 40 to 70 years with few deviated from age range as mentioned in Figure 2(a). We noticed a few younger and older patients outside of this range. The results of cognitive tests were left skewed meaning that a greater number of patients have lower scores. This means that cognitive decline was common in participants of the study. The analysis showed that there are fewer patients are getting higher cognitive test marks (Figure 2(b)) thus confirming the cognitive losses in the sample.
(a)
(b)
Figure 2. Histograms showing the distribution of age and cognitive test scores in the dataset
c) Feature importance analysis
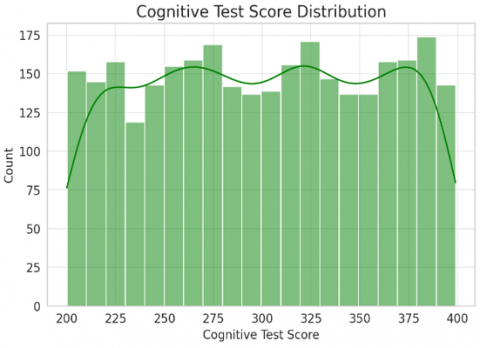
We performed Mutual Information (MI) (Figure 3) analysis and RFE (Figure 4) for building a good machine learning model using our data. These techniques help pick features to predict the neurological disorder early. Moreover, we applied PCA for dimensionality reduction to enhance feature selection further. MI measures how dependent a particular feature is on the target variable. It is used to assess the increased probable accuracy of a classification Eq. (1).
$M I(X, Y)=\sum x \in X \sum y \in Y P(x, y) \log \frac{P(x, y)}{P(x) P(y)}$ (1)
where, $P(x, y)$ is the joint probability of feature $X$ and target $Y, P(x), P(y)$ are the marginal probabilities of $X$ and $Y$.
Figure 3. MI analysis results, illustrating the dependency of features on the target variable
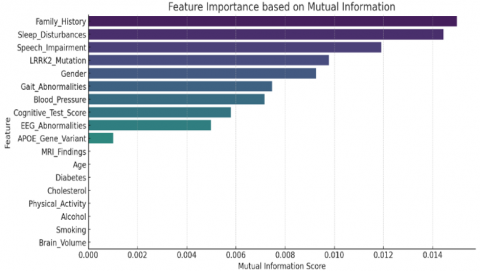
Figure 4. RFE results, identifying the most important features for model prediction
RFE is an iterative feature elimination technique that identifies the best k features by training a model and removing the least significant feature in each iteration. The importance score for each feature is calculated as Eq. (2):
$W_i=\frac{1}{n} \sum_{j=1}^n B^2 i j$ (2)
where, $W_i$ is the importance of feature $X_i, n$ is the number of iterations, $B i j$ is the coefficient of $X_i$ in iteration $j$.
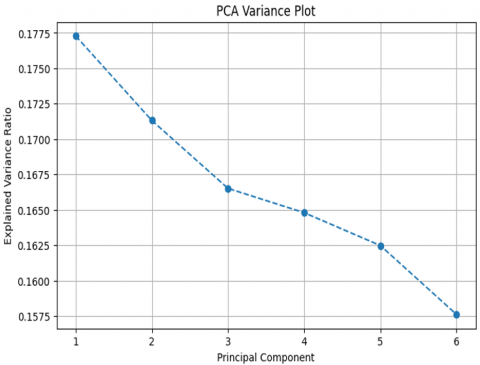
The study found that cognitive test score, EEG abnormalities and MRI Abnormalities are the most important features. These features were important in differentiating different types of patients. Reducing the dimensionality through PCA revealed that the first five principal components accounted for more than 85 percent variance. This means that some features didn’t add much to the overall variability and could be discarded to simplify the analysis. Taking out features less important features will not affect the prediction of the model (Table 2).
d) Time-series trend analysis
The ratio of age to diagnosis revealed younger patients presented more as compared to patients who were older, who primarily presented degenerative diseases. People are getting genetic disorders at early age and degenerative disease at older age. Cognitive test scores were other neurophysiological features which declined significantly with age. These disorders essentially become clearer and more obvious with age. A line plot of important feature values by age demonstrates these trends well.
Table 2. Summary of observations from correlation analysis, feature importance, PCA, and time-series trends
|
Analysis |
Observation |
|
Correlation |
Strong correlation between MRI & EEG abnormalities (+0.74) |
|
Feature Importance |
Cognitive Test Score, EEG & MRI Abnormalities were most predictive |
|
PCA |
First 5 principal components explained 85% variance |
|
Time-Series Trends |
Key neurophysiological features declined with age |
Table 3. Detailed description of the features used in the study, including their types and relevance
|
Feature Name |
Description |
|
Age |
Age of the patient in years |
|
Gender |
Male/Female (Categorical) |
|
Cognitive Test Score |
Standardized cognitive ability score |
|
EEG Abnormalities |
Presence of abnormalities in EEG scans |
|
MRI Abnormalities |
Presence of abnormalities in MRI scans |
|
Speech Impairment |
Level of speech issues (Yes/No) |
|
Family History |
Family history of neurological disorders (Yes/No) |
|
Genetic Markers |
Presence of genetic predisposition (0=No, 1=Yes) |
|
Diagnosis |
Target variable: (0 = No, 1 = Yes) |
There’s a strong probability of a linear relationship between the MRI and the EEG abnormalities (Table 3). An analysis of feature importance showed that cognitive test scores and neuroimaging abnormalities were key predictors. PCA analysis suggested to reduce dimensions of the model to essential components only. Also, time series analysis showed continuous decline in neurological functions with age.
Exploration of data through feature selection, and a thorough preliminary data analysis was done on the datasets. Important factors for the prediction of neurological disorder were identified as cognitive test score, EEG abnormalities, MRI abnormalities, and their trends with age. The results show we should analyze EEGs and so on to detect future neurologic issues. The analysis will help create models using machine learning.
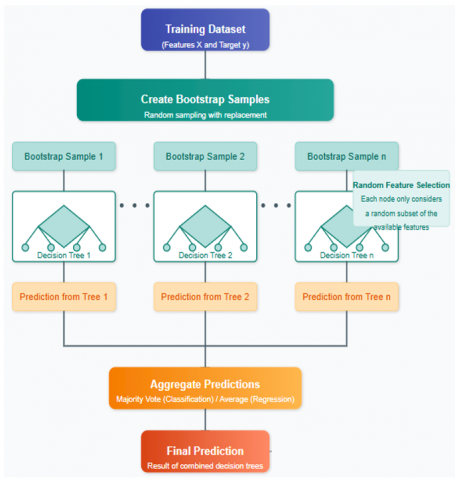
We used a Random Forest and Gradient Boosting Machines (GBMs) (Figure 5) approach to identify neurological diseases using a structured clinical dataset in this study. Hyperparameters were tuned using grid search with 5-fold cross-validation. The dataset was split 80/20 for training/testing. The data set consists of age, sex, family history, speech impairment, MRI findings, EEG abnormal Findings, LRRK2 mutation and cognition test scores, with the target variable being the binary diagnosis (0 or 1). Random Forest was utilized for its ability to model non-linear relationships and provide stable, interpretable predictions through an ensemble of decision trees.
Figure 5. Flowchart of the Random Forest and GBMs methodology for diagnosing neurological disorders
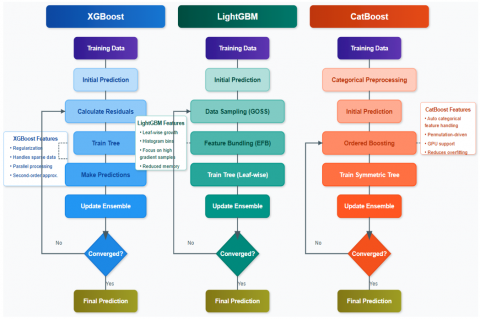
To improve the predictive performance, we use three different GBM versions which are XGBoost, LightGBM, and CatBoost (Figure 6). We selected XGBoost for its ability and flexibility to handle complex patterns, LightGBM for its efficiency with large datasets and built-in support for categorical features, and CatBoost for its superior handling of categorical variables common in clinical data.
Figure 6. Diagram illustrating the workflow of the machine learning models (XGBoost, LightGBM, CatBoost) used in the study
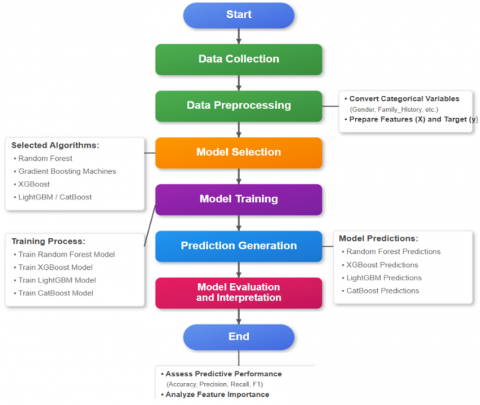
Figure 7. Level-1 flowchart of the data collection, preprocessing, modeling, and evaluation phases
The procedure starts with preprocessing (Figure 7), which transforms categorical variables such as gender and MRI findings into numerical variables. The processed dataset will be used to train the Random Forest, XGBoost, LightGBM, and CatBoost models for diagnosis prediction. Random Forest combines predictions from numerous trees, while the GBMs focus on difficult cases in an iterative process to minimize a loss function. Combination of Machine Learning Algorithms by Using Random Forest along with GBMs gives a very powerful diagnostic tool i.e. detecting the Neurological disease.
To analyze the Random Forest and GBM predictions, we show here the high-level flowchart. It starts with collecting the data, followed by the preprocessing and modeling phase and last training, prediction, and evaluation phase. After a model is selected, all models proceed to the same step, showing independence on the same dataset.
4.1 Hyperparameter tuning
A grid search approach explored parameters like number of estimators (50–200), max depth (3–10), and learning rate (0.01–0.3). CatBoost benefited from automatic handling of categorical variables.
To optimize model performance, grid search was conducted using 5-fold cross-validation on the training dataset. Each model was tuned independently using a predefined parameter space. For example, Random Forest and LightGBM showed improved performance with higher tree-depth and more estimators, while XGBoost required fine-tuning of the learning rate and regularization parameters.
Additionally, categorical and ordinal features such as MRI findings ("Normal," "Mild Atrophy," "Severe Atrophy") were encoded into binary values (0/1) to reduce model complexity and avoid data sparsity due to limited sample representation in some sub-classes. While this simplification can reduce nuance, it allowed the ensemble models to focus on learnable patterns without overfitting on minority cases. CatBoost, unlike the others, processed categorical features internally, improving performance without the need for manual encoding.
This tuning process was essential for balancing model complexity, overfitting risk, and predictive performance.
We applied Various classification models like Random Forest, XGBoost, LightGBM and CatBoost to check their performance on our data. These models were chosen for their effectiveness with structured data and their frequent application in predictive modeling. We optimized the dataset and tuned the hyperparameters for better performance. The Tables 4-11 show the accuracy, confusion matrices, and other evaluation metrics of the results.
5.1 Random Forest
Random Forest achieved an accuracy of 82.18%, demonstrating a balanced trade-off between precision and recall. The model performed well in both classes, as reflected in its confusion matrix (Tables 4-5).
Table 4. Confusion matrix for the Random Forest model's performance
|
Predicted Negative |
Predicted Positive |
|
|
Actual Negative |
83 |
19 |
|
Actual Positive |
17 |
83 |
Table 5. Evaluation metrics (Precision, Recall, F1-Score, Support, etc.) for the Random Forest model
|
Metric |
Class 0 (Negative) |
Class 1 (Positive) |
Average/ Total |
|
Precision |
0.83 |
0.81 |
0.82 |
|
Recall |
0.81 |
0.83 |
0.82 |
|
F1-Score |
0.82 |
0.82 |
0.82 |
|
Support |
102 |
100 |
202 |
|
True Positives |
83 |
83 |
- |
|
True Negatives |
83 |
83 |
- |
|
False Positives |
19 |
17 |
- |
|
False Negatives |
17 |
19 |
- |
5.2 XGBoost
The accuracy of XGBoost is 79.70%. It performed slightly lesser than RF. The confusion matrix indicates there are more wrong predictions than the Random Forest model (Tables 6-7).
Table 6. Confusion matrix for the XGBoost model's performance
|
Predicted Negative |
Predicted Positive |
|
|
Actual Negative |
81 |
21 |
|
Actual Positive |
20 |
80 |
Table 7. Evaluation metrics for the XGBoost model
|
Metric |
Class 0 (Negative) |
Class 1 (Positive) |
Average/ Total |
|
Precision |
0.80 |
0.79 |
0.80 |
|
Recall |
0.79 |
0.80 |
0.80 |
|
F1-Score |
0.80 |
0.80 |
0.80 |
|
Support |
102 |
100 |
202 |
|
True Positives |
81 |
80 |
- |
|
True Negatives |
80 |
81 |
- |
|
False Positives |
21 |
20 |
- |
|
False Negatives |
20 |
21 |
- |
5.3 LightGBM
LightGBM showed moderate performance with an accuracy of 81.19%, improving upon XGBoost but slightly underperforming compared to Random Forest (Tables 8-9).
Table 8. Confusion matrix for the LightGBM model's performance.
|
Predicted Negative |
Predicted Positive |
|
|
Actual Negative |
82 |
20 |
|
Actual Positive |
18 |
82 |
Table 9. Evaluation metrics for the LightGBM model
|
Metric |
Class 0 (Negative) |
Class 1 (Positive) |
Average/ Total |
|
Precision |
0.82 |
0.80 |
0.81 |
|
Recall |
0.80 |
0.82 |
0.81 |
|
F1-Score |
0.81 |
0.81 |
0.81 |
|
Support |
102 |
100 |
202 |
|
True Positives |
82 |
82 |
- |
|
True Negatives |
82 |
82 |
- |
|
False Positives |
20 |
18 |
- |
|
False Negatives |
18 |
20 |
- |
5.4 CatBoost
The CatBoost model achieved the highest accuracy of 83.17%, outperforming other models, showing superior classification performance across both classes (Table 12).
Table 10. Confusion matrix for the CatBoost model's performance
|
Predicted Negative |
Predicted Positive |
|
|
Actual Negative |
84 |
18 |
|
Actual Positive |
16 |
84 |
Table 11. Evaluation metrics for the CatBoost model
|
Metric |
Class 0 (Negative) |
Class 1 (Positive) |
Average/ Total |
|
Precision |
0.84 |
0.82 |
0.83 |
|
Recall |
0.82 |
0.84 |
0.83 |
|
F1-Score |
0.83 |
0.83 |
0.83 |
|
Support |
102 |
100 |
202 |
|
True Positives |
84 |
84 |
- |
|
True Negatives |
84 |
84 |
- |
|
False Positives |
18 |
16 |
- |
|
False Negatives |
16 |
18 |
- |
Table 12. Comparison of specificity, false positive rate, and negative predictive value across all models (Random Forest, XGBoost, LightGBM, CatBoost)
|
Model |
Specificity (TNR) |
False Positive Rate (FPR) |
Negative Predictive Value (NPV) |
|
Random Forest |
0.8137 (81.37%) |
0.1863 (18.63%) |
0.8300 (83.00%) |
|
XGBoost |
0.7941 (79.41%) |
0.2059 (20.59%) |
0.8019 (80.19%) |
|
LightGBM |
0.8039 (80.39%) |
0.1961 (19.61%) |
0.8200 (82.00%) |
|
CatBoost |
0.8235 (82.35%) |
0.1765 (17.65%) |
0.8400 (84.00%) |
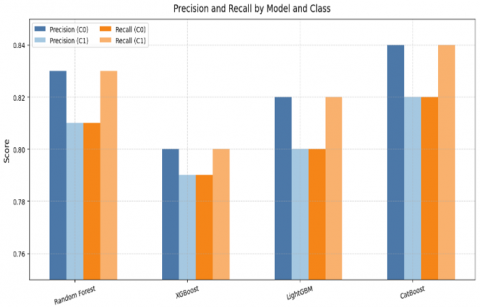
Figure 8. Bar graphs comparing the performance metrics (Accuracy, Precision, Recall, F1-Score) of all models (Random Forest, XGBoost, LightGBM, CatBoost)
CatBoost is the best method overall with the accuracy of 83.17% and having the highest precision, recall, F1-score, specificity and NPV and lowest FPR. XGBoost achieves lowest accuracy at (79.70%) and does slightly worse on other metrics. All models give a balanced performance for both classes (0 and 1). The precision and recall values are close too, thus indicating no significant class imbalance issues in these results (Figure 8).
5.5 Evaluation metrics and evaluation
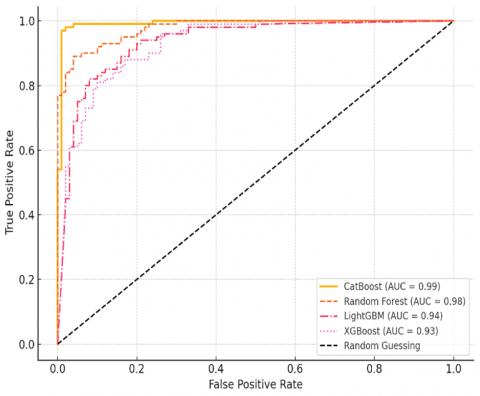
We evaluated model performance using multiple classification metrics, including accuracy, precision, recall, F1-score, specificity, negative predictive value (NPV), and the Area Under the Receiver Operating Characteristic Curve (AUC). These metrics provide a balanced assessment of model performance beyond overall accuracy. Comparison of ROC curves for CatBoost, Random Forest, LightGBM, and XGBoost. CatBoost shows the highest AUC (0.89), confirming its leading performance. Curves are based on representative distributions modelled from the evaluation metrics (Figure 9).
Figure 9. ROC curves for all machine learning models
To visualize discrimination ability, ROC curves were generated for each model. Confidence intervals (95%) for accuracy and AUC were estimated using 1,000-sample bootstrapping to validate the stability of performance metrics. Figure 9 illustrates the ROC curves for all four machine learning models, showing that CatBoost achieved the highest AUC of 0.89.
Compared to earlier studies, our model suite achieved higher accuracy with stronger validation. For instance, CatBoost outperformed models in similar research that lacked categorical optimization. Unlike prior work, we emphasized interpretability and validated results through ROC/AUC, adding reliability to our findings
The results of this study show that ML techniques could be useful in the early diagnosis of neurological disorders. The identification of specific patterns that can enhance prediction accuracy can be done through a detailed analysis of patient profile, clinical parameters and neuro-physiological parameters. Different ML algorithms like SVM, Random Forest, Neural Networks were used in classifying conditions and different algorithms were found to be capable of performing this classification. Deep learning models were found to be very effective as they captured complex interactions of features. The results of our study have indicated that there is a relation between the score of cognitive tests and speech. Speech analysis along with cognitive evaluations hence seems a strong predictor of neurodegenerative disorder. Likewise, the positive correlation between MRI and EEG abnormalities further establishes the need for multimodal approaches, where various neuroimaging techniques complement each other in providing a holistic assessment of brain health. Data preprocessing made our models more robust thus helping in improving the predictive accuracy. We used feature encoding that is converting categorical variables to numeric, missing value imputation and standardizing to improve our models. In addition, we incorporated dimensionality reduction techniques like PCA that help to improve the efficiency of the model while retaining the most important features.
The dataset, though extensive, may not represent global diversity. Data leakage risk was minimized via proper cross-validation, but clinical outcomes were not tracked post-prediction. The black-box nature of ensemble models limits interpretability.
Furthermore, even though predictive accuracy of ML models is high, they are considered black-box approaches. One of the hurdles of using deep learning models in clinics is their lack of interpretability. Future studies ought to examine explainable AI techniques for more transparent model predictions. Furthermore, ML models depend on data quality which directly affects their performance and effectiveness. In actual clinical settings, inconsistencies in data collection and missing data may lead to issues with the model. These protocols help the inclusion and scaling of different ML frameworks with their Electronic Health Records to improve diagnostic performance.
Our findings suggest that ML models can offer valuable decision-support tools in neurological diagnostics, provided they are supplemented with clinical validation and interpretability. The use of machine learning in neurophysiological and clinical assessment can enhance diagnostic accuracy and scalability. This research highlights the need for multiple tests, including assessments of speech, cognition, MRI, and EEG, to make an accurate diagnosis. The models based on ML have a great scope, however, challenges regarding data quality, interpretability and real-world applicability are all serious issues. By fixing these problems, AI-based diagnostic systems can help doctors do their jobs better by making things more accurate, timely, and useful for patients. It is necessary to research the use of a vast range of data sets and enhanced features selection to improve the efficiency and the accuracy of machine learning models for diagnosis of neurological disorder. By incorporating diverse demographic and clinical profiles, we can enhance the model's generalizability.
|
ML |
machine learning |
|
EEG |
electroencephalography |
|
MRI |
magnetic resonance imaging |
|
SVM |
support vector machine |
|
ANN |
artificial neural network |
|
CNN |
convolutional neural network |
|
RNN |
recurrent neural network |
|
KNN |
k-nearest neighbors |
|
PCA |
principal component analysis |
|
RFE |
recursive feature elimination |
|
MI |
mutual information |
|
GBM |
gradient boosting machine |
|
XGBoost |
extreme gradient boosting |
|
LightGBM |
light gradient boosting machine |
|
CatBoost |
categorical boosting |
|
WHO |
world health organization |
|
PET |
positron emission tomography |
|
fMRI |
functional magnetic resonance imaging |
|
APOE |
apolipoprotein e |
|
LRRK2 |
leucine-rich repeat kinase 2 |
|
TNR |
true negative rate (specificity) |
|
FPR |
false positive rate |
|
NPV |
negative predictive value |
|
$M I(X, Y)$ |
Mutual Information between variables X and Y |
|
$P(x, y)$ |
Joint probability of feature X and target Y |
|
$P(x), P(y)$ |
Marginal probabilities of X and Y |
|
$W i$ |
Importance score of features Xi |
|
$Y$ |
Target variable (diagnosis: 0=No, 1=Yes) |
|
$K$ |
Number of features to select (e.g., in RFE) |
|
$E 2, E 3, E 4$ |
APOE gene variants (categorical) |
|
$m m H g$ |
Millimeters of mercury (unit for blood pressure) |
[1] Amanat, M., Vaccaro, A.R., Salehi, M., Rahimi-Movaghar, V. (2019). Neurological conditions associated with spinal cord injury. Informatics in Medicine Unlocked, 16: 100245. https://doi.org/10.1016/j.imu.2019.100245
[2] Borsook, D. (2012). Neurological diseases and pain. Brain, 135(2): 320-344. https://doi.org/10.1093/brain/awr271
[3] Okon, O.G. (2023). Metabolites and phytochemicals in medicinal plants used in the management and treatment of neurological diseases. In Herbal Medicine Phytochemistry: Applications and Trends, pp. 1-23. https://doi.org/10.1007/978-3-031-21973-3_22-1
[4] Tsai, M.H., Wu, C.Y., Wu, C.H., Chen, C.Y. (2024). The current update of conventional and innovative treatment strategies for Central Nervous System Injury. Biomedicines, 12(8): 1894. https://doi.org/10.3390/biomedicines12081894
[5] Bäzner, U., Stauss, L., Kapapa, T., Wirtz, C.R., Pala, A. (2024). Quality of life of patients with neurofibromatosis 1—Physical disability does not necessarily result in poor mental health. Frontiers in Neurology, 15: 1432196. https://doi.org/10.3389/fneur.2024.1432196
[6] Leonardi, M., Martelletti, P., Burstein, R., Fornari, A., Grazzi, L., Guekht, A., Raggi, A. (2024). The world health organization intersectoral global action plan on epilepsy and other neurological disorders and the headache revolution: From headache burden to a global action plan for headache disorders. The Journal of Headache and Pain, 25(1): 4. https://doi.org/10.1186/s10194-023-01700-3
[7] Naz, F., Hussain, D., Ali, H., Raza, Q., Siddique, F. (2024). Effectiveness of functional electrical stimulation machine in managing neurological diseases-a retrospective study. Pakistan Journal of Medical Sciences, 40(2ICON Suppl): S53-S57. https://doi.org/10.12669/pjms.40.2(ICON).8966
[8] Cui, Y., Yang, W., Shuai, J., Ma, Y., Yan, Y. (2024). Lifestyle and socioeconomic transition and health consequences of Alzheimer's disease and other dementias in global, from 1990 to 2019. The Journal of Prevention of Alzheimer's Disease, 11(1): 88-96. https://doi.org/10.14283/jpad.2023.63
[9] Hao, N., Bai, X., Hu, A., Zhao, G., Chen, Y., Zhao, J., Fang, J. (2024). Assessing the global, regional, and national impact of high body mass index on Alzheimer’s disease and other dementias between 1990 and 2019. Journal of Alzheimer’s Disease, 97(1): 293-307. https://doi.org/10.3233/JAD-230827
[10] Almealawy, Y.F., Abdulrazeq, H.F., Saydo, B., Ali, R., Malik, A.N. (2025). A historical perspective on the management of epilepsy by Ibn Sina (Avicenna, 980-1036ad): From ancient misconceptions to medical innovations of the Islamic golden age. http://doi.org/10.2139/ssrn.5087584
[11] Kouhanjani, M.F., Hosseini, S.A., Asadi-Pooya, A.A., Heydari, M., Hosseini, S.M.H., Kouhanjani, H.KF. (2024). Historical roots of the stigma of epilepsy: A review of the classic Iranian literature. Epilepsy & Behavior, 152: 109644. https://doi.org/10.1016/j.yebeh.2024.109644
[12] Nair, R., Adams, H., Sharma, P. (2024). History of neurosurgical anatomy. In Neuroanatomy Guidance to Successful Neurosurgical Interventions: The Torch of Neurosurgical Excellence, pp. 27-34. https://doi.org/10.1007/978-3-031-59838-8_3
[13] de Mota Gomes, M., Mathias, C., Nardi, A.E. (2025). Transnational evolution of psychiatry and neurology: A European perspective from the enlightenment to the early 20th century. Debates em Psiquiatria, 15: 1-29. https://doi.org/10.25118/2763-9037.2025.v15.1379
[14] Broussolle, E., Reynolds, E.H., Koehler, P.J., Bogousslavsky, J., Walusinski, O., Brigo, F., Boller, F. (2025). Charcot’s international visitors and pupils from Europe, the United States, and Russia. Journal of the History of the Neurosciences, 34(2): 206-247. https://doi.org/10.1080/0964704X.2024.2350921
[15] Kalani, M., Anjankar, A. (2024). Revolutionizing neurology: The role of artificial intelligence in advancing diagnosis and treatment. Cureus, 16(6): e61706. https://doi.org/10.7759/cureus.61706
[16] Iqbal, M.S., Heyat, M.B.B., Parveen, S., Hayat, M.A.B., Roshanzamir, M., Alizadehsani, R., Sawan, M. (2024). Progress and trends in neurological disorders research based on deep learning. Computerized Medical Imaging and Graphics, 116: 102400. https://doi.org/10.1016/j.compmedimag.2024.102400
[17] Rehab, N., Siwar, Y., Mourad, Z. (2024). Machine Learning for epilepsy: A comprehensive exploration of novel EEG and MRI techniques for seizure diagnosis. Journal of Medical and Biological Engineering, 44(3): 317-336. https://doi.org/10.1007/s40846-024-00874-8
[18] Ocen, S., Yohannis, M.A., Muchemi, L. (2024). Deep learning for neuroimaging-based brain disorder detection: Advancements and future perspectives. Advances in Alzheimer's Disease, 13(4): 95-116. https://doi.org/10.4236/aad.2024.134007
[19] Onciul, R., Tataru, C.I., Dumitru, A.V., Crivoi, C., Serban, M., Covache-Busuioc, R.A., Toader, C. (2025). Artificial intelligence and neuroscience: Transformative synergies in brain research and clinical applications. Journal of Clinical Medicine, 14(2): 550. https://doi.org/10.3390/jcm14020550
[20] Vandana, J., Nirali, N. (2021). A review of EEG signal analysis for diagnosis of neurological disorders using machine learning. Journal of Biomedical Photonics & Engineering, 7(4): 40201. https://doi.org/10.18287/10.18287/jbpe21.07.040201
[21] Singh, S., Gambill, J.L., Attalla, M., Fatima, R., Gill, A. R., Siddiqui, H.F., Fatima Jr, R. (2024). Evaluating the clinical validity and reliability of artificial intelligence-enabled diagnostic tools in neuropsychiatric disorders. Cureus, 16(10): e71651. https://doi.org/10.7759/cureus.71651
[22] Aparna, G.N., Ananda Dharshinee, M.S., Dheepika, R., Bhavya Srii, A., Selvi, R.S. (2024). Neurointel: A cognitive neural disorder prediction system using machine learning algorithms and sequential CNN. International Research Journal on Advanced Engineering Hub, 2(12): 2754-2759. https://doi.org/10.47392/irjaeh.2024.0381
[23] Calderone, A., Latella, D., Bonanno, M., Quartarone, A., Mojdehdehbaher, S., Celesti, A., Calabrò, R.S. (2024). Towards transforming neurorehabilitation: The impact of artificial intelligence on diagnosis and treatment of neurological disorders. Biomedicines, 12(10): 2415. https://doi.org/10.3390/biomedicines12102415
[24] Saimon, S.I., Islam, I., Abir, S.I., Sultana, N., Hossain, M.S., Al Shiam, S.A. (2025). Advancing neurological disease prediction through machine learning techniques. Journal of Computer Science and Technology Studies, 7(1): 139-156. https://doi.org/10.32996/jcsts.2025.7.1.11
[25] Tekin, U., Dener, M. (2025). A bibliometric analysis of studies on artificial intelligence in neuroscience. Frontiers in Neurology, 16: 1474484. https://doi.org/10.3389/fneur.2025.1474484
[26] Anitha, S., Geroge, S.T. (2021). Adhd classification from FMRI data using fine tunining in SVM. Journal of Physics: Conference Series, 1937(1): 012014. https://doi.org/10.1088/1742-6596/1937/1/012014
[27] Singh, A., Velagala, V.R., Kumar, T., Dutta, R.R., Sontakke, T. (2023). The application of deep learning to electroencephalograms, magnetic resonance imaging, and implants for the detection of epileptic seizures: A narrative review. Cureus, 15(7): e42460. https://doi.org/10.7759/cureus.42460
[28] Lima, A.A., Mridha, M.F., Das, S.C., Kabir, M.M., Islam, M.R., Watanobe, Y. (2022). A comprehensive survey on the detection, classification, and challenges of neurological disorders. Biology, 11(3): 469. https://doi.org/10.3390/biology11030469
[29] Gornale, S., Kumar, S., Siddalingappa, R., Hiremath, P.S. (2022). Survey on handwritten signature biometric data analysis for assessment of neurological disorder using machine learning techniques. Transactions on Machine Learning and Artificial Intelligence, 10(2): 27-60. https://doi.org/10.14738/tmlai.102.12210
[30] Mohsen, F., Ali, H., El Hajj, N., Shah, Z. (2022). Artificial intelligence-based methods for fusion of electronic health records and imaging data. Scientific Reports, 12(1): 17981. https://doi.org/10.1038/s41598-022-22514-4
[31] Ganesh, C., Harshavardhan, G., Keerthi, N.R.S., Yabaji, R.V., Yabaji, R. (2025). Advancements in Alzheimer''s disease classification: Integrating machine learning, neuroimaging, and biomarkers. SCT Proceedings in Interdisciplinary Insights and Innovations, 3: 499. https://doi.org/10.56294/piii2025499
[32] Wu, C., Ferreira, F., Fox, M., Harel, N., Hattangadi-Gluth, J., Horn, A., Akram, H. (2021). Clinical applications of magnetic resonance imaging based functional and structural connectivity. Neuroimage, 244: 118649. https://doi.org/10.1016/j.neuroimage.2021.118649
[33] Devika, K., Oruganti, V.R.M. (2021). A machine learning approach for diagnosing neurological disorders using longitudinal resting-state fMRI. In 2021 11th International Conference on Cloud Computing, Data Science & Engineering (Confluence), Noida, India, pp. 494-499. https://doi.org/10.1109/Confluence51648.2021.9377173
[34] Saha, A., Fadaiefard, P., Rabski, J.E., Sadeghian, A., Cusimano, M.D. (2020). Machine learning applications using diffusion tensor imaging of human brain: A PubMed literature review. arXiv preprint arXiv:2012.10517. https://doi.org/10.48550/arXiv.2012.10517
[35] Malik, I., Iqbal, A., Gu, Y.H., Al-Antari, M.A. (2024). Deep learning for Alzheimer’s disease prediction: A comprehensive review. Diagnostics, 14(12): 1281. https://doi.org/10.3390/diagnostics14121281
[36] Ayubcha, C., Singh, S.B., Patel, K.H., Rahmim, A., Hasan, J., Liu, L., Alavi, A. (2023). Machine learning in the positron emission tomography imaging of Alzheimer’s disease. Nuclear Medicine Communications, 44(9): 751-766. https://doi.org/10.1097/MNM.0000000000001723
[37] Radhika, R., Mishra, S., Birok, R. (2024). EEG graph-based disease analysis: A novel approach to neurological disorder diagnosis. In 2024 First International Conference on Electronics, Communication and Signal Processing (ICECSP), New Delhi, India, pp. 1-5. https://doi.org/10.1109/ICECSP61809.2024.10698581
[38] Dash, D.P., Kolekar, M., Chakraborty, C., Khosravi, M.R. (2024). Review of machine and deep learning techniques in epileptic seizure detection using physiological signals and sentiment analysis. ACM Transactions on Asian and Low-Resource Language Information Processing, 23(1): 1-29. https://doi.org/10.1145/3552512
[39] Zeedan, A., Al-Fakhroo, K., Barakeh, A. (2022). EEG-based seizure detection using feed-forward and LSTM neural networks based on a neonates dataset. Authorea Preprints, TechRxiv. https://doi.org/10.36227/techrxiv.20728411.v1
[40] Chanu, M.M., Singh, N.H., Thongam, K. (2023). An automated epileptic seizure detection using optimized neural network from EEG signals. Expert Systems, 40(6): e13260. https://doi.org/10.1111/exsy.13260
[41] Panda, S., Das, A., Mishra, S., Mohanty, M.N. (2021). Epileptic seizure detection using deep ensemble network with empirical wavelet transform. Measurement Science Review, 21(4): 110-116. https://doi.org/10.2478/msr-2021-0016
[42] Prabhakar, S.K., Lee, J.J., Won, D.O. (2024). Ensemble fusion models using various strategies and machine learning for EEG classification. Bioengineering, 11(10): 986. https://doi.org/10.3390/bioengineering11100986
[43] Banday, I.R., Zaman, M., Quadri, S.M.K., Fayaz, S.A., Butt, M.A. (2022). Big data in academia: A proposed framework for improving students performance. Revue d'Intelligence Artificielle, 36(4): 589-595. https://doi.org/10.18280/ria.360411
[44] Fayaz, S.A., Zaman, M., Kaul, S., Butt, M.A. (2022). How M5 Model Trees (M5-MT) on continuous data are used in rainfall prediction: An experimental evaluation. Revue d'Intelligence Artificielle, 36(3): 409-415. https://doi.org/10.18280/ria.360308
[45] Fayaz, S.A., Jahangeer Sidiq, S., Zaman, M., Butt, M.A. (2022). Machine learning: An introduction to reinforcement learning. Machine Learning and Data Science: Fundamentals and Applications, 2022: 1-22. https://doi.org/10.1002/9781119776499.ch1