Sura Riyadh Saleh*![]() | Suhad A. Yousif
| Suhad A. Yousif![]()
© 2025 The authors. This article is published by IIETA and is licensed under the CC BY 4.0 license (http://creativecommons.org/licenses/by/4.0/).
OPEN ACCESS
Differentiating brain tumors from tumor-like lesions is a persistent clinical challenge due to their overlapping imaging features on conventional radiological scans. Tumor-like lesions such as demyelinating diseases, infections, or post-traumatic changes often mimic neoplastic growths in appearance, leading to potential misdiagnosis and inappropriate treatment decisions. To address this issue, we propose a novel machine-learning-based diagnostic framework that integrates Magnetic Resonance Spectroscopy (MRS) and structural Magnetic Resonance Imaging (MRI) through a confidence-weighted fusion strategy: Final Diagnosis = 0.7 × MRS + 0.3 × MRI. This weighting reflects the higher metabolic specificity of MRS, while retaining MRI’s anatomical detail. Each modality is processed through a specialized pipeline. The MRS pipeline involves image-to-numeric transformation, noise filtering, metabolite concentration-based feature extraction, expert-guided feature selection, and a rule-based classifier. The MRI pipeline includes skull stripping, a novel Dynamic Image Thresholding method, multidimensional feature extraction (statistical, volumetric, shape-based), and correlation-based feature selection with a rule-based classifier. Our integrated system achieved 90% classification accuracy on a clinically validated dataset, effectively distinguishing between tumors and tumor-like lesions. Despite the small dataset (n=50) from a single center, stratified cross-validation yielded consistent results (90% accuracy), demonstrating robustness. Future external validation is planned. By introducing a confidence-informed multimodal fusion strategy, the framework provides both high diagnostic accuracy and interpretability, supporting more reliable and informed clinical decision-making in neuro-oncology.
multimodal brain lesion classification, MRS metabolite ratios, MRI and rule-based fusion
Brain lesions are a magnified difference, mass, or injury in the brain's tissue due to tumors, infections, metastasis, or injury. They are difficult to categorize by clinical radiopathy because they are so different in origin and nature. Brain lesions are areas of abnormal tissue in the brain caused by tumors, infections, inflammation, and other types of trauma. They are incredibly challenging to classify in clinical radiological practice because of their differing kinds of locations, types of formation, and aggressiveness. Accurate and prompt diagnosis is paramount since early differentiation between brain tumors and tumor-like lesions will influence the treatment approach as well as the prognosis and will minimize mortality [1]. However, it is still quite challenging to differentiate lesion types accurately due to the overlapping visual appearances and the deficiencies of existing imaging methods.
While MEGRI and CT are well known for diagnosing brain lesions, MRI with high-resolution anatomical imaging is now mainly used. It identifies deformation of the tissues, such as repositioning, swelling, or texture change. Although MRI is used extensively, the distinction of true tumors from tumor-like lesions such as abscesses or vascular malformations may be difficult. In addition, some tumors, such as gliomas and metastases, exhibit indistinguishable imaging appearances, which makes clinical treatment decisions difficult [2-4].
Magnetic Resonance Spectroscopy (MRS) offers complementary metabolic information based on tissue biochemistry. It measures levels of metabolites, such as Acetyl Aspartate (NAA), choline, creatine, and myoinositol, that may detect lesions not visible on structural imaging. For example, decreased NAA and increased choline levels could suggest tumor activity. Although MRS exhibits potential utility for detecting and following intracranial neoplasm, its clinical use remains modest because of the complexity of data and the non-standardized analysis procedure [5].
MRI and MRS take advantage of the complementary nature of the information provided by MRI, primarily anatomical detail, and MRS, mainly biochemical information. They have been demonstrated to significantly enhance diagnostic performance compared to MRI alone, particularly in tumor vs. non-tumor separation in pediatric and adult populations [6].
The main contributions of this research can be summarized as follows:
New integration of MRI and MRS: We introduce a new framework incorporating MRI and MRS data to classify tumors and tumor-like lesions. However, based on our knowledge, none of the previous work with both modalities, MRI and MRS, has been widely investigated as a means to classify brain lesions automatically.
Dual-Classification algorithms: The proposed method adopts distinct classification models for MRI and MRS data, enabling each modality to be treated separately based on its advantages. The output from both algorithms is combined with a weighted fusion approach to produce the final decision.
Confidence-Level Output: Besides its classification output (tumor and tumor-like lesion), our algorithms also provide a confidence level for this diagnosis. Such a confidence level, derived from a weighted summation of MRI and MRS based on it, is clinically significant, enabling clinicians to determine the reliability of the output for between and more robust diagnosis decisions [7].
Enhanced Diagnostic Accuracy: Our model exhibits superior diagnostic accuracy by integrating structure and metabolism information, recording a 90% overall classification accuracy.
Machine learning provides a powerful means for the analysis and fusion of multimodal imaging data that can facilitate such integration. Recent studies have shown that hybrid models, especially those that integrate rule-based logic and deep learning, can achieve excellent accuracy and interpretable predictive features for clinical use. This paper introduces a new dual-stream rule-based machine learning framework, which performs MRI and MRS data separately and fuses their output based on a confidence-weighted model. This schema improves classification accuracy and furnishes decision-aiding results otherwise interpretable by clinicians [7, 8].
The classification of brain lesions constitutes a central task in clinical radiology, owing to the complexity of their structure, heterogeneity, and similarity of features across different lesion types. Early diagnosis is essential, especially to differentiate between malignant and benign tumors like lesions (e.g., abscesses, demyelinating plaques). Conventional diagnostic methods depend to a great extent on MRI, which offers a detailed anatomical representation. Common MRI sequences, such as T1-weighted, T2-weighted, and FLAIR sequences, are typically employed to identify the presence of abnormal brain tissue according to contrast and intensity patterns. However, MRI alone often cannot definitively categorize lesion subtypes because non-specific structural appearances are frequent. For example, gliomas and metastases are known to have similar morphological representations, thus making differential diagnosis difficult [9].
Early machine learning (ML) techniques have been used for MRI-based lesion analysis to enhance interpretability and classification performance. Such methods are usually based on hand-crafted features, such as intensity histograms, edge profiles, and texture features extracted from Gray-Level Cooccurrence Matrices (GLCM), and classifiers such as Support Vector Machines (SVM), k-nearest Neighbors (kNN), and Decision Trees. However, these models would not generalize well when trained on a heterogeneous dataset that includes both tumor and tumor-mimicking pathologies and thus may not be directly applicable in practice.
Deep learning methodologies, particularly convolutional neural networks (CNNs) have demonstrated better results than traditional methods, as CNNs can learn hierarchical representations from imaging data. Saeedi et al. [6] reported that CNN-based methods outperformed traditional methods, with the highest classification accuracy of 96.47% on the brain tumor datasets, high sensitivity, and recall, according to certain benchmarking. Deep learning methods, however, generally rely on large labeled datasets that are hard to come by in neuroimaging, and they are computationally expensive and complicated to interpret, two of the significant drawbacks to clinical translation. This poses a usability limitation for their routine use in clinical practices.
In an attempt to overcome the restrictions of solely structural imaging, MRS has been proposed as a supplement to improve the DBM interpretation. MRS can quantify biochemical markers in the tissue, providing a different perspective on the metabolic status of brain lesions. Metabolites of clinical relevance are N-acetylaspartate (NAA), which includes information about axonal function; choline, which is associated with the turnover in cell membranes; creatine, responsible for cellular energy; and myo-inositol related to glial activity. A decrease in NAA and an increase in choline are usually due to neoplastic tissue—tumoral evaluation. With the application of MRS, we can differentiate high-grade tumors from benign lesions and evaluate their response to treatment. Nevertheless, while demonstrating its potential as a diagnostic tool, MRS has limited clinical use mainly due to differences in acquisition protocols, access to scanners, signal-to-noise ratio issues, and the absence of established analysis workflows [10].
Some studies have used ML models on MRS data, reaching promising but modality-specific results. Ekşi et al. [11] discriminated between multiple sclerosis lesions and low-grade tumors by MRS using artificial neural networks (ANNs) and linear discriminant analysis (LDA) with high diagnosis accuracy. However, such models often rely on 'clean', high-quality MRS data and do not extrapolate to multimodal settings. Further, their model's lack of structural MRI information makes it less applicable for in-practice diagnostic systems where multimodal evidence is required.
In practice, several recent works have attempted to use a hybrid or an ensemble to enhance the performance of lesion classification. Malarvizhi et al. [12], as well as (B) Quantitative Blood Oxygen Level Dependent (qBOLD) and Vascular Architecture Mapping (VAM) imaging on MRI in combination with ML for enhanced diagnostic performance. They reached an accuracy of 87.5%; however, their method involved a large amount of preprocessing and was computationally intensive and, therefore, not applicable to the routine clinical environment. Similarly, Ullah et al. [13] proposed a deep learning model using Bayesian optimization with a classification accuracy of up to 99.80%. However, the model was highly overfit, with significant manual tuning and a resource-intensive computational environment, and it was not readily available in all clinical settings.
Most of the above methods are based on a single modality (either DC or CT) and are not interpretable, scalable, or do not report confidence levels. Only a few studies have suggested combining MRI and MRS utilizing a unified machine learning framework in brain lesion classification [12]. In addition, confidence estimation of classification outputs is often left unmentioned, though its importance for enabling clinical decision-making under uncertainty has been recently indicated.
Our proposed framework solves these issues through a dual-stream rule-based classification pipeline that combines MRI's structural imaging capabilities with MRS's metabolic profiling strength. Both modalities are handled separately, with their preprocessing, feature extraction, and classification pipelines. The MRI data are first skull-stripped, noise-reduced, statistically and volumetrically. The MRS spectra are converted numerically, denoised independently, and scanned for metabolite-based statistical feature transmission. A rule-based model is then applied to the two independent modalities, and their outputs are combined with a weighted confidence function: Final Result = 0.7MRS output + 0.3MRI output.
The complete model detects the lesion class and provides confidence to aid in clinical decisions. Our model achieved a classification accuracy of 90% when tested on a multimodal brain lesion dataset, proving its efficacy and practicality. This allows for the design of new real-time, interpretable, and multimodal diagnostic systems that can be incorporated directly into radiology laboratory operations.
The proposed methodology aims to distinguish between two different categories of brain lesions, such as brain tumors and tumor-like lesions. MRI and MRS data are structured into several stages. These include data collection, preprocessing, feature extraction, selection, and classification. Additionally, the results from MRI and MRS classifiers are fused to produce a final diagnostic decision with a confidence level. Both MRS and MRI are used in parallel to process the image data, extract features, and apply classification algorithms, as illustrated in Figure 1. The results from both methods are then combined to provide a final diagnosis. The section below describes the overall proposed methodology.
Figure 1. Overall proposed system diagnosis
3.1 Data collection
This study used 50 patients from the Al-Andalus Oncology Centre for data collection. In this dataset, patients with brain tumors and tumor-like lesions were scanned with both MRS and MRI scans. The 50 patients had an average age of 37 years for women and 40 years for men, and they included 23 male and 27 female patients. All data, including the MRI and MRS scans, were collected using a 1.5 Tesla scanner. The patient metadata includes general patient information; clinical details were available online at the "Brain lesion MRI and co-related MRS spectroscopy dataset." FLAIR (Fluid-Attenuated Inversion Recovery) images were used in this study because they can be highly effective in detecting brain lesions and tumors. Spectra obtained with the MRS data were based on the biochemical composition of brain tissue and primarily contained N-acetylaspartate (NAA), creatine, choline, and myo-inositol.
3.2 MRI data preprocessing
The MRI data preprocessing consists of several essential steps designed to prepare the raw MRI scans for better feature extraction and classification:
Skull Stripping: The first step in preprocessing is skull stripping, which removes non-brain tissues from the MRI images. The skull stripping step is essential to identify the region of interest that helps to focus only on the brain tissue for tumor detection and classification. Automated skull-stripping tools, such as FMRIB Software Library (FSL) [14-16], were used in this paper.
Noise Reduction: The raw MRI images often contain noise that can interfere with accurate tumor classification, leading to a misclassification result. A mean filter was applied for this purpose, for it is efficient and requires low processing power [17]. This reduction helps preserve the brain tissue's structural integrity while minimizing interfering variations within MRI data.
|
Algorithm 1. Dynamic Image Thresholding (DIT) |
|
|
Input |
3D MRI image (raw_mri_image) |
|
Output |
Binary mask M of segmented lesion regions |
|
|
Begin |
|
Step 1 |
Compute Statistics: Calculate the mean (μ) and standard deviation (σ) of intensities in the relevant. |
|
Step 2 |
Calculate Threshold: Set the threshold value T = μ + 1.3 × σ. |
|
Step 3 |
Apply Threshold: Create an empty mask M (same dimensions as I). For each pixel (or voxel) IF I(x) > T, THEN set M(x) = 1 (mark as lesion); ELSE set M(x) = 0 (mark as background). – This results in a preliminary binary mask of all pixels exceeding the threshold.
|
|
Step 4 |
Return the final mask M, which highlights the regions where the image intensity was above μ + 1.3σ. |
|
End |
|
Dynamic Image Thresholding (DIT) as illustrated in Algorithm 1: The brain abnormalities are segmented based on our proposed DIT method, and it has several advantages compared to the traditional lesion segmentation method. First, it considers all brain abnormalities, even outside brain tumors. Second, it is more robust to identify non-tumor brain lesions because they often consist of several abnormality regions all over the brain by counting the number of infected areas. At the same time, they are mostly limited to only one brain tumor and many areas of brain lesions. This segmentation method is based on calculating the mean pixel density and the standard deviation for the 3D brain region. The thresholding formula is:
DIT Threshold = Mean Pixel Density of whole 3D brain volumes + 1.35 × Standard Deviation of Pixel Density for whole 3D brain volumes.
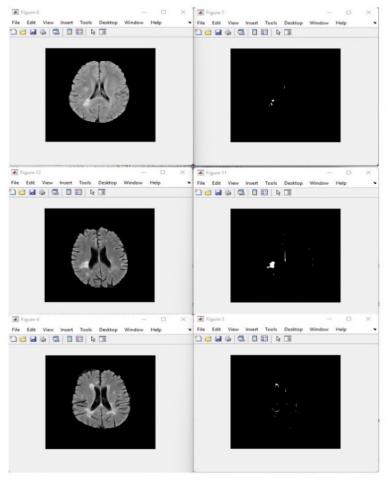
To validate the visual validity of proposed Dynamic Image Thresholding method, clinical expert in neuroimaging was consulted who had over ten years exportation experience in visualizing a neuroimaging system. A series of MRI scans that run on varying DIT threshold values (e.g. 1.0, 1.35 and 1.7) in Figures 2-4 respectively. Below are these figures which were availed to the expert to make a comparative study.
Figure 2. Sample of images with a DIT factor of 1
Figure 3. Sample of images with a DIT factor of 1.35
Figure 4. Sample of images with a DIT factor of 1.7
The expert was allowed to assess the segmentation results on the basis of the abnormal region detection clarity, contrast enhancement and anatomical consistency. The assessment of which threshold-factor was optimal to properly segment brain abnormalities without discarding information or inducing artefacts was established. The judgment of the expert helped to choose a certain value, which could be considered as a valuable threshold value in order to segment brain abnormalities.
The specialist making the decision that the 1.35 threshold factor was the most appropriate one. In succession, this value yielded the best lesion segmentation without any underestimation, such as it occurred with factor 1.0 (edges of the lesions and deep extensions of tissues were overlooked) or overestimation, as in the case with factor 1.7 (the edges of the lesions and deep extensions of tissues were not overlooked), as assessed by the expert. The 1.35 factor gained a balanced demarcation that do not alter the morphology of the lesions leaving behind the integrity of the neighboring healthy structures. The given qualitative validation is used to emphasize the soundness of this approach and its future usability in the classification tasks.
Nevertheless, the validation of this expert based proved that the DIT method is an appropriate preprocessing procedure to determine and isolate the relevant brain abnormalities before further examination.
Thus, the DIT factor of 1.35 is identified as the ideal threshold, offering the best representation of lesions with minimal interference from noise and without over-enhancing image features that could compromise the clarity of the diagnostic results.
However, the adaptive thresholding approach of DIT offers a precise segmentation of the brain's abnormal regions, highlighting the areas that may indicate potential lesions or abnormalities. The segmented regions in the threshold image are marked by distinct differences in intensity, making the abnormal areas stand out more clearly when compared to the original image.
This adaptive thresholding technique helps to identify brain abnormalities by setting a dynamic threshold that accounts for the variation in pixel densities across different brain regions and is adaptive for multiple cases.
3.3 MRS data preprocessing
The preprocessing of MRS imaging is a more intricate process, as the raw spectral data as an image requires several transformations before it can be used for classification:
Data Conversion: The first step is to convert the raw spectral data from MRS scans as an image format to numerical data to be processed for classification. The MRS spectral images are then converted into a data array, representing the intensity values of the raw spectra.
Noise Removal and Signal Correction: Through the data conversion process, the MRS data is prone to noise and distortions; several methods, including a mean smoothing filter, were applied to remove these artifacts. The data is also normalized to correct for variations in signal intensity that may arise from differences between scanner devices [18].
Spectral Alignment: The next step involves aligning the spectral peaks of metabolites across all samples. This ensures that each metabolite, such as N-acetyl aspartate (NAA), choline, and creatine, is consistently located at the same frequency across all patients' data to facilitate feature extraction.
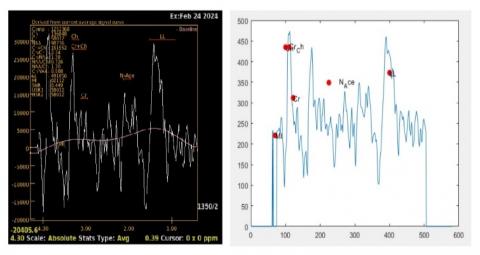
By replicating the above processing steps, Figure 5 illustrates the performance of MRS processing. The left image represents the original MRS image, where the spectral peaks correspond to various chemical components in the brain tissue, such as choline (Ch), creatine (Cr), N-acetylaspartate (NAA), and others. These peaks are influenced by factors such as metabolite concentration and tissue characteristics. However, in its raw form, the data lacks a readable numerical value and requires further analysis.
Figure 5. MRS image conversion to numerical data
The right image demonstrates the transformed MRS data, where the spectrum has been converted into a numerical plot, allowing for clearer feature extraction. The peaks of interest are now marked and quantified in the plot, with each representing the concentration of specific metabolites. This conversion from raw data to numerical values is crucial for feature extraction.
3.4 Feature extraction
Once the MRI and MRS data have been preprocessed, key tumor and tumor-like lesion classification features are extracted. The features extracted from both modalities are grouped into two categories: statistical features (which describe the general characteristics of the data) and volumetric/structural features (which represent the shape and size of detected abnormalities). All features were chosen based on clinical consultation with a specialist with ten years of experience in the field.
3.4.1 MRI feature extraction
Intensity Features: Intensity features refer to the brightness levels of the MRI images. These values are significant in identifying the areas of brain abnormal tissue, such as tumors or lesions. The features, such as mean, maximum, and minimum pixel intensity values for each segmented brain region, are extracted [18].
Texture Features: Texture features describe the spatial arrangement of brain tissue. These include measures of contrast and homogeneity, which help to characterize the structural patterns of brain abnormalities such as tumors or tumor-like lesions. Tumors or other brain lesion tissue have their textures, making these features useful for classification.
Volumetric Features: Volumetric analysis is performed on the segmented brain abnormalities using dynamic image thresholding. The volumetric feature includes extracting the total volume of the segmented abnormal regions, the number of connected components within the brain abnormalities, and the surface area of the segmented brain abnormalities. These features provide essential information about the size and distribution of brain abnormalities.
3.4.2 MRS feature extraction
Metabolite concentration features: The primary features extracted from the MRS data are the concentrations of key metabolites, including N-acetylaspartate (NAA), choline, creatine, and myo-inositol. These metabolites serve as biomarkers for various tumor types. Elevated choline levels, for instance, often indicate high cellular turnover in tumors, while decreasing NAA levels are associated with neuronal damage [19].
Spectral ratios: Ratios of metabolite concentrations (e.g., NAA/Choline, NAA/Creatine) are also extracted. These ratios are known to have diagnostic value in distinguishing between tumor types. For example, gliomas often have a low NAA to Choline ratio.
Statistical features: In addition to metabolite concentrations, we extract statistical features, such as the mean and maximum value of the metabolite intensities within the spectral range. These features capture the variability and distribution of metabolic activity in the brain tissue [7].
3.5 Feature selection
Feature selection reduces the dataset's dimensionality and improves the classification models' performance. This study employs two stages of feature selection for each of the MRI and MRS data:
MRI feature selection: Features are ranked based on their medical importance, and a correlation analysis using Pearson correlation is used to measure linear correlation among variables to identify which features have the strongest correlation with the presence of a tumor. Features that are highly correlated with the target variable (tumor vs. Tumor-like lesion) are selected for classification.
MRS Feature Selection: Similarly, for MRS data, we rank features based on their performance in distinguishing tumor from non-tumor tissues. Features related to the most significant metabolites, such as NAA, choline, and creatine, are prioritized. Additionally, Pearson correlation is used to identify the most informative spectral feature.
Table 1 and Table 2 illustrate the top-ranked MRI and MRS features with clinical relevance respectively. The feature selection process highlighted clinically relevant predictors from both MRI and MRS using Pearson correlation. Among MRI features, Max Pixel Intensity (r = 0.687) and Number of Segmented Regions (r = 0.635) showed strong correlations, indicating their value in identifying tumor characteristics and lesion patterns. In contrast, MRS features demonstrated even higher correlations, with Choline Level (r = 0.967) and NAA/Choline Ratio (r = 0.900) showing strong associations with tumor metabolism. These results support the confidence-weighted fusion strategy (0.7 × MRS, 0.3 × MRI), emphasizing MRS’s superior diagnostic contribution and the clinical validity of the selected features.
Table 1. Top-ranked MRI features with clinical relevance
|
Feature Name |
Clinical Relevance |
Pearson Correlation |
|
Max Pixel Intensity |
The strong signal could be due to necrosis, bleeding or malignant tumor activity. |
0.687 |
|
Number of Segmented Regions |
Multiple abnormal areas suggest tumor-like lesions (e.g., abscesses, demyelination). |
0.635 |
|
Largest Lesion Area |
Size is an important variant to distinguish dash of tumors and benign lesions. |
0.545 |
Table 2. Top-ranked MRS features with clinical relevance
|
Feature Name |
Clinical Relevance |
Pearson Correlation |
|
Choline (Cho) Level |
Increased with a high grade tumor driven by higher cell membrane turnover. |
0.967 |
|
NAA/Choline Ratio |
Reduced in tumor; drawn upon tumor vs. non-tumor. |
0.900 |
|
Creatine Level |
Produces baseline substance; its level may evoke tumor metabolism. |
0.887 |
3.6 Classification algorithms
Two separate classification algorithms were used for more robust and accurate classification performance. First, for the MRI data and second, for the MRS data. Allowing each modality to be processed independently before the results are fused to generate the classification result with a level of confidence [20].
3.6.1 MRI classification
A rule-based classification algorithm was used for MRI classification. Using our proposed DIT segmentation method, this algorithm differentiates between tumor and non-tumor lesion abnormalities based on the area segmentation. The highest correlated extracted features were the number of segmentation areas, the maximum level of pixel density, and the size of the biggest segmented area. A threshold-based classification approach categorizes a tumor as a non-tumor lesion. The classifier uses pre-established thresholds, refined through medical consultation from an expert with ten years of experience, to make the final decision.
3.6.2 MRS classification
Similarly, the MRS data is classified using a rule-based classification model. This model classifies the spectra into tumor or non-tumor categories based on the extracted metabolite features and their ratios. The classification is supported by the concentration levels of key biomarkers, with tumor lesions showing distinct metabolic values compared to tumor-like lesions of brain tissue [21].
3.6.3 Result fusion and final decision
Once the MRI and MRS classifiers produce their results, the final step combines the outputs using a weighted fusion strategy. The results from the two classifiers are combined based on a weighting rule chosen based on medical consultation and proven by high-performance accuracy. The weighted fusion strategy equation: Final Decision= MRS Result Weight*0.7+ MRI Result Weight*0.3.
This weight distribution reflects the relative importance of each imaging modality in tumor classification. The MRS provides valuable metabolic data for diagnosis criteria to determine the destination between tumor and tumor-like lesions. At the same time, MRI, which includes structural information, is used to calculate the final confidence level.
Although MRS provides higher diagnostic confidence (70%) due to its metabolic specificity, it does not capture structural or anatomical information. MRI, while contributing only 30% in terms of classification accuracy, provides critical spatial and morphological context—such as lesion size, shape, edema, and tissue boundaries—which MRS cannot offer.
By combining both, we create a complementary and more robust diagnostic model. MRI may reveal structural abnormalities that are not yet metabolically active or help localize MRS signals more precisely. This synergy often improves the clinical reliability and generalizability of the system, particularly in heterogeneous or early-stage pathologies. This approach ensures that the final decision incorporates the strengths of both imaging modalities, providing a more robust and reliable diagnosis.
A dataset with 50 patients (23 male, 27 female) with an average age of 38 was used to test the proposed methodology. To evaluate the robustness of the proposed classification framework, a 5-fold cross-validation approach was used. This method helps to minimize the impact of potential sampling bias and overfitting, especially given the limited dataset size. For brain tumor classification, the proposed method achieves an outstanding accurate performance of 90%, It is noteworthy that our study of 50 cases identified in one center represents the challenge of insufficient MRS in Iraqi clinical practice. Limitations, including logistics and ethics, limited uptake to only one hospital. To reduce bias and evaluate model stability, we performed stratified 5-fold cross-validation. Consistency across folds in this approach indicated the internal validity of our method. However, we acknowledge that the generalizability of the model is limited. Where possible, we will seek external validation through regional collaborations or publicly available datasets. As illustrated in Table 3, the combination of MRS and MRI data shows promise and efficiency. The results indicate that the proposed classification approach is more reliable, robust, and accurate than models based solely on individual imaging modalities.
Table 3. Contains the confusion matrix summary of the model's performance
|
Actual/Predicted |
Tumor |
Tumor-Like Lesion |
|
Tumor |
9 |
2 |
|
Tumor-like Lesion |
0 |
10 |
True Positives (TP): 9 (Correctly classified as tumors)
True Negatives (TN): 10 (Correctly classified as tumor-like lesions)
False Positives (FP): 1 (Tumor-like lesion misclassified as a tumor)
False Negatives (FN): 0 (Tumor misclassified as a tumor-like lesion)
Table 4 illustrate the performance comparison highlights the effectiveness of combining MRI and MRS modalities for brain lesion classification. The fusion model (MRI + MRS) achieved the highest overall accuracy (90%), along with excellent sensitivity (85%) and perfect specificity (100%), indicating a balanced and robust diagnostic performance.
Individually, MRS outperformed MRI, with an accuracy of 85% and specificity of 90%, reflecting its superior ability to detect metabolic abnormalities characteristic of tumors. MRI alone showed comparatively lower performance (75% accuracy, 80% sensitivity, and 70% specificity), likely due to structural similarities between tumor and tumor-like lesions.
These results validate the decision to assign greater weight to MRS (0.7) in the confidence-weighted fusion strategy and emphasize the benefit of multimodal integration in improving diagnostic reliability.
Table 4. Performance comparison of fusion and standalone MRI and MRS modality
|
Modality |
Accuracy |
Sensitivity |
Specificity |
|
MRI and MRS |
90% |
85% |
100% |
|
MRI alone |
75% |
80% |
70% |
|
MRS alone |
85% |
80% |
90% |
Additionally, the model is highly confident in classifying what is needed for clinical decisions. Clinicians can have the ability to provide a confidence level of better diagnosis decisions.
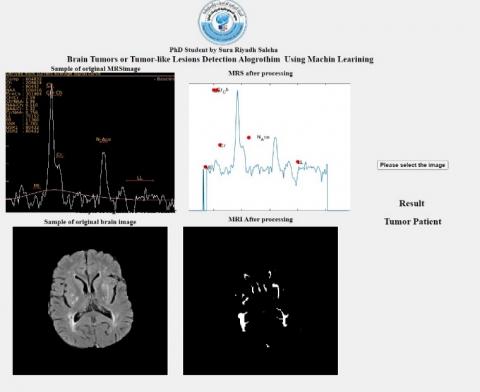
Figure 6 visually represents the combination of both imaging modalities into a single widow’s plication user interface, showing how accurate classification will be when integrating both modalities.
Figure 6. The user interface
Experimental pipeline was run on a high-performance personal computer device containing Intel Core i9-14900HX CPU @ 2.20 GHz, 16 GB RAM, and a 64-bit Windows 11 Pro operating system. The entire processing and analysis were performed in MATLAB R2022a and this was used to perform data preprocessing, feature extraction, classification, and visualization. The total processing time per patient, including MRI preprocessing, feature extraction, and MRS spectral alignment, was approximately 18–22 seconds, depending on data quality and scan size. The MRS spectral alignment step was among the most computationally intensive, typically requiring 5–7 seconds due to peak normalization and alignment routines. Nonetheless, the whole pipeline works well and can be appropriate in terms of providing support in diagnosis in situations close to real-time. In this way the system could be customized according to hospital PACS systems.
Together, MRI and MRS data provide a significant step forward toward brain tumor classification. MRI is beneficial for Barin Imaging and provides structural information. Comparing it with MRS is essential for differentiating different tumor types and lesions. The simultaneous introduction of these two imaging modalities in a single ML algorithm enhances their diagnostic accuracy and improves the information available regarding the tumor characteristics [22].
The final classification is based on a confusion matrix displaying the true positives, false positives, true negatives, and false negatives. The model will be included in this figure as a marker of its ability to gauge the effectiveness of separating tumor and non-tumor cases.
This study demonstrates the feasibility of combining MRS and MRI data for tumor classification with machine learning. Clinical decision-making can be more robust and reliable for diagnosing brain tumors using the proposed algorithm, which has achieved a classification accuracy of 90% and predicts the confidence level.
However, rule-based classification algorithms are practical for classification in this study. Despite that, there is scope for further improvement by exploiting better ML algorithms, such as deep learning methods like convolutional neural networks (CNNs). Theoretically, these models could readily capture additional data complexity and improve system performance.
One limitation of this study is the use of data collected exclusively from a single medical center (Al-Andalus Oncology Centre), which may introduce institutional or population-specific bias. To mitigate this concern, we employed cross-validation to evaluate model stability; however, future work will focus on validating the framework using multicenter datasets to reduce the risk of bias inherent in single-center studies.
Furthermore, future work in this direction will be dedicated to expanding the dataset, improving feature extraction, and investigating more sophisticated machine-learning techniques that enhance the model's performance. Combining structural and biochemical information can significantly help with the early detection and treatment of brain tumors.
A positively classified brain scan and the classification's confidence level represent a final diagnosis output. It will then illustrate how the confidence level affects the ultimate clinical choice.
[1] Al Malik, Y.M. (2024). Tumefactive demyelinating lesions: A literature review of recent findings. Neurosciences Journal, 29(3): 153-160. https://doi.org/10.17712/nsj.2024.3.20230111
[2] Weinberg, B.D., Kuruva, M., Shim, H., Mullins, M.E. (2021). Clinical applications of magnetic resonance spectroscopy (MRS) in of brain tumors: From diagnosis to treatment. Radiologic Clinics of North America, 59(3): 349. https://doi.org/10.1016/j.rcl.2021.01.004
[3] Sabeghi, P., Zarand, P., Zargham, S., Golestany, B., et al. (2024). Advances in Neuro-oncological imaging: An update on diagnostic approach to brain tumors. Cancers, 16(3): 576. https://doi.org/10.3390/cancers16030576
[4] Martucci, M., Russo, R., Schimperna, F., D’Apolito, G., et al. (2023). Magnetic Resonance Imaging of primary adult brain tumors: State of the art and future perspectives. Biomedicines, 11(2): 364. https://doi.org/10.3390/biomedicines11020364
[5] Tran, A.T., Zeevi, T., Payabvash, S. (2025). Strategies to improve the robustness and generalizability of deep learning segmentation and classification in neuroimaging. BioMedInformatics, 5(2): 20. https://doi.org/10.3390/biomedinformatics5020020
[6] Saeedi, S., Rezayi, S., Keshavarz, H.,R. Niakan Kalhori, S. (2023). MRI-based brain tumor detection using convolutional deep learning methods and chosen machine learning techniques. BMC Medical Informatics and Decision Making, 23(1): 16. https://doi.org/10.1186/s12911-023-02114-6
[7] Manias, K.A., Gill, S.K., MacPherson, L., Oates, A., et al. (2019). Diagnostic accuracy and added value of qualitative radiological review of 1H-magnetic resonance spectroscopy in evaluation of childhood brain tumors. Neuro-oncology practice, 6(6): 428-437. https://doi.org/10.1093/nop/npz010
[8] Aamir, M., Rahman, Z., Bhatti, U.A., Abro, W.A., Bhutto, J.A., He, Z. (2025). An automated deep learning framework for brain tumor classification using MRI imagery. Scientific Reports, 15(1): 17593. https://doi.org/10.1038/s41598-025-02209-2
[9] Zarenia, E., Far, A.A., Rezaee, K. (2025). Automated multi-class MRI brain tumor classification and segmentation using deformable attention and saliency mapping. Scientific Reports, 15(1): 8114. https://doi.org/10.1038/s41598-025-92776-1
[10] Schwab, S., Harbord, R., Zerbi, V., Elliott, L., Afyouni, S., Smith, J.Q., Woolrich, M.W., Smith, S.M., Nichols, T.E. (2018). Directed functional connectivity using dynamic graphical models. NeuroImage, 175: 340-353. https://doi.org/10.1016/j.neuroimage.2018.03.074
[11] Ekşi, Z., Özcan, M.E., Çakıroğlu, M., Öz, C., Aralaşmak, A. (2021). Differentiation of multiple sclerosis lesions and low-grade brain tumors on MRS data: Machine learning approaches. Neurological Sciences, 42(8): 3389-3395. https://doi.org/10.1007/s10072-020-04950-0
[12] Malarvizhi, A.B., Mofika, A., Monapreetha, M., Arunnagiri, A.M. (2022). Brain tumour classification using machine learning algorithm. Journal of Physics: Conference Series, 2318(1): 012042. https://doi.org/10.1088/1742-6596/2318/1/012042
[13] Ullah, M.S., Khan, M.A., Masood, A., Mzoughi, O., Saidani, O., Alturki, N. (2024). Brain tumor classification from MRI scans: A framework of hybrid deep learning model with Bayesian optimization and quantum theory-based marine predator algorithm. Frontiers in Oncology, 14: 1335740. https://doi.org/10.3389/fonc.2024.1335740
[14] Jenkinson, M., Beckmann, C.F., Behrens, T.E., Woolrich, M.W., Smith, S.M. (2012). FSL. NeuroImage, 62(2): 782-790. https://doi.org/10.1016/j.neuroimage.2011.09.015
[15] Smith, S.M., Jenkinson, M., Woolrich, M.W., Beckmann, C.F., et al. (2004). Advances in functional and structural MR image analysis and implementation as FSL. Neuroimage, 23: S208-S219. https://doi.org/10.1016/j.neuroimage.2004.07.051
[16] Woolrich, M.W., Jbabdi, S., Patenaude, B., Chappell, M., Makni, S., Behrens, T., Beckmann, C., Jenkinson, M., Smith, S.M. (2009). Bayesian analysis of neuroimaging data in FSL. Neuroimage, 45(1): S173-S186. https://doi.org/10.1016/j.neuroimage.2008.10.055
[17] Gunasundari, C., Selva Bhuvaneswari, K. (2025). Machine learning fusion for glioma tumor detection. Scientific Reports, 15(1): 11236. https://doi.org/10.1038/s41598-025-89911-3
[18] Banthia, S., Sharma, R. (2022). Features of ring-enhancing brain lesions: A correlative study between MRI and MR spectroscopy. International Journal of Life Sciences Biotechnology and Pharma Research, 11(1): 81-85.
[19] Stadlbauer, A., Marhold, F., Oberndorfer, S., Heinz, G., Buchfelder, M., Kinfe, T.M., Meyer-Bäse, A. (2022). Radiophysiomics: Brain tumors classification by machine learning and physiological MRI data. Cancers, 14(10): 2363. https://doi.org/10.3390/cancers14102363
[20] Czmil, A. (2023). Comparative study of fuzzy rule-based classifiers for medical applications. Sensors, 23(2): 992. https://doi.org/10.3390/s23020992
[21] Lukas, L., Devos, A., Suykens, J.A., Vanhamme, L., et al. (2004). Brain tumor classification based on long echo proton MRS signals. Artificial intelligence in medicine, 31(1): 73-89. https://doi.org/10.1016/j.artmed.2004.01.001
[22] Rahman, T., Islam, M.S., Uddin, J. (2024). MRI-based brain tumor classification using a dilated parallel deep convolutional neural network. Digital, 4(3): 529-554. https://doi.org/10.3390/digital4030027