Jaafar Rashid![]() | Abolfazl Diyanat*
| Abolfazl Diyanat*![]()
© 2025 The authors. This article is published by IIETA and is licensed under the CC BY 4.0 license (http://creativecommons.org/licenses/by/4.0/).
OPEN ACCESS
The Quality of Experience (QoE) has become a crucial research topic for network operators and video providers, since it directly measures customer satisfaction. Objective QoE Assessment outperforms subjective in cost and applicability. However, predicting the QoE remains a challenge due to the variety of its influencing factors. The P.1203 by the ITU-T has emerged as the first QoE standard in video streaming environments. This work aims to predict the next possible QoE degradation to avoid poor perceived quality. A low user interaction is simulated using Selenium to extract the ITU-T P.1203 video parameters. The obtained data, in addition to network data from a network prob, have been used to train Feed Forward Neural Network (FFNN) classifiers and several regression models. The QoE has been predicted using both classification and regression in three implementations, in addition to implementing feature selection for better feature space size and the prediction performance. The FFNN results have been evaluated using cross-validation accuracy, RMSE, and confusion matrices. Combining the ITU-T P.1203 standards with the advances of machine learning (ML) in this study provided high prediction accuracy levels that exceeded 88% and highlighted nine selected influencing factors that are highly impacting the delivery of video services.
QoE prediction, mean opinion score, adaptive video, streaming, ITU-T P.1203, feature selection, selenium
For many years, the concept of quality in telecommunications has primarily centered around the term Quality of Service (QoS). According to E.800 Rec. by ITU-T, the term QoS means the comprehensive characteristics of a telecommunications service that determine its performance to meet the explicit and implicit requirements of the service’s user. This implies that quality is evaluated based on the inherent attributes of the service itself. This recommendation also introduces the idea of QoS Experienced (QoSE) or QoS Perceived (QoSP), representing the quality level customers or users perceive they have experienced. This shift in focus highlights the user’s perspective and their subjective assessment of service quality. This user-centric approach is further emphasized by the concept of QoE. In the late 1990s, a widely accepted definition of QoE was “the extent of satisfaction or irritation experienced by the client of a service or an application”. This definition notably broadens the scope beyond telecommunications services to encompass many applications.
In adaptive video streaming environments, the rapid development of multimedia services has made watching videos one of the most popular activities for Internet users. Cisco’s Visual Networking Index reveals that video traffic will constitute 82% of the traffic across the global network in 2021, up from what was measured in 2016. Therefore, it is a challenging task for providers to deliver video services efficiently while meeting user expectations of quality. HTTP Adaptive Streaming (HAS) is a well-known protocol designed to dynamically adjust the bitrate of video content according to the network capacity at any given time, ensuring a smooth playback based on the network conditions. The media content is divided into small periods, each of a few seconds, and different versions of each segment are encoded at various quality levels (bitrates and resolutions). A manifest file provides a view of segments and their qualities. When the client (e.g., a video player) requests the manifest file from the server, it selects an appropriate quality level for the next segment based on the network status (e.g., available bandwidth), and playback continues seamlessly, switching between different quality levels as network conditions change. Dynamic Adaptive Streaming over HTTP (DASH), an open-source international standard developed by ISO MPEG, is also commonly adopted in the OTT streaming market. DASH uses a Media Presentation Description (MPD) file to describe the media content, including available segments, qualities, and timing information.
Although HAS-like solutions were worthy, adopting end-user QoE standards was a challenging task. For instance, the user experience QoE is significantly impacted by the frequent dynamic bitrate adaptation during video playback. Additionally, several factors such as associative memory primacy, recency, and hysteresis in end-users must be considered in adaptive streaming for more efficient adaptation algorithms. Human visual perception and behavior are also critical aspects to consider for better rate adaptation response.
In literature, many QoE assessment models are proposed; subjective assessment models focus on obtaining the human opinion using rating scores such as ACR, and Objective models tend to calculate these scores and map them with the streaming and non-streaming parameters. ITU-T P.1203 has been considered as the first standard to objectively predict the QoE in HAS-based video streaming using the bitstream level parameters. However, predicting the QoE is still a challenging multidisciplinary task since it is affected by many influencing factors, and the variety in collecting the data regarding requiring or not the original video parameters. Thus, low-cost and efficient QoE prediction is still an open research area, and extensions of the published ITU-T standards are still proposed by researchers to enhance the prediction and report the QoE degradation proactively to the network operators and service providers.
1.1 QoE assessment and modelling
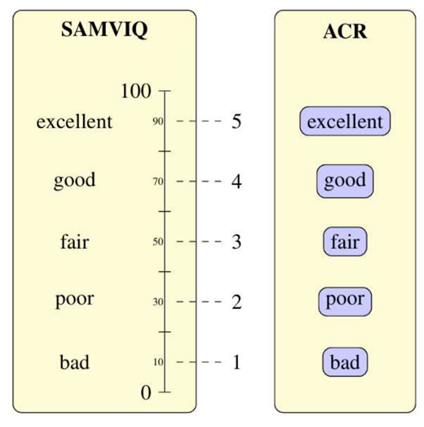
QoE assessment is generally divided into subjective and objective methods. Subjective methods focus on user opinion in the form of voting to estimate the video quality at the user end. A commonly used subjective assessment measure is the Mean Opinion Score (MOS), which reflects the average of the opinion scores collected from the assessors and is calculated by mapping the ACR scores into a 5-level rating scale. Measures such as Subjective Assessment Methodology for Video Quality (SAMVIQ), Good/ Bad, and Accepted/ not Accepted, are also used in the literature to measure the QoE. However, the MOS is still the most common scalar score to subjectively represent the quality experienced at the client end (See Figure 1).
Figure 1. Scala scores to measure the subjective QoE
On the other hand, objective procedures are typically mathematical models that provide a numerical score of the client's end video quality. ITU-T P.1203 [1] defined a standardized model for predicting user QoE based on network and content-related parameters. In addition, it provides a method for assessing the effect of network impairments on video streaming quality. ITU-T P.1203, is then published as the promoting standard of audiovisual quality for HAS implementations. The databases used for training were developed jointly to run the intended subjective test scenarios. Then, joint training data was implemented to extend the distinct proponents' training. A candidate group of models established the final model that now exists inside the P.1203 standard documents. The main architecture of P.1203 is described in Figure 2, where O.46 is the final integral output of this model to represent the resulting estimated QoE level at the user end.
Figure 2. The main architecture of ITU-T P.1203
The P.1203 model predicts MOS scores using a five Absolute Category Rating (ACR) scale. ITU-T P.1203 stated that the QoE degradation experienced by the end-user in video streaming systems can be caused by the coding and bitrate, media adaptation, spatial re-scaling, variations in video frame rates, initial loading spent time, and stalling (which are both caused by rebuffering at the client).
This recommendation allows implementing four modes to provide more flexibility for different data collection procedures. Mode 0 has access to only codec, coding, display resolution, bitrate, frame rate, and segment durations.
Mode 1 has additional access to frame sizes, durations, and video frame types. On the other hand, Mode 2 can access 2% of the video bitstream information, and Mode 3 can access the entire bitstream, as shown in Figure 3.
Figure 3. The four modes of ITU-T P.1203
1.2 Feature selection in QoE prediction
Due to the complexity of the QoE factors’ space, it is required to use data mining approaches for enhancing the ML training and QoE prediction. This diversity in QoE parameters can be summarized into several highly impacting factors to have better prediction performance. Feature Selection methods can help in reducing the dimensionality and provide better insight into the complex multidimensional QoE space [2]. Approaches such as the Forward Elimination algorithm [3], and Decision Tree implementations have been used to explore the predictors' impact on the MOS class labels. Feature Selection studies highlighted different parameters, such as the video resolution and transmission rate, as high-impact factors on user QoE due to their high correlation with the resulting packet loss and delay at the client end.
Feature Selection (FS) methods to rank and select the best feature subset can also increase the performance of ML models by selecting a better set for training, and reduce the training time required by the models to learn from a smaller set of features [4].
In literature, objective assessment QoE models are proposed to estimate the quality level based on the offline or online extracted video and network features. several works used statistical approaches and ML abilities to extract the features and classify the MOS levels in various video streaming environments. Mustafa et al. [5] proposed a QoS features measurement technique at edge nodes over the DASH video stream network. The author emulated real 4G and 5G drive tests and generated video traffic to analyze the influencing factors on the QoE. Factors such as network topology, capacity, end-user characteristics, and the type of measured service are considered by the author, and 14 QoE features are used with a focus on packet size and arrival time. These features include: (the time of arrival, delivery, and stall, in addition to the delivery rate, actual bitrate, segment size, buffer performance, and spatial resolutions). This model has been implemented on a subjective dataset collected in France over a period of six months with a YouTube baseline.
Cheng et al. [6] focused on the user behavior aspects while viewing the video stream as QoE influencing factors. The author discretized the video watching session into a Markov chain model of the QoE quantitatively. Viewing session logs of CDN and Internet service providers is collected for training and validation using machine learning methods. The conclusion of this work showed that the user’s exit behavior is an important QoE metric, and discretizing the playback sessions can highlight the role of playing and stalling events on the client's behavior.
Duanmu et al. [7] created a database of streaming videos and developed a QoE approach to explore the impact of video compression, initial buffering, and playback interruptions (stalling). The study aimed to predict the QoE by continuously monitoring the momentary decrease in video quality due to perceptual issues during video playback, the stalling events, and the real-time interactions between these factors. Each instance of stalling during a streaming session divides the timeline into three distinct, non-overlapping periods: before the stalling, during the stalling, and after the stalling. Frames before the stalling are assigned a zero penalty, indicating that viewers did not encounter any disruptions at that point. The assumption made is that user dissatisfaction gradually increases as the stalling persists until normal playback resumes, and this interruption event has an impact on the overall QoE. Subsequently, user dissatisfaction gradually diminishes as viewers begin to forget the inconvenience at the moment playback returns to normal.
A case study by Hewage et al. [8] monitored the network of several cellular operators in Turkey to establish a mapping between the network and QoE. The author used a dataset collected from a city and used deep learning models to test them. Non-static outdoor measurements per time in an equipped car have traveled over the route through Izmir, and the measurements have been made with a smartphone within the LTE network. The author predicted the RSRP and MOS values over time after training the deep network using the buffering details, session time, vehicle coordinates, and distance to the primary and secondary cell towers.
Liu et al. [9] used real user data collected from the China Unicom network using a mobile application. The author used classification tree C4.5, GBDT, and Spearman correlation analyses. The time of client joining, time spent by server to respond, initial loading peak rate, and several other video properties were used to monitor the QoE at mobile terminals.
Iazeolla and Forconi [10] collected simulated data of the LTE mobile network using OPNET and used the Weight-based QoE Mathematical Model, Packet Loss Ratio, and Transfer Delay to mathematically model the QoS (KPI)s.
Tran et al. [11] implemented a real streaming testbed using three datasets constructed using ITU-T P.910. The author used Linear Regression, and an LSTM network to explore temporal relations between quality variations and stalling events, and explored the role of segment-level analysis in QoE prediction.
Bampis and Bovik [12] used Regression models on Live Netflix, and Waterloo datasets to explore the impact of stalling events due to Initial delay, average frame quality, the number of stalling events, and time of quality degradation on the QoE score. The author concluded that the human memory feature has a strong impact on QoE.
Li et al. [13] used eight different sampling rates and calculated new proposed features for predicting the QoE. The author segmented the video, extracted the image features using sampling and correlation methods, and used the DNN and SVR for prediction. This study concluded that the human perception system can highly impact the estimated QoE.
Rao et al. [14] used video scenes of 10 sec., 3840×2160, and 60 fps to implement two subjective tests. The author also used mapping/correction and curve fitting to build an objective QoE prediction model. This study focused on the resolution, codec, and bitrate parameters to extend the ITU-T recommendation to support higher resolution and more codecs. Elwerghemmi et al. [15] proposed an objective QoE model implemented on Live-Netflix, Pokémon, and LFOVIA datasets. A pre-trained CNN is used as feature extraction, and a DNN to process the obtained texture features.
Regarding the MOS scalar values, the majority of QoE research in the literature uses and discusses the so-called MOS. For subjective evaluation, a researcher could attempt to address several inquiries about the service being examined. The QoE questions might focus on the overall perceived quality (the most common), several specific perceptual dimensions of quality (e.g., blockiness in the case of video), usability, or acceptability of the service. Several overall quality measures in video streaming are proposed and used in literature and practical applications, such as Poor or Worse (PoW), MOS score, Good or Better (GoB), and Standard Deviation Opinion Score (SOS). However, the questions or users’ voting are commonly focusing on the overall aspects of the quality degradation, and then summarizing the opinions by their means using the MOS score. This highlighted the strong relation between the video quality and the MOS score, especially after publishing the ITU-T standards that proved this relation by implementing objective models aided by the subjective test evaluation.
A study by Hoßfeld et al. [16] categorized the QoE measurement into ‘opinion’ and ‘behavioral’. This study considered events such as accepting the service, retrying, complaining, and user engagement as separate behavioral measurements of the QoE. The author recommended that the acceptability indicator should be considered explicitly in subjective tests since it cannot be inferred directly from the MOS score.
Péchard et al. [17] compared two different subjective quality assessments; Subjective Assessment Methodology for Video Quality (SAMVIQ) using a continuous rating scale and ACR using a 5-point discrete rating scale. The author also discussed the impact of several QoE parameters on the correlation between these two measures.
Although existing works predicted the QoE in different scenarios, most proposed models didn’t consider ITU-T standards, resulting in inconsistencies with subjective tests and a lack of systematic procedures for collecting standard video parameters. On the other hand, several existing works have focused on segmenting the video into frames and capturing image features to analyze QoE degradation, which has led to the omission of capturing important streaming parameters and discriminative features of the videos. The compared works also highlighted the simplicity of implementation and the cost of obtaining QoE parameters as aspects that still require more discussion and enhancement efforts.
2.1 The scope of this work
This work aims to combine the advantages of accurate objective calculation of ITU-T standards to obtain QoE data from real online video provision, with the prediction abilities of machine learning. It simulates the user interaction with a video site and obtains the streaming and non-streaming parameters during the sessions. It also proposes three low-cost prediction experiments using both regression and classification models. Feature selection procedures are also used to enhance the accuracy, learning time, and memory usage.
Analyzing the obtained features in three scenarios also contributes to the broader understanding of the intricate factors influencing user satisfaction and provides the operators with an early warning report about the next possible quality degradation at the client end. While targeting high-accuracy prediction, this work also aims to keep the simplicity by using only several specific features that can highly impact user satisfaction.
The importance of this work comes from the following:
The remainder of this article is organized as follows: the proposed approach is generally described in Section 3. Training the classification and regression models is explained in subsection 3.3. Three proposed experiments are discussed separately, in addition to listing and discussing the results of each experiment. Section 5 provides some concluding remarks and highlights possible directions of future work.
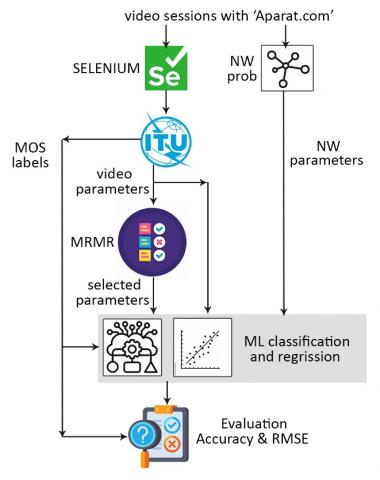
In this section, the proposed work is explained in three main phases: Simulation the user interaction with the video service site, Simulating the ITU-T P.1203 and monitoring the network to obtain the streaming and non-streaming features, and training the Regression and Classification models to predict the QoE scores. The first two phases were inspired by a video quality analysis work by Robitza et al. [18] and a work [19] by our team to extract the QoE features. The feature extraction is implemented with enhancement steps to prepare the features for the next three experiments of the third phase (QoE prediction phase). The proposed phases of this work is described in three main blocks shown in Figure 4.
Figure 4. The block diagram of the proposed work
3.1 Simulating the interaction between clients and the video service provider
To avoid the limitation of high-cost subjective tests, the ITU-T P.1203 standard, a trusted and evaluated objective model, is simulated to extract the QoE parameters of real data. The simulation is implemented on ‘Aparat.com’, a video website that distributes different lengths of video scenes on various topics. Short HD videos of H.256 encoding are initially selected from the ‘Aparat.com’ website. Videos of sports, news, and nature are used to consider different motion effects on QoE scores. To simulate the initial user interaction with this site, ‘Selenium’ is used to simulate the user actions in requesting the site, searching for a video link, playing it, and skipping the Ads.
Selenium is a powerful tool that allows automating web browsers, testing web applications, and testing websites. It allows simulating user interactions with a web application, such as clicking buttons, filling out forms, and navigating through pages. Selenium test scripts can be written in various programming languages, and these scripts can also be used to ensure that a website functions correctly. Aparat.com, a video-sharing service that began tentatively in February 2011, is used as a source of videos in this simulation. This site offers over four thousand daily uploaded videos with a bandwidth of 40 Gb/s. A monthly 15 million hours are played per month by over 26 million online visitors, including 12% clients from other countries. Selenium stimulates the client to do the following steps:
1) A web browser is used by Selenium to request the Aparat website’s page, and search for a specified video (from a specific list).
2) It examines the received search results and selects the desired video from the results.
3) After navigating to the page that contains the required video, it starts playing the video by clicking the play button.
4) It waits in a loop for the appearance of the “skip ad” button and clicks on it if it’s visible, allowing the video playback to proceed.
5) A portion of the video (defined in a specific setup file) is viewed, and its data is extracted via Selenium.
6) To record the interactions between web browsers and Aparat websites, the HTTP Archive (HAR) file format is used to record the results.
It’s a JSON-based archive format that defines a standard format for HTTP transactions. The resulting HAR files are used to capture detailed performance data about the pages loaded by a web browser. They include information about all requests and responses, such as timing for request and response, response’s packet size, user page load time, request data type, and many other details. These files are often used for analyzing and optimizing web performance and for debugging issues with web pages by the providers.7) HAR files are downloaded and organized into a list which is then processed using Regular Expressions (RegEx) to extract the (.ts) files.
3.2 Feature extraction
In this work, the P.1203 recommendation by ITU-T has been simulated to extract the video parameters from each played video by Selenium, which allows extracting the streaming parameters, in addition to using a network probe to extract the network parameters during viewing each video. The obtained parameters from the P.1203 simulation included the MOS ranging from 1 to 5, a value that defines the class label of each video (observation).
The extracted QoE parameters and MOS labels are then stored in a structured database as numerical tabular data. The video module (Pv) is used since the audio quality is out of the scope of this work (See Figure 3). Among the modes shown in Figure 4, Mode 0 is used to keep the simplicity in this work since it has access to the least amount of Metadata (Encrypted media payload and media frame headers).
3.3 QoE prediction
In this work, the user interaction with a video service website called ‘Aparat’ is simulated using Selenium application, the P.1203 standards is implemented to obtain the video parameters and the predicted MOS scores of more than 750 observations of played streams, in addition to monitoring several network parameters synchronously during the simulation using ICMP statistics. The obtained data (video parameters and delivery-based parameters) and their MOS class labels (labeled observations by ITU-T P.1203 rec. used as a truth), in addition to four proposed measured network parameters, are used to train the Feed Forward NN classifier to predict the QoE in different proposed scenarios. The obtained ITU-T p.1203 class labels of decimal numbers ranging from one to five, inspired using both classification and regression (the calculated MOS scores are approximated to five categorical values with classification, while they are used as continuous values with regression). MATLAB R2022b is used to train the ML models in three distinct experiments.
To train machine learning classification and regression models, a single hidden-layer Feed-Forward NN model for classification is trained to learn parameters. ReLU is used as an activation function in the hidden layer, and SoftMax is used to support multiple class labels in the output layer. The 5-level MOS scores obtained from the objective ITU-T P.1203 assessment are used as class labels to implement the supervised learning. In contrast to starting from zero weights, which leads neurons only to memorize the same features during training, initializing the weights with some value (w) to forward propagate an input to the next layer after adding the bias [20] such as:
$z_l=w_l a_{l-1}+b_l$ (1)
The output is then regularized using the ReLU activation function and forwarded to the next layer.
${{a}_{l}}=Relu\left( {{z}_{l}} \right)$ (2)
While initializing the weights with too small values can lead to slow learning, too large values of weights can lead to divergence issues [21]. To solve this tradeoff (exploding or vanishing), the He Initialization [22], a suitable initialization for ReLU, is used where the mean of the activations is brought to zero.
${w_l \sim N ( \mu =0, \sigma ^{2}}=\frac{2}{{{n}_{l-1}}})$ (3)
${{b}_{l}}=0$ (4)
where, ${{n}_{l-1}}$ is the number of incoming connections to the neuron (size of the previous layer), the bias (${{b}_{l}})\text{ }\!\!~\!\!\text{ }$is initiated with zero, the weight values are a small value chosen randomly from a distribution that has a mean equal to zero ($\mu =0$), a variance $({{\sigma }^{2}}=\frac{2}{{{n}_{l-1}}}$) according to the number of neurons of the leading layer. The ‘He Initialization’ allows avoiding the inactive neurons issue by the ReLU function (when its output is zero due to negative input). Thus, it ensures that more neurons remain active and contribute during the training process.
To avoid overfitting and enhance the generalization, a penalty for large weights is used. This L2-regularization (λ) is set to zero by default to indicate simply minimizing the loss function (e.g., cross-entropy loss) without any penalty on the weights. However, a nonnegative scalar (λ) can enhance the regularization by preventing higher weights (memorizing instead of learning).
A common technique to choose a suitable value of (λ) is experimental accuracy monitoring by cross-validation, where adjusting different values allows finding the best trade-off between just memorizing the training patterns and maintaining the model's generalization on future unseen data.
Several performance metrics have been used in comparison, including the following:
$Accuracy=~\frac{True~Positive+True~Negative}{Total~Samples}$ (5)
Accuracy is the overall effectiveness of the model, reflecting the proportion of proper predictions (the sum of true positives and true negatives) out of all predictions.
$Precision=~\frac{True~Positive}{True~Positive+False~Positive}$ (6)
Precision is the proportion of true positives out of all positive predictions made by the model. It reflects the ability to identify only relevant instances (high precision means that the model has a small false positive score).
$Recall=~\frac{True~Positive}{True~Positive+False~Negative}$ (7)
Recall (Sensitivity), also known as the True Positive Rate, represents the proportion of true positive predictions among all actual positive instances in the dataset. High recall indicates that the model has a low false negative and can successfully identify most of the actual positives. The flow diagram shown in Figure 5 describes the main steps of the QoE prediction implemented in this work.
Figure 5. The flow chart of the QoE prediction
4.1 Experiment 1
In this experiment, twenty ITU-T P.1203 parameters of video and buffering features, in addition to four network parameters (average bitrate, delay-QoS, jitter, and packet loss) are used as predictors to train a single hidden layer Feed-Forward NN classifier. The calculated MOS scores by ITU-T P.1203 are mapped into 5-level integer values by approximating the decimal digits to make them suitable for discrete class labels classification. A 90% of 768 labeled samples (extracted from 768 simulated viewing sessions) are used to train the classifier using 5-fold cross-validation, and 10% of the data is held-out for testing. The predicted QoE (5-level MOS Scores). Several regularization strengths ranging from 0.001 to 0.04 have been examined to control the weights and avoid possible overfitting. The results showed that using (λ = 0.001) provided the highest mean validation accuracy of 87.87% as shown in Figure 6. Generally, the high obtained validation accuracy was associated with using small values of λ close to 0.001. A confusion matrix is also considered to measure the Recall and Precision of each relevant class. On the other hand, the raw calculated continuous decimal MOS scores are used as class labels to train a regression model. The same data division is used (90% for training, 10% for unseen test) and the same NN configuration.
Figure 6. Comparing the accuracies for different regularization strengths in Exp.1
Table 1. The classification accuracy, cost, and training time achieved in Exp.2
|
Lambda |
Validation Accuracy % |
Total Validation Cost |
Test Accuracy % |
Total Test Cost |
Prediction Speed (obs/sec) |
Training Time (sec) |
|
0.001 |
88.42 |
80 |
92.11 |
6 |
16505.86782 |
59.5568618 |
|
0.002 |
88.28 |
81 |
92.11 |
6 |
16014.27611 |
72.2031145 |
|
0.003 |
88.28 |
81 |
92.11 |
6 |
18979.86651 |
63.4918621 |
|
0.004 |
88.28 |
81 |
92.11 |
6 |
16996.38673 |
69.2661002 |
|
0.005 |
88.13 |
82 |
90.79 |
7 |
24484.18449 |
69.0254526 |
|
0.01 |
87.41 |
87 |
89.47 |
8 |
29987.54497 |
68.0349551 |
|
0.02 |
85.82 |
98 |
88.16 |
9 |
35895.35802 |
65.0140386 |
|
0.03 |
81.77 |
126 |
86.84 |
10 |
35436.26088 |
64.2527787 |
|
0.04 |
73.52 |
183 |
78.95 |
16 |
15620.97325 |
118.9664043 |
|
0.05 |
71.20 |
199 |
76.32 |
18 |
14415.32405 |
53.9546934 |
The RMSE is used to evaluate the model. The results using (λ = 0.003) provided the least achieved RMSE of (0.285725) in the validation phase. A similar low RMSE value of (0.200488) has also been obtained in the test phase, as explained in Figure 7.
Figure 7. Comparing the regression RMSE for different regularization strengths in Exp.1
4.2 Experiment 2
To highlight the high-impacting parameters in the QoE prediction, Minimum Redundancy Maximum Relevance (MRMR) is used as feature ranking since it measures both feature relevance (mutual information between feature and target) and redundancy (mutual information between the features) [23]. It selects the highly relevant features to the target class while keeping them minimally redundant with each other. The mutual information is calculated using the formula:
$M\left( x,y \right)=\underset{i,j}{\mathop \sum }\,\log \frac{p\left( \text{ }\!\!~\!\!\text{ }{{x}_{i}},{{y}_{j}} \right)}{p\left( {{x}_{i}} \right)\text{ }\!\!~\!\!\text{ }p\left( {{y}_{j}} \right)}$ (8)
where x, y are two vectors of features or classes, and p is a probability. The redundancy of a set of features (S) is measured by:
$Re{{d}_{i}}=\text{ }\!\!~\!\!\text{ }\frac{1}{{{\left| S \right|}^{2}}}\underset{i,j\text{ }\!\!~\!\!\text{ }\in \text{ }\!\!~\!\!\text{ }S}{\mathop \sum }\,M\left( i,j \right)$ (9)
$\left| S \right|$ is the feature’ count in the set, the relevance of (S) for a class variable (h) is measured by:
$Rel\left( M \right)=\text{ }\!\!~\!\!\text{ }\frac{1}{\left| S \right|}\underset{i\text{ }\!\!~\!\!\text{ }\in \text{ }\!\!~\!\!\text{ }S}{\mathop \sum }\,M\left( h,i \right)$ (10)
The final Mutual Information Quotient (MIQ) is then measured using the formula:
MIQ = Relevance / Redundancy (11)
The MRMR is used to rank the QoE parameters obtained from the ITU-T module and the network prob. Nine features of the top ranked by MRMR have been selected to train the ML models for classification and regression. The selected features; video_load_time, video_width, video_height, avg_frame_rate, total_size_with_buffer, avg_bitrate, delay_qos, jitter, and packet_loss, are used as predictors to train the Feed Forward NN classification model. The 5-level MOS scores are used as class labels to compare the prediction performance. The results showed that selecting (λ = 0.001) can enhance the mean validation accuracy and mean test accuracy to 88.28% and 92.11% respectively as shown in Figure 8. Implementing feature selection enhances both the model prediction accuracy and the consumed time for training as shown in Table 1.
Figure 8. Comparing the accuracies for different regularization strength in Exp.2
Regression model also showed low RMSE levels while using (λ = 0.001) as shown in Table 2. The achieved RMSE of this λ is enhanced as compared to corresponding RMSE achieved with this λ in Exp.1, which reflects the enhancement in predicting the QoE.
Table 2. The obtained RMSE values in Exp.2
|
Lambda |
RMSE (Validation) |
RMSE (Test) |
|
0.001 |
0.3295206 |
0.31998229 |
|
0.002 |
0.7132319 |
0.715642549 |
|
0.003 |
0.5521884 |
0.715933276 |
|
0.004 |
0.3368483 |
0.294866572 |
|
0.005 |
0.3288695 |
0.319603725 |
|
0.01 |
0.3345612 |
0.320670226 |
|
0.02 |
0.3750555 |
0.358807455 |
|
0.03 |
0.3438947 |
0.32958596 |
|
0.04 |
0.3512180 |
0.335621035 |
|
0.05 |
0.3455566 |
0.338527433 |
The obtained QoE prediction accuracy in Exp.2 also has been compared to a related work by Elwerghemmi et al. [15] that used similar machine learning implemented in this work as shown in Table 3.
Table 3. Comparing the QoE prediction accuracy with a sample of related works
|
Author |
Naïve Bayes |
Adaboost |
Random Forest |
SVM |
|
Elwerghemmi |
48.15 |
71.03 |
73.7 |
75.29 |
|
This work |
79.92 |
90.09 |
90.35 |
87.74 |
4.3 Experiment 3
In this experiment, only four non-streaming parameters (network parameters) are used as predictors to examine the feasibility of predicting the QoE in a no-reference manner without using the video information of the seen videos. The parameters; avg_bitrate → delay_qos → jitter, and packet_loss have been used as predictors. Despite the small size feature space and excluding the video information features; the achieved classification accuracy was acceptable. The highest mean validation accuracy of 86.28% has been achieved while using (λ = 0.001) as shown in Figure 9. This accuracy can be considered acceptable as an initial QoE estimation depending only on the non-streaming network performance information.
Figure 9. Comparing the accuracies for different regularization strength in Exp.3 using four network features
QoE is an important aspect for ISP and network operators since they tend to obtain the user opining about their services at the client end. MOS is a commonly used measure to measure the QoE, especially after its standardizing by the ITU-T recommendations of HAS-based video streaming. This work showed that combining several network-specific parameters with ITU-T video parameters can provide high QoE prediction performance, especially by using an efficient feature selection criteria. This work also achieved acceptable accuracy even by using simple NR procedure evaluated on the labelled data by ITU-T P.1203 independently on the entire video information from the source. The results of this work came consistent with standards and subjective tests since it has been built and evaluated on labelled data by ITU-T standards, the implementation that was assessed on large size subjective tests.
As a future work, we tend to implement a drive-test using a mobile node such as car equipped with GPS and monitoring end devices, moving within different network operators to augment the mobile network parameters to this prediction work, and to highlight the most important mobile parameters. This addition aims to find the useful and reasonable combinations between the streaming, network, mobile network parameters via analyzing the impact of these parameters on the predicted QoE scores.
Limitations
Although this work used real online generated data and enhanced the QoE prediction compared to several related works, the used data in this work has been obtained from a single specific video service website “Aparat.com” and evaluated using several models of neural network due to time limits. Thus, the generalization and considering models variety can be used to extend this work to achieve better results, which will be considered as a future work in this field to strengthen the obtained prediction results.
[1] ITU-T. (2017). Parametric bitstream-based quality assessment of progressive download and adaptive audiovisual streaming services over reliable transport. ITU-T Recommendation P.1203, International Telecommunication Union.
[2] Skaka-Čekić, F., Baraković Husić, J. (2023). A feature selection for video quality of experience modeling: A systematic literature review. Wiley Interdisciplinary Reviews: Data Mining and Knowledge Discovery, 13(3): e1497. https://doi.org/10.1002/widm.1497
[3] Abbas, N., Taleb, S., Hajj, H. (2021). Video features with impact on user quality of experience. In 2021 3rd IEEE Middle East and North Africa COMMunications Conference (MENACOMM), Agadir, Morocco, pp. 136-141. https://doi.org/10.1109/menacomm50742.2021.9678269
[4] Rajak, A., Tripathi, R. (2023). Classification of services through feature selection and machine learning in 5G networks. Automatic Control and Computer Sciences, 57(6): 589-599. https://doi.org/10.3103/s014641162306007x
[5] Mustafa, R.U., Islam, M.T., Rothenberg, C., Gomes, P.H. (2023). EFFECTOR: DASH QoE and QoS evaluation framework for encrypted video traffic. In NOMS 2023-2023 IEEE/IFIP Network Operations and Management Symposium, Miami, FL, USA, pp. 1-8. https://doi.org/10.1109/NOMS56928.2023.10154448
[6] Cheng, S., Hu, H., Zhang, X., Guo, Z. (2023). Rebuffering but not suffering: Exploring continuous-time quantitative qoe by user’s exiting behaviors. In IEEE INFOCOM 2023 - IEEE Conference on Computer Communications, New York City, NY, USA, pp. 1-10. https://doi.org/10.1109/INFOCOM53939.2023.10228896
[7] Duanmu, Z., Rehman, A., Wang, Z. (2018). A quality-of-experience database for adaptive video streaming. IEEE Transactions on Broadcasting, 64(2): 474-487. https://doi.org/10.1109/TBC.2018.2822870
[8] Hewage, C.T., Ahmad, A., Mallikarachchi, T., Barman, N., Martini, M.G. (2022). Measuring, modeling and integrating time-varying video quality in end-to-end multimedia service delivery: A review and open challenges. IEEE Access, 10: 60267-60293. https://doi.org/10.1109/ACCESS.2022.3180491
[9] Liu, X., Tao, X., Wang, L., Zhan, Y., Lu, J. (2019). Developing a QoE monitoring approach for video service based on mobile terminals. In 2019 International Conference on Computing, Networking and Communications (ICNC), Honolulu, HI, USA, pp. 480-485. https://doi.org/10.1109/ICCNC.2019.8685523
[10] Iazeolla, G., Forconi, S. (2023). Predicting the QoE of video streaming in communication networks. Network and Communication Technologies, 8(1): 38-52.
[11] Tran, H.T., Nguyen, D.V., Ngoc, N.P., Thang, T.C. (2020). Overall quality prediction for HTTP adaptive streaming using LSTM network. IEEE Transactions on Circuits and Systems for Video Technology, 31(8): 3212-3226. https://doi.org/10.1109/TCSVT.2020.3035824
[12] Bampis, C.G., Bovik, A.C. (2018). Feature-based prediction of streaming video QoE: Distortions, stalling and memory. Signal Processing: Image Communication, 68: 218-228. https://doi.org/10.1016/j.image.2018.05.017
[13] Li, C., Lim, M., Bentaleb, A., Zimmermann, R. (2023). A real-time blind quality-of-experience assessment metric for http adaptive streaming. In 2023 IEEE International Conference on Multimedia and Expo (ICME), Brisbane, Australia, pp. 1661-1666. https://doi.org/10.1109/ICME55011.2023.00286
[14] Rao, R.R.R., Göring, S., Vogel, P., Pachatz, N., Villarreal, J.J.V., Robitza, W., List, P., Feiten, B., Raake, A. (2019). Adaptive video streaming with current codecs and formats: Extensions to parametric video quality model ITU-T P.1203. Electronic Imaging, 31: art00015. https://doi.org/10.2352/ISSN.2470-1173.2019.10.IQSP-314
[15] Elwerghemmi, R., Heni, M., Ksantini, R., Bouallegue, R. (2023). An efficient stacked deep incremental model for online streaming video QoE prediction. International Journal of Computing and Digital Systems, 13(1): 1485-1496. https://doi.org/10.12785/ijcds/1301119
[16] Hoßfeld, T., Heegaard, P.E., Varela, M., Möller, S. (2016). QoE beyond the MOS: An in-depth look at QoE via better metrics and their relation to MOS. Quality and User Experience, 1(1): 2. https://doi.org/10.1007/s41233-016-0002-1
[17] Péchard, S., Pépion, R., Le Callet, P. (2008). Suitable methodology in subjective video quality assessment: A resolution dependent paradigm. In International Workshop on Image Media Quality and its Applications, Kyoto, Japan.
[18] Robitza, W., Göring, S., Raake, A., Lindegren, D., et al. (2018). HTTP adaptive streaming QoE estimation with ITU-T rec. P. 1203: Open databases and software. In Proceedings of the 9th ACM Multimedia Systems Conference, Amsterdam, Netherlands, pp. 466-471. https://doi.org/10.1145/3204949.3208124
[19] Hassani Shariat Panahi, P., Jalilvand, A.H., Diyanat, A. (2024). A new approach for predicting the Quality of Experience in multimedia services using machine learning. arXiv e-prints, arXiv-2406. https://doi.org/10.1109/OJCOMS.2025.3543750
[20] Michelucci, U. (2018). Applied Deep Learning. Springer.
[21] Katanforoosh, A., Kunin, C. (2019). Initializing neural networks. DeepLearning.AI.
[22] He, K., Zhang, X., Ren, S., Sun, J. (2015). Delving deep into rectifiers: Surpassing human-level performance on ImageNet classification. In 2015 IEEE International Conference on Computer Vision (ICCV), Santiago, Chile, pp. 1026-1034. https://doi.org/10.1109/ICCV.2015.123
[23] Jo, I., Lee, S., Oh, S. (2019). Improved measures of redundancy and relevance for mRMR feature selection. Computers, 8(2): 42. https://doi.org/10.3390/computers8020042