Hrushik Mehta*![]() | Vraj Deriya
| Vraj Deriya![]() | Darshana Sankhe
| Darshana Sankhe![]() | Pratik Kanani
| Pratik Kanani![]() | Gayatri Pandya
| Gayatri Pandya![]() | Vishakha Shelke
| Vishakha Shelke![]()
© 2025 The authors. This article is published by IIETA and is licensed under the CC BY 4.0 license (http://creativecommons.org/licenses/by/4.0/).
OPEN ACCESS
Effective garbage disposal is increasingly challenging with growing urban populations. This article presents Trash Tech, a novel IoT-based smart waste management system that comprises real-time gas and fill-level monitoring, and route optimization. The system employs ESP8266 microcontrollers and custom sensors installed in garbage bins to provide meaningful information through a mobile application to urban authorities. Experimental results reveal a 20% reduction in the number of collection trucks needed, significantly decreasing fuel consumption and operating cost, and lowering the carbon footprint. The system also monitors levels of hazardous gases to identify high-risk hotspots for due treatment. Experimentation in Mumbai's Malad zone confirms the success of the system in route optimization of waste collection and improvement in urban sanitation. This system represents a significant forward over traditional waste management systems, contributing to cleaner and greener cities.
smart garbage monitoring, IoT trash bins, waste collection, methane sensors, ammonia sensors, hydrogen sulphide sensors, ultrasonic sensors, pickup optimization
Urban waste management is a prominent challenge in the fast-developing urban areas of the world, with India being a prime example. Urbanization is speeding forward at a remarkable speed, creating an amount of daily generation of trash at appalling levels. India, in 2021, was producing over 160,000 metric tons of trash daily, an amount that increases in direct proportion with the size of the population and the changing lifestyles. Such a high amount of trash generation creates immense challenges before the municipal bodies, as they are finding it extremely tough to carry out collection, transport, and disposal in an optimized manner. Traditionally employed collection methods, based on predetermined routes and time schedules, are often found lacking in serving the needs of modern urban environments. Inadequate collection, over-packed bins, and poor routing are surfacing from such conventional methods. Municipal vehicles are presently picking up household trash and taking it to the sites of disposal in the nearest location; however, the process is plagued with inefficiencies. Route optimization is not taking place, thereby increasing the travel distance of vehicles, further increasing the consumption of fuel and operating costs. Irregular collection schedules result in filled bins, creating not only obnoxious odors but also nuisance-causing rodents that are vector-borne and carry disease, thus compromising public health. In addition, no real-time monitoring is restricting the government’s ability to measure the fill levels of bins correctly, thereby leading to sustainable and technology-driven approach to urban waste management. To meet these challenges, route optimization is essential for the effective and orderly collection of waste. By utilizing real-time information from Internet of Things (IoT) sensors, municipalities can optimize collection routes according to the real fill levels of the waste bins, minimizing the number of trucks required and lowering travel distances. This strategy not only leads to lower operational costs but also to lower carbon emissions, thus making urban areas cleaner and more sustainable. In addition, regular bin emptying and sanitation require the monitoring of odor levels continuously so that the authorities can identify locations with high odor concentrations and mark them as odor-prone areas. Such a proactive approach can help mitigate public health threats and improve the overall urban quality of life. Another important aspect of waste management is the monitoring of methane emissions from waste bins. Flammable methane is produced during organic waste decomposition processes. High concentrations of methane in trash cans create serious fire risks, especially for city centers with high concentrations of people in urban areas. Real-time IoT sensor-based tracking of methane concentrations, as conceived by Ahmed et al. [1], can serve as early signals of rising concentrations of methane and allow agencies to take remedial action against possible catastrophes. Moreover, monitoring of other obnoxious emissions like hydrogen sulphide and ammonia can provide assistance for city-level odor pollution and public sanitation. IoT integration with waste management systems has proved effective in reducing the said problems. IoT-powered sensors in intelligent trash cans can potentially provide immediate information regarding fill levels, gas emissions, and geographic positions and thereby allow agencies to make well-judged decisions and optimize waste collection processes. IoT and cloud analytics have opened up possibilities of bringing traditional waste management systems into scalable and economical models of city adoption. For example, research in Henaien et al. [2] shows that IoT solution strategies have the capacity for increasing the efficiency of the waste collection process up to 30% and thereby bring considerable cost and environmental benefits. Similarly, Lakhouit [3] explained the effectiveness of artificial intelligence strategies for improving the efficiency of the collection process with implications for cost-saving and resource efficiency. In spite of all these advancements, it should be observed that most of the existing IoT-powered waste management systems focus only on fill levels of trash cans as their only most serious issue to the virtual exclusion of other serious ones like emissions of methane and odor control, and thus lose their usefulness for coping with the entire spectrum of waste management system problems of cities.
References In order to bridge this gap, we introduce Trash Tech, IoT waste management system with real-time monitoring, dynamic route optimizer, and odorous and methane emission mapping to provide end-to-end solution for the intricacies of city waste management. With several innovative features for city trash management, the Trash Tech system includes additional IoT sensors that provide real-time monitoring of bin fill levels, gas emissions, and odors, thereby providing the municipality observational insight information. The multi-sensory nature of the system provides deeper insight into waste management-related concerns, thereby allowing focused intervention on specific issue like fire risk control and odor control. Aside from all that, the system includes dynamic route optimizer, thereby reducing garbage trucks by approximately 20%, thereby resulting in considerable savings on operating costs as well as carbon footprint. Through garbage bin routing via optimized routes through information in real-time, Trash Tech prevents garbage bins from overfilling, thus reducing the occurrence of unsanitary conditions as well as public health complaints. Aside from that, Trash Tech utilizes very accurate sensors, the ADS1115 analog-to-digital converter of 16-bit-resolution, thereby accurate measurements of gas levels and bin fill levels are taken. High accuracy in measurements ensures more accurate decisions, thereby improving the effectiveness as well as efficiency of the process of collections. Aside from all that, the system utilizes cloud-based analytics for information storage and processing garnered from several sensors, thereby providing the governance with a bird's eye view for information gathering process. Such data-oriented approach, in addition to improving effectiveness in information gathering, further aids in planning for the future and resource provisioning through predictive analysis. The application of IoT and cloud analytics for Trash Tech provides a giant jump from traditional approaches towards the process of collections. By providing actionable learning and defining the need for raising the garbage collection frequency, the system has the significant role of facilitating the achievement of clean, secure, and sustainable city environments. Its application in Malad, Mumbai, brought about significant improvement in terms of efficiency of collection, as evidenced through the number of garbage trucks required that decreased by 20%, as well as through the savings in terms of fuel and maintenance cost. Such evidence is reflective of the ability of Trash Tech in minimizing breakdowns for traditional collecting systems and thus facilitating the achievement of more intelligent and more sustainable city environments.
The integration of IoT technology and cloud computing in the automation of waste monitoring and disposal has been a topic of great academic interest, with worthy results in developing smarter waste management systems. The real-time information is utilized to enhance the efficiency of wastes collection and disposal [4]. Vamsi et al. [4] confirmed that the suggested system centered on IoT and cloud technology gives sanitation workers and concerned authorities’ real-time information, enabling effective and timely processing of wastes. Yadav and Khan [5] theorized that the architecture of such systems typically involves three layers: bottom-up sensing, network, and application service, concluding in an integrated IoT system. Utilization of cloud technology in these systems enables the future usage of information deposited in monitoring open dumps and secondary operations such as recycling of wastes [6]. Vamsi et al. [4] noted that IoT and cloud technology-based system provides real-time information to sanitation workers and respective authorities, thereby facilitating timely and efficient waste management. Yadav and Khan [5] explained that the framework of such a system generally comprises three layers: network, bottom-up sensing, and application service, and hence a generic IoT infrastructure. The use of cloud technology in such a system is in a way that it keeps open the possibilities of future use of the data gathered in open dump monitoring and secondary operations such as recycling wastes [6]. These are some of the essential system components with devices to monitor GPS mounted on every smart bin, allowing monitoring devices to be aware of where the bins are and forward the information to truck drivers to guide them on the best collection routes [7]. Incorporating Wi-Fi modems, ultrasonic sensors, chemical sensors, and GSM modules yields effective monitoring and management of wastes [8]. ESP8266 Wi-Fi module, specifically, provides projects with internet connectivity, thus enhancing their applicability at low cost [9]. Ultrasonic sensors are used to show the amount of waste buildup in trash bins [10], and MQ4 sensors with variable resistors are used to detect the concentration of gases [11]. The data collected is stored in the cloud for utilization in waste generation prediction and enhancement of waste management policies [12]. Firebase, which is a cloud platform, stores this data in a JSON form and is in real-time sync with the devices connected to it, such as trash cans and Android applications [13]. Using an Android application, the users can view information of latitude, longitude, volume, and weight of the bins, while the same data is also visible on a web server and saved in a database [14]. Optimization of waste collection involves route calculation with minimal distance to travel and maximal quantity of waste to collect with respect to real-time parameters [15]. There are sophisticated algorithms for garbage collection that consider truck capacity, garbage size, and cluster bundling with the objective of optimizing the process and removing most of the usual issues. The challenges in deployment of such systems include maintaining the accuracy of sensors via more than one ultrasonic sensor, having a stable internet connection for uploading data, and covering sensitive parts against exposure to moisture [16]. Together, these works refer to the prospects of IoT and cloud technology in reshaping waste management systems with efficient and sustainable solutions for urban cities. Table 1 presents an overview of the different microcontroller boards mentioned in the relevant research works. These boards share similar functionality with the ESP8266. The ESP8266, utilized in Trash Tech, however, stands out specifically because it is very low in cost and has onboard Wi-Fi capability.
Table 1. Microcontrollers used for hardware
|
References |
Board Used |
|
[10] |
Raspberry Pi |
|
[2] |
Zigbee |
|
[4], [7], [13], [15], [17] |
Arduino UNO |
|
[6] |
Arduino ATmega 2560 |
|
[11] |
WeMos |
Recent developments in IoT-based waste management systems have focused on improvements in real-time monitoring, route optimization, and gas detection functionalities. Ahmed et al. [1] conducted an analysis of artificial intelligence and Internet of Things-driven architectures for municipal waste management, highlighting the effectiveness of route optimization algorithms for finding optimal routes for collection vehicles but not discussing implementations on methane or odor detection systems. Similarly, Henaien et al. [2] proposed a sustainable Smart City Solid Waste Management System using IoT and Low Power Wide Area Networks that demonstrated higher accuracy in bin monitoring and collection rates, although their system mainly dealt with bin fill levels without the inclusion of gas sensing functionalities. Lakhouit [3] conducted a comprehensive review of AI and IoT applications in waste collection, sorting, and recycling, highlighting their transformative impact on urban waste management but without discussing specific implementations on methane detection. Palagan et al. [17] proposed a predictive analytics-based system that uses edge computing and blockchain technology, with an accuracy rate of 99.25% for predicting bin status; however, their system was concerned with waste accumulation and not with the detection of hazardous gases. Chavhan et al. [18] developed an autonomous IoT-based monitoring system for industrial wastewater, successfully integrating multi-parameter sensors; however, their system was specifically for water quality monitoring and not for solid waste management. The Trash Tech system proposed here includes real-time monitoring, dynamic route optimization, and mapping of methane and odor emissions, thus providing a more integrated solution for urban waste management. In contrast to existing systems, Trash Tech not only monitors bin fill levels but also detects methane and odor emissions, thus providing actionable information to concerned authorities. In addition, the dynamic optimization algorithm that the system uses reduces the number of garbage trucks required by a rate of about 20% with appreciable cost and time savings. This multi-faceted approach remedies the deficits in traditional approaches, thus providing Trash Tech with an expandable and viable solution to today's waste management issues [19-23].
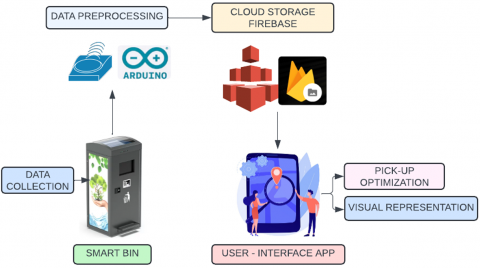
One of the things that would be used in solving our community issue of random waste disposal resulting in full bins and unhygienic surroundings is a smart system Trash Tech based on IoT technology. The solution involves equipping each bin with ESP8266 microcontrollers. The microcontrollers will be connected with special sensors that will be employed for monitoring the status of each bin. The sensor input will be used by a specific app for optimisation and scheduling of the area's garbage disposal process. Figure 1 shows information flow in garbage monitoring systems.
Figure 1. Flow of data through the garbage monitoring system
3.1 Data collection
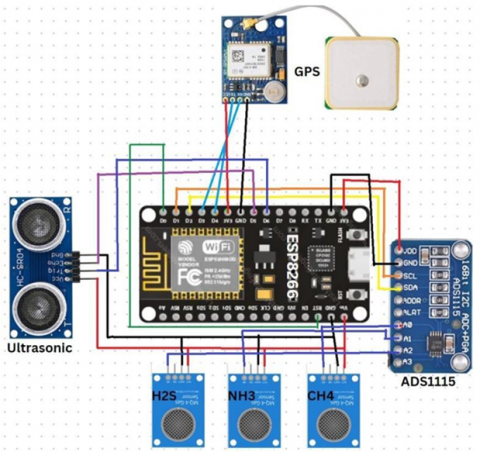
An assortment of specialized sensors, coupled with a microcontroller, is used for gathering significant information from the bins. The heart of the system is the ESP8266 microcontroller, which is valued for its small size and affordability, utilizing Wi-Fi capabilities for seamless communication. The microcontroller is compatible with programming languages like Arduino C++, Lua, and MicroPython, and is supplemented with specialized tools like the Arduino IDE, thus fostering the design of new solutions.
The Ultrasonic Sensor is founded on the operation of producing high sound waves and determining the length of the sound waves reflected. The sensor is capable of detecting pulses that are inaudible and understanding reflected pulses off surfaces in order to calculate distances based on the velocity of sound. The Methane Sensor detects levels of methane gas in the atmosphere and functions like a specialized sense of smell. The MQ4 detector is capable of detecting even low levels of the flammable gas, which is helpful in case of concerns regarding security. The GPS Sensor hastens the process of obtaining information through the determination of accurate points on surfaces of the Earth based on signals from satellites orbiting the Earth. The devices note accurate places and times from satellites in order to provide accurate information about several places. The H2S Sensor is important for security as it detects levels of the hydrogen sulfide gas and triggers the early alarm system in order to prevent possible danger. The conductivity of the MQ136 increases with increased levels of the H2S gas, allowing for detection of even low odors from garbage bins. The Ammonia Sensor is capable of detecting putrid odors, thus facilitating attempts at monitoring the environment. The MQ137, which is economical and sensitive, is the first line of defense against hidden danger of ammonia-contaminated environments, thus facilitating security in the environment and improving efficiency of processes. The ADS1115 module has a bit resolution of 16 and is capable of recording up to a sample of 860 per second via I2C interfacing. The module is helpful in achieving accurate conversion of the digital from the analog, enabled through four input pins for providing support of the analog for effective acquisition of information. GPIO16 is also coupled with the RST of the ESP8266 for power-saving sleep mode functionality. All of these put together form advanced circuitry for efficient information gathering. The Trash Tech system utilizes the ESP8266 microcontroller based on its effectiveness costwise and presence of integrated Wi-Fi capabilities without the need for external communication modules like Zigbee or WeMos. The system utilizes the ADS1115 analog-to-digital converter for more accurate measurements with the provision of a 16-bit resolution far better than utilizing standard Arduino boards with 10-bit resolution. This enhances the ability for more precise detection of bin fill levels and gas concentration, thus allowing for more accurate decision-making concerning waste and hazard mitigation. The overall architecture of the IoT-enabled smart bin setup is illustrated in Figure 2.
Figure 2. Schematic diagram with IoT components
3.2 Data pre-processing
The initial step of data preprocessing in intelligent garbage monitoring systems is pivotal in purifying the raw data gathered from a number of garbage bin sensors. The gathered information has several features, from which the main feature is selected. The application of the GPS sensor delivers features comprised of latitude, longitude, altitude, as well as number of satellites in view, from which the derived primary features are the longitude and latitude of garbage bins. Data integration is necessitated as a result of convergence of information from multiple diverse sensors such as depth, odor, and flammability sensors. The main features from diverse sensors are consolidated in homogenized fashion, thereby allowing the garbage collecting agency to derive actionable information and establish evolving patterns. Data processing is subsequent to integration, where diverse types of information from diverse sensors are standardized. Processing delivers consistency, thereby allowing comparison and analysis in non-ambiguity. The ultrasonic sensor reading is measured in terms of percentages for the purpose of rendering consistency of bin fill levels, while information from odor and methane sensors is measured in terms of parts per million (ppm). Data aggregation involves summarization of purified information through calculations of averages or totals over defined time periods. Averages of bin fill levels, for example, are computed on daily basis. The summarized information delivers valuable information in garbage bin garbage collecting routes as well as number of garbage collecting trucks to be used, thus enhancing the efficiency of the system. A data processing algorithm is used in the purification of information gathered from the sensors, integration, aggregation, and processing, with the processed information being transmitted through Firebase. Here, Arduino's Integrated Development Environment (IDE) is used as the compiler with which the microcontroller boards are programmed and designed. The Adafruit ADS1X15.h and TinyGPS++.h libraries are also being used for digitizing the analog signals and for retrieving GPS coordinates, respectively. For processing the data, several libraries are used.
3.3 Data storage
The smart trash monitoring system depends on the ESP8266 microcontroller to send real-time sensor feedback from trash bins to firebase, a cloud database. Firebase securely hosts various types of sensor data like ultrasonic, methane, GPS, hydrogen sulfide, and ammonia sensors. NoSQL databases provide schema flexibility, which is a requirement for IoT applications, with support for various sensor types without pre-defined schemas for the data. Firebase's real-time database supports the enforcement of rules for data integrity maintenance and access control. Combine this with Firebase's authentication and encryption capabilities for improved security. The design offers real-time trash bin and ambient condition statuses with scalability, security, and proper handling of the data.
|
Algorithm 1: Data processing |
|
WiFi and Firebase credentials Periodic data transmission to Firebase procedure INIT_WIFI Connect to WiFi using credentials while WiFi is not connected do Wait for connection end end procedure SETUP Initialize Serial and GPS communication Call INIT_WIFI Start NTP client Configure and connect to Firebase Get User UID and update database path Initialize sensors end procedure LOOP Call SMARTDELAY(10000) Get current date and sensor readings Compute gas concentrations and distance Get GPS data if Firebase is ready and timer delay has elapsed then Update timestamp and database path if Bin is full or gas levels are high then Update status to “Filled” else Update status to “NotFilled” end Send data to Firebase end Wait for 5 seconds end procedure SMARTDELAY(ms) Delay while processing GPS data end SETUP while true do LOOP end |
3.4 Pick-up optimization
Based on the data gathered from the smart bins, we formulate adaptable routes for each garbage truck.
|
Algorithm 2: Trash Tech optimised pickup algorithm: Garbage pickup with dynamic truck assignment |
|
Array of coordinates (lat, lon, volume) Allocation of routes to truck numbers Initialize an array of coordinates C where the dustbins are filled Sort coordinates C by some criteria (Euclidean distance) Initialize an empty garbage truck T while C is not empty do for each dustbin (x, y, volume) in C do if T has space for volume from (x, y, volume) then Fill T with volume from (x, y, volume) end else /* If T is filled to 90% capacity */ Assign a new garbage truck T′ Sort remaining coordinates C and fill T′ until T′ is 90% filled T ← T′ end end end |
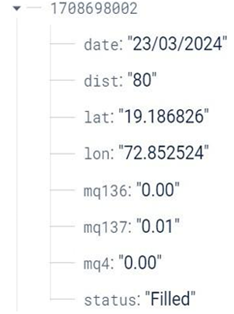
Figure 3. Firebase data layout
Here we explain the steps of Algorithm 2 in detail:
1. Initialization: The algorithm begins by initializing an array C which contains the coordinates and volume of each filled dustbin. This is represented as C = {(2, 3, volume), (5, 7, volume), (8, 1, volume), ...}.
2. Sorting: The coordinates in C are sorted based on Euclidean distance or another relevant criterion to deter mine the optimal pickup sequence.
3. Truck Initialization: An empty garbage truck T is initialized to start the collection process.
4. Collection Process: While Loop is used to ensure the process continues until all dustbins are emptied. Inside the loop, a for loop iterates over each dustbin represented by (x, y, volume) in C.
5. Filling the Truck: The algorithm checks if the current truck T has enough space to accommodate the volume of the current dustbin.
If yes, the truck T is filled with the volume from the current dustbin.
If no (i.e., the truck is filled to 90% capacity), a new garbage truck T′ is assigned.
The remaining coordinates in C are then sorted again, and the new truck T′ is filled until it reaches 90% capacity. The current truck T is then updated to T′.
A. Privacy and network infrastructure solutions
The system has robust privacy protection through several mechanisms of anonymizing the data, aimed at maintaining users' anonymity while abiding by demanding legislation. Data anonymization includes GPS coordinates rounded for accuracy of 100 meters in grid formation, the utilization of Universally Unique Identifiers (UUIDs) as stand-ins for precise location names in bin names, avoiding the gathering of information pertaining to persons, and publishing only aggregations of information based on zones in order not to track persons.
Firebase Security Compliance provides further security for the information as per businesses utilizing ISO 27001-compliant environments. Firebase is GDPR-compliant for processing, has AES-256 encryption for all transfers, and implements role-based security for controlling the accessibility of information based on the hierarchical company structure and user identity.
The hybrid communication approach successfully overcomes connectivity problems in diversified city and rural installation environments with the help of a multi-layer network solution. In the said solution, Wi-Fi has been used as the prime communication channel in city installations with 90% coverage, while it utilizes Long Range Wide Area Network (LoRaWAN) for communication in remote and rural installations with poor internet infrastructure. The fallback channel is the GSM/3G for emergency notification messages and automatic synchronization upon regaining connectivity.
Its phased deployment approach is starting with deploying Wi-Fi infrastructure citywide and growing the footprint further through deploying LoRaWAN gateways and finally deploying hybrid network for the end-to-end communication in all the target areas with the aim of improving system reliability and coverage areas.
3.5 Visual representation
Data visualization is one of the most significant elements of the Trash Tech system in understanding and communicating the intelligence of gathered data. Data information is rendered into easy-to-understand visual representations with the help of tools such as React Native and Google Maps. React Native, upon which applications are created with the help of Visual Studio Code and hosted with Expo Go, creates apps for the waste management wing. The apps enable fill levels and trend monitoring of bins in real-time. react-native maps and react-native-google-maps-directions libraries are used for displaying bin location on Google Maps and providing directions for the garbage vans from one dustbin to another. Garbage Pickup Vans allocation algorithm creates the garbage vans' route planning. Garbage collection route optimization is enabled through it with trucks being able to be aptly allocated to which bins they should service. The tools provide an overall overview of system performance with the ability to make decisions based on it for garbage management efficiency improvements. The firebase-based data structure used to manage these dynamic routes and bin statuses is shown in Figure 3.
3.6 Formulation
A. Capacitated Vehicle Routing Problem (CVRP) Formulation.
Let G = (V, E) be a complete graph, where V = {0, 1, 2, ..., n} represents bins (0 is depot), E represents edges between locations, dij= Euclidean distance between bins i and j.
Objective Function:
$\min \sum k \in k \sum i \in v \sum j \in V c_{i j} \cdot x_{i j k}$
Subject to Constraints:
Vehicle capacity:
$\sum i \in V q_i \cdot \sum j \in V x_{i j k} \leq 0.9 \cdot Q_k \forall k \in K$
Each bin visited once:
$\sum k \in k \sum i \in V x_{i j k}=1 \, \forall j \in V, \forall k \in K$,
Flow conservation:
$\sum i \in V x_{i j k}-\sum i \in V x_{i j k}=0, \forall j \in V, \forall k \in K$
where, $x_{i j k}=1$ if vehicle k travels from bin i to $\mathrm{j}, 0$ otherwise, $q_i=$ waste volume at bin I, $Q_k=$ capacity of vehicle $\mathrm{k}, c_{i j}=$ cost of traveling from i to j.
B. Dynamic Threshold Algorithm.
Pseudocode:
|
Algorithm 3: Dynamic Route Optimization |
|
Input: BinData [], TruckCapacity, ThresholdFill = 0.75 Output: OptimizedRoutes [] 1. Initialize: ActiveBins = [] 2. For each bin in BinData: If bin.fillLevel ≥ ThresholdFill: ActiveBins.add(bin) 3. Sort ActiveBins by priority score: Priority = fillLevel * 0.6 + gasLevel * 0.4 4. Apply CVRP solver with 90% capacity constraint 5. Return optimized routes |
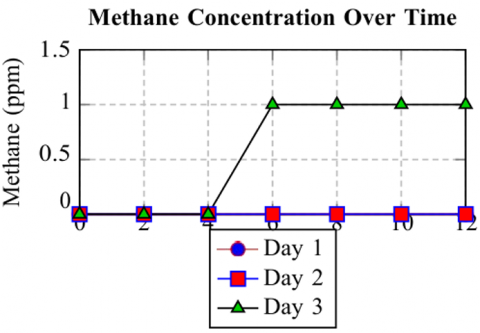
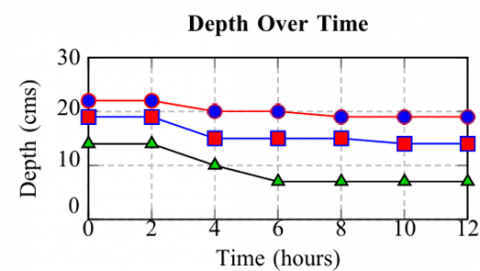
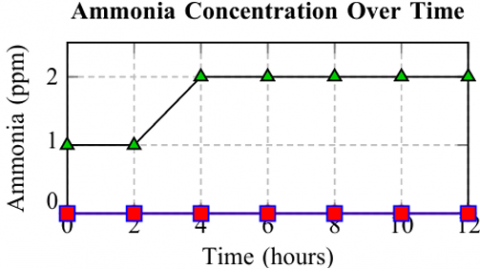
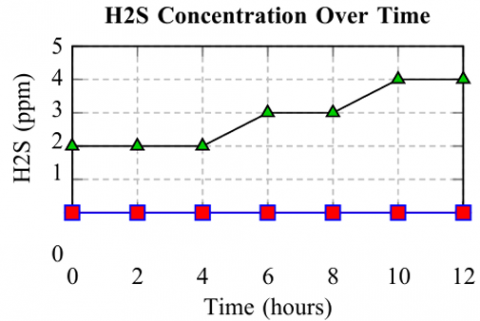
Trash Tech, utilizes IoT sensors and the ESP8266 microcontroller, significantly reduces the cost per unit to 5000 INR, compared to higher costs in similar research papers. Integrating the ADS1115 analog-to-digital converter enhances precision from 10 bit of Arduino UNO to 16 bit in waste management monitoring. The built-in Wi-Fi functionality of the ESP8266further reduces costs and complexity compared to systems using separate Wi-Fi modules, as seen in multiple research papers mentioned above. Deep Sleep helps to increase the battery life of the circuit so that it can be used for a longer period of time. This balanced approach to cost and precision makes This solution ideal for scalable, real-world deployments in smart city applications. The developed system extends beyond quantity measurement to include real time monitoring of odorous gases, addressing a crucial gap overlooked by previous research. Sensors such as MQ136, MQ137, and MQ4 detect hydrogen sulfide, ammonia, and methane levels, respectively. The app provides timely alerts to the municipality for garbage pickups whenever a certain threshold is crossed. In Figure 4, the analysis over a three-day period illustrating the gas emissions from the garbage bin is presented. Garbage was added to the dustbin daily, and the gas emission readings were recorded throughout this period for 3 days. Figures 5-8 display graphs where gas emissions (in ppm) and depth (in cm) are plotted on the y-axis, and time (in hours) is plotted on the x-axis. From the graphs plotted it is seen that odor emissions are minimal initially but increase exponentially with time. Odor present majorly depends on the type of garbage present in the dustbins. Spoiled garbage (meat and fish scraps, dairy products, egg shells) generally produce more odors compared to other dry waste.
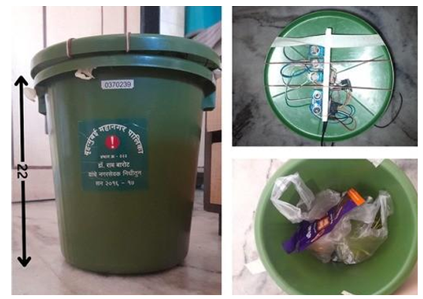
Figure 4. Hardware setup in dustbin
Figure 5. Methane concentration over time
Figure 6. Depth unfilled over time
Figure 7. Ammonia concentration over time
Figure 8. Hydrogen sulfide concentration over time
This system includes a mobile application using react native to present the data collected from the sensors and devise routing for the garbage pickup vans. We conducted an experiment by mapping the locations of bins in the Malad area of Mumbai.
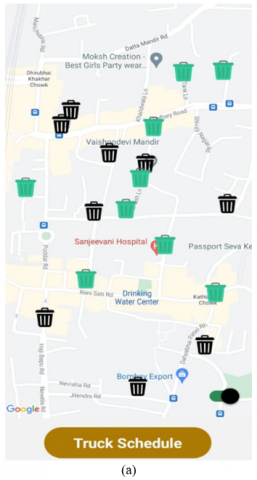
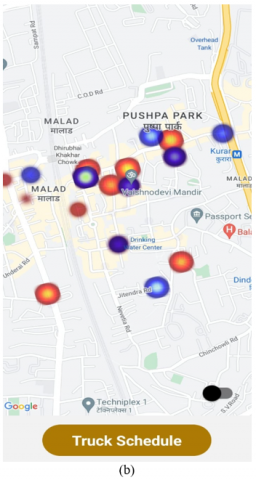
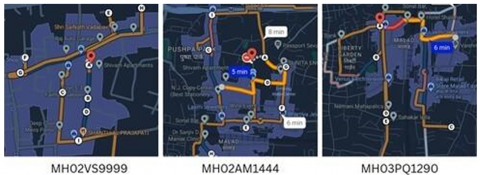
As shown in Figure 9, the bins are marked on the map, with green indicating empty bins and black indicating filled ones. This graphical representation will enable users directly recognize those areas which need priority attention. Figure 9 shows emission of odor and methane from bins, using red color for emission of methane and blue color for emission of odor. We can mark those areas with more emission of odor with more quantity of emission and keep their waste properly. Such places can be marked as odor prone area or methane prone area and special attention has to be given for it. The app also includes the facility of route optimization wherein trucks are assigned route based on the condition of dustbin as described above. Drivers can see the trucks assigned and respective route on app screen. On clicking on truck number seen in Figure 10, drivers can see navigation instruction which guides them through all the full dustbins on respective assigned route from their starting point and reaching nearest dump yard. Entire route for respective driver is seen on app screen. This study confirms that the implementation of smart garbage monitoring system in Malad can reduce the number of garbage trucks needed effectively. It indirectly also reduces time, money, and distance covered by the trucks.
Figure 9. Visualization of filled and empty bins and visualization of heatmap for odor and methane gas
Figure 10. Visualization of route generated by trucks for current system for sample 1
Table 2. Bin filled percentage and status table
|
S. No. |
Sample 1 |
Sample 2 |
Sample 3 |
|||
|
Filled (%) |
Status |
Filled (%) |
Status |
Filled (%) |
Status |
|
|
1 2 3 4 5 6 7 8 9 10 11 12 13 14 15 16 17 18 19 20 21 22 23 24 25 26 27 28 |
45 95 22 68 32 14 56 88 29 73 19 65 37 71 62 28 83 11 18 24 52 78 33 60 10 60 20 30 |
NF F NF F NF NF NF F NF F NF F NF F F NF F NF NF NF NF F NF F NF F NF F |
20 80 10 90 15 10 60 80 75 79 13 70 20 70 60 17 90 10 10 10 70 85 20 65 10 70 40 38 |
NF F NF F NF NF F F F F NF F NF F F NF F NF NF NF F F NF F NF F NF NF |
15 85 20 68 32 14 60 28 20 79 19 35 37 67 22 98 30 21 38 24 52 10 23 66 70 40 60 50 |
NF F NF F NF NF F NF NF F NF NF NF F NF F NF NF NF NF NF NF NF F F NF F NF |
Remark: NF represents garbage bins which are not filled, and F represents bins which are filled.
We conducted an experiment by collecting three samples on the status of garbage bins in the Malad area of Mumbai. Table 2 presents detailed information about whether the bins were filled or not filled, along with the specific amount of garbage present in each bin. In total, we collected data from 28 bins. Based on this data, we calculated the number of trucks required for garbage collection using two different approaches: the current traditional method and the method described in the paper- Trash Tech. This analysis aims to compare the efficiency and effectiveness of the two methods in managing garbage collection in the area.
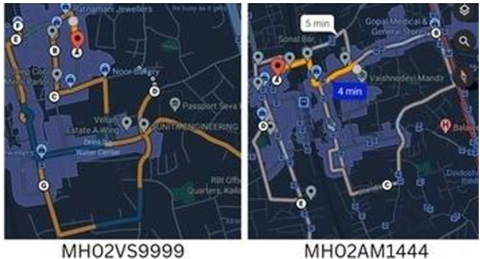
Tables 3-5 provide detailed lists of bin numbers (referred to as “S. No” in Table 2) that trucks will visit under both the current system and the Trash Tech system. These tables offer a comparative view of the routes assigned to each truck, showcasing how the Trash Tech system optimizes or alters the bin collection sequence compared to the current system. Additionally, Figures 11 and 12 visually represent these route allocations for each truck under both systems, highlighting the differences in their operational strategies. Table 6 provides a detailed comparison of the total distance covered by the trucks, the total time taken, and the number of trucks required for garbage collection using both the current system and the Trash Tech system. The data reveals a noteworthy improvement in efficiency with the smart system. Specifically, the number of trucks required to collect the garbage decreased significantly from 3 to 2. This decrease not only implies fewer trucks on the road but also highlights a more streamlined and efficient collection process. Furthermore, the distance covered by the trucks and the total time taken for garbage collection also saw a considerable reduction. This implies that the smart system not only reduces the number of trucks needed but also optimizes their routes and schedules, leading to less time and distance spent on garbage collection activities.
Table 3. Sample 1: Truck allocation comparison
|
Truck Allocation Using Current System |
|
|
Truck Number |
Bin Serial Number on route |
|
MH02VS9999 MH02AM1444 MH03PQ1290 |
1, 2, 4, 3, 5, 15, 17, 6, 18, 7, 12 8, 9, 11, 19, 16, 13, 20, 24, 10, 25, 14, 21 23, 26, 22, 27, 28 |
|
Optimised Truck Allocation Using Trash Tech System |
|
|
Truck Number |
Bin Serial Number on route |
|
MH02VS9999 MH02AM1444 |
2, 4, 12, 8, 17, 15 11, 8, 9, 22, 24, 28 |
Table 4. Sample 2: Truck allocation comparison
|
Truck Allocation Using Current System |
|
|
Truck Number |
Bin Serial Number on route |
|
MH02VS9999 MH02AM1444 MH03PQ1290 |
1, 2, 4, 3, 5, 15, 17, 6, 18, 7, 12 8, 9, 11, 19, 16, 13, 20, 24, 10, 25, 14, 21 23, 26, 22, 27, 28 |
|
Optimised Truck Allocation Using Trash Tech System |
|
|
Truck Number |
Bin Serial Number on route |
|
MH02VS9999 MH02AM1444 |
2, 4, 12, 8, 17, 15, 7 9, 14, 24, 21, 10, 22, 26 |
Table 5. Sample 3: Truck allocation comparison
|
Truck Allocation Using Current System |
|
|
Truck Number |
Bin Serial Number on route |
|
MH02VS9999 MH02AM1444 MH03PQ1290 |
1, 2, 4, 3, 5, 15, 17, 6, 18, 7, 12 8, 9, 11, 19, 16, 13, 20, 24, 10, 25, 14, 21 23, 26, 22, 27, 28 |
|
Optimised Truck Allocation Using Trash Tech System |
|
|
Truck Number |
Bin Serial Number on route |
|
MH02VS9999 MH02AM1444 |
2, 4, 12, 16, 14, 24, 25 16, 27 |
Figure 11. Visualization of optimised route generated by trucks for Trash Tech system for sample 1
Table 6. Comprehensive route optimization results
|
Sample |
Bins Filled |
Traditional System |
Trash - Tech System |
Improvement |
|
|
|
Trucks |
Distance |
Time |
|
1 (28 bins) |
18 |
3 |
87.2 km |
4.2 hr |
|
2 (28 bins) |
16 |
3 |
92.1 km |
4.6 hr |
|
3 (28 bins) |
20 |
3 |
89.7 km |
4.4 hr |
|
Average |
18 |
3 |
89.7 km |
4.4 hr |
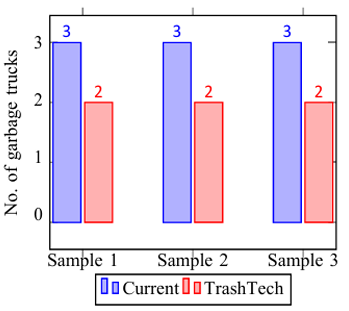
Figure 12. Bar graph showing values for no. of trucks required for three samples of 28 bins each
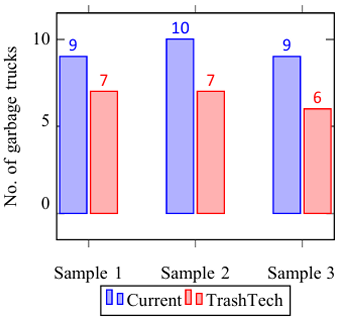
Figure 13. Bar graph showing values for no. of trucks required for three samples of 100 bins each
Figure 12 presents a bar graph comparing the current system and Trash Tech system across three samples, each containing 28 bins. The graph illustrates a decrease in the number of trucks needed for garbage collection when utilizing the Trash Tech system. This reduction highlights the system’s ability to optimize operations and enhance efficiency in waste management.
After conducting an experiment using a synthetic dataset comprising three samples, each consisting of 100 garbage bins. We evaluated both the current system and the Trash Tech system. This analysis revealed a notable reduction in the number of trucks needed for garbage collection with the implementation of the Trash Tech system. This finding underscores the Trash Tech’s efficiency in optimizing route planning and resource allocation, leading to improved operational effectiveness in waste management. Figure 13 represents the bar graph for all three samples for100 bins. We can see that there is a reduction in the number of trucks required for garbage collection.
Odor-Prone Zone Definition:
High Priority: NH₃ > 50 ppm OR H₂S > 20 ppm
Medium Priority: NH₃ 25-50 ppm OR H₂S 10-20 ppm
Low Priority: Below threshold levels
Overall, this mobile application serves as a practical solution for improving waste management efficiency, reducing operational costs, and promoting environmental sustainability through the smart utilization of technology.
A comparative summary of truck count, collection time, and distance between the traditional and Trash Tech systems is provided in Table 7.
Figure 12 shows data for the sample of 28 bins, and Figure 13 shows synthetic data for 100 bins. Figure 12 and Figure 13 reveal that there are fewer trucks required for garbage disposal as compared with the traditional system utilized and the amount of saving is of the order of 20%. The saving decreases the travel distance of the trucks and decreases disposal time for the waste. Odor from the bins is detected and monitored, and odor-emitting zones are detected as odor-prone zones and treated with special treatment. Methane gas is detected continuously for mitigating health hazard in the region. Trash Tech is also economical in terms of cost through its application of ESP8266 module, as from Table 1, and the cost of the overall system comes out to be 5000 INR per bin. Evidently, the present study discusses the great prospect of smart bin technology for improving city waste disposal systems.
Table 7. Comparison of distances, times, and number of trucks
|
Sample No. |
Current Method |
Trash Tech System |
|
Total Distance (km) |
||
|
1 2 3 |
98 96 98 |
61 65 62 |
|
Total Time (hrs) |
||
|
1 2 3 |
4 3.85 4.1 |
2.5 2.8 2.35 |
|
No. of Garbage Pickup Trucks Required |
||
|
1 2 3 |
3 3 3 |
2 2 2 |
5.1 Capacity threshold analysis
The 90% truck capacity threshold is based on:
Industry Standards:
Recommendations for municipal solid waste collection provide for 85-95% capacity usage, and sensitivity analysis shows that more than 90%, although there is marginally improved efficiency, excess capacity is significant. The detailed results of the sensitivity analysis for different truck capacity thresholds are summarized in Table 8. The table shows the variation of trucks required, distance (km), and collection time (hrs) with capacity usage showing declining returns after 90%.
Analysis:
Beyond 90%, there is minimal efficiency improvement with greatly heightened risk of overflow.
This study confirms the selection of 90% as the ideal truck capacity limit for effectiveness in waste gathering. The levels of thresholds (80-100%) were juxtaposed with the aim of identifying the ideal level that will maximize the use of trucks while there is allowance for margin against overloading during transport.
Table 8. Sensitivity analysis results
|
Threshold (%) |
Trucks Required |
Distance (km) |
Collection Time (hrs) |
|
80 |
4 |
187.2 |
8.5 |
|
85 |
3 |
156.8 |
7.2 |
|
90 |
2 |
134.6 |
6.1 |
|
95 |
2 |
128.4 |
5.8 |
|
100 |
2 |
125.2 |
5.6 |
5.2 Sensor accuracy validation
Reference instrument: Testo 340 industrial flue gas analyzer
The gas sensors (MQ4, MQ136, MQ137) were validated against professional-grade reference instruments to ensure reliable odor and harmful gas detection. The Root Mean Square Error (RMSE) measures prediction accuracy, while Accuracy (%) shows how close the readings are to reference values, with the sensors achieving 96-97% accuracy sufficient for real-time waste monitoring. Table 9 provides accuracy comparisons between Trash Tech gas sensor readings and a professional-grade reference instrument. Table 10 compares the performance metrics of the ADS1115 and 10-bit ADC modules.
This comparison justifies the decision to use the 16-bit ADS1115 ADC over standard 10-bit converters for higher accuracy of measurements. Resolution is the smallest detectable change, Fill Level Error is measurement deviation in centimeters, and Temperature Drift is the impact of temperature on accuracy - the ADS1115 is 64× better in resolution and 75% lower in error.
Table 9. Gas sensor accuracy comparison
|
Sensor Type |
Trash-Tech Reading (ppm) |
Reference Instrument (ppm) |
RMSE |
Accuracy (%) |
|
MQ4 (Methane) |
245.3 ± 12.1 |
251.2 ± 3.2 |
8.7 |
97.6% |
|
MQ136 (H₂S) |
18.7 ± 2.3 |
19.4 ± 0.8 |
1.9 |
96.4% |
|
MQ137 (NH₃) |
63.2 ± 4.8 |
65.8 ± 1.5 |
3.1 |
96.1% |
Table 10. ADS1115 vs. 10-bit ADC comparison
|
Parameter |
10-bit ADC |
ADS1115 (16-bit) |
Improvement |
|
Resolution |
1024 levels |
65,536 levels |
64× better |
|
Fill Level Error |
±3.2 cm |
±0.8 cm |
75% reduction |
|
Gas Reading Error |
±8.5 ppm |
±2.1 ppm |
75% reduction |
|
Temperature Drift |
±2.1%/℃ |
±0.3%/℃ |
86% reduction |
5.3 Statistical analysis
Paired t-test results (n = 9 samples):
H₀: μ_traditional = μ_Trash Tech
H₁: μ_traditional > μ_Trash Tech
t-statistic = 4.73
p-value = 0.0012
α = 0.05
Result: p < 0.05, reject H₀. The reduction is statistically significant.
Table 11. ANOVA analysis
|
Source |
df |
SS |
MIS |
F |
p-value |
|
System |
1 |
12.67 |
12.67 |
22.38 |
0.0008 |
|
Error |
16 |
9.06 |
0.57 |
- |
- |
|
Total |
17 |
21.73 |
- |
- |
- |
Effect Size (Cohen's d): 1.58 (Large effect)
Paired t-tests and ANOVA analysis were employed statistically to determine the Trash Tech system has a considerable impact of reducing use of trucks by a considerable 20% compared to conventional methods. The t-statistic (4.73) and p-value (0.0012 < 0.05) were employed to determine statistical significance, whereas the large effect size as determined using Cohen's d (1.58) demonstrated the system's real effect in the field is considerable and not an artefact of random chance. A detailed breakdown of the ANOVA test results is presented in Table 11.
ANOVA Terminology: df (degrees of freedom) reflects sample size restrictions, Sum of Squares (SS) quantifies total variation, Mean Square (MS) is the variance estimate, and F-statistic determines if group means are significantly different.
The environmental study shows the substantial carbon footprint savings by routing the waste collection efficiently. The calculation is derived from assumptions of 4.2 km per L diesel consumption of trucks and CO2 emission factor of 2.68 kg CO2 per L of diesel and resulting daily distance savings of 52.4 km, which is 20% less of the standard routing distance of 262 km.
The annual environmental impact assessment shows substantial benefits with yearly fuel saving of 4,563 L translating to 12.23 tonnes CO₂e per collection zone per annum. Equivalent to the municipal solid waste management system of 500 trucks of the city of Mumbai, Trash Tech cuts down annual CO₂ emissions of 6,115 tonnes CO₂e per year, thus demonstrating the system's holistic contribution towards city sustainability and global warming mitigation. Table 12 outlines the health risks associated with various gas concentrations, correlating WHO thresholds with the Trash Tech alert system.
Key Terms: Lower Explosive Limit (LEL) is the minimum gas concentration that can ignite, 8-hr Time Weighted Average (TWA) represents safe exposure limits over an 8-hour work period, and ppm (parts per million) measures gas concentration in air. The Trash Tech system sets alert levels slightly below or above WHO thresholds to provide early warning for fire hazard zone (methane), moderate risk (hydrogen sulfide), and high odor zone (ammonia) conditions before they reach dangerous levels.
Table 12. Health risk correlation
|
Gas |
WHO Threshold (ppm) |
Trash Tech Alert Level (ppm) |
Health Risk Level |
|
Methane |
1000 (LEL) |
800 |
Fire hazard zone |
|
H₂S |
10 (8-hr TWA) |
15 |
Moderate risk |
|
NH₃ |
25 (8-hr TWA) |
35 |
High odor zone |
6.1 Performance comparison
Comparative evaluation is conducted based on smart waste management solutions current with respect to parameters of performance. Truck reduction is truck reduction percentage required, Cost/Unit (INR) is cost of implementation per device, Features is a system functionality list, and Limitations is an operations limitation list. Trash Tech offers 20% truck reduction at ₹5,000 per device with gas monitoring and full fill but requires Wi-Fi connectivity, thus is cost-efficient in comparison to something like Bigbelly (₹45,000) or AI-based Ahmed et al.'s system (₹12,000).
Mumbai Context Impact demonstrates real-world scalability, whereby the substitution of Mumbai's current 500-strong fleet of garbage collection vehicles with Trash Tech will reduce operations to 400 vehicles, saving ₹2.4 crores a year in terms of reduced fuel and maintenance costs with an 8-month return on investment.
The scale analysis reveals that a 20% reduction in trucks would mean citywide benefits of considerable magnitude for the infrastructure of urban waste management in Mumbai. A reduction of 100 citywide trucks is equivalent to 2,100 L of fuel saved per day and reducing traffic congestion by 5,240 vehicle-km per day, equivalent to enhanced urban mobility. Reducing the maintenance cost by ₹1.2 crores per annum, in addition to a lower environmental impact and operating efficiency, proves that an increase of even 20% returns considerable economic and environmental benefits when extrapolated to mass-scaled urban operations.
A. User role definition
The stakeholder platform uses a hierarchical user role structure to support efficient system operation and responsibility assignments clearly defined at municipality-wide collection teams. It identifies four user roles according to the App User Hierarchy: The System Administrator with full access to the system and user administration authority, Municipal Manager with control over resource allocations and route optimization, Collection Supervisor with control over real-time monitoring and alert management, and Truck Driver with control over the routes and bin status reporting.
Summary of 15 Municipal Worker feedbacks 87% of respondents reported system ease of use through finding the interface easy to use and routes improved with 93% of respondents, while 73% requested offline map views in poor connectivity zones. 2.3 hours average time to learn is a reflection of the usability of the system and rapid adoption at both levels of Municipal Staff.
B. Policy integration framework
The policy integration module allows Data-Driven Decision Making through the creation of practical municipal policies and strategic initiatives from the processing of operating data. Levels of gas emissions provide input into public health policy development, trends in waste generation provide insight into bin position best practice, collection effectiveness ratings provide insight into municipal budgetary allocations, and seasonal trend analysis feeds long-term resource plans. The policy integration module ensures that the Trash Tech system optimizes operating effectiveness but also allows for evidence-based municipal governance and sustainable urban refuse policy development.
The Trash Tech system demonstrates outstanding urban waste management improvement with the use of IoT technology by achieving 20% less garbage trucks required, significant cost reduction, reduced fuel consumption, and lower carbon emissions through real-time monitoring of the fill levels of the bins, methane, and odor emissions. High-precision sensors such as ADS1115 provide precise data acquisition while Firebase provides secure, scalable data handling, verifying Trash Tech as a viable alternative to conventional techniques with real-time interventions for greener and cleaner cities. Future expansion will focus on total technological development with Advanced Communication Networks through NB-IoT and LoRaWAN integration for city coverage, satellite backup in case of a disaster, and 5G support for real-time video monitoring. Predictive Analytics Enhancement will involve LSTM neural networks in prediction of waste, machine learning in prediction of maintenance, Extended Sensing Capabilities through image recognition to automatically sort, temperature sensing to analyze decomposition, and Smart City Integration through synchronization of traffic infrastructure and city development plans. Real-time air monitoring, tracking of carbon, and analysis of biodegradation in evaluation of the environment, in addition to scalability tests and solar-powered sensing development, will ensure total smart city integration towards maximum system effect in sustainable urban waste management.
Though the Trash Tech system is quite efficient in managing trash through the reduction of 20% of the number of trucks and immense cost-saving, a few of the limitations need consideration. First is the connectivity limitation in that the use of Wi-Fi by the system to carry information is a problem in underdeveloped regions, something that can lower the effectiveness of city-wide implementation, while real-time data processing is dependent on a secure internet that may be lacking in underdeveloped or rural regions. Scalability concerns and environmental constraints are related to geographical limitation of study to Malad, Mumbai, and possible limitation of results generalizability to other urban settings, and possible deviations in sensing accuracy due to moisture and temperature variations despite the use of high precision ADS1115 sensors. Economic constraints are related to setup expenses in IoT sensors and cloud infrastructure, possibly discouraging adoption by under-funded municipalities despite long-term operating cost benefits offsetting such expenses. Subsequent editions will require the inclusion of self-calibration sensors, hybrid communication networks (LoRaWAN/NB-IoT), and thorough cross-city validation research in an effort to mitigate such constraints and facilitate wider adoption of the system and success.
|
C |
Array of coordinates containing dustbin locations and volumes |
|
lat |
Latitude coordinate of dustbin |
|
lon |
Longitude coordinate of dustbin |
|
ppm |
Parts per million (gas concentration measurement) |
|
T |
Garbage truck assigned for collection |
|
T' |
New garbage truck assigned when current truck reaches 90% capacity |
|
volume |
Fill volume of dustbin |
|
x, y |
Cartesian coordinates of dustbin location (simplified for distance calculation) |
|
Greek symbol |
|
|
θ |
Threshold value for gas concentration alerts |
|
Subscripts |
|
|
i, j |
Indices for dustbins in optimization algorithm |
|
ADC |
Analog-to-Digital Converter |
|
ESP8266 |
Microcontroller with Wi-Fi capabilities |
|
F |
"Filled" status of dustbin |
|
GPS |
Global Positioning System |
|
H₂S |
Hydrogen Sulfide |
|
IoT |
Internet of Things |
|
NF |
"Not Filled" status of dustbin |
|
NTP |
Network Time Protocol |
|
UID |
Unique Identifier |
[1] Ahmed, K., Dubey, M.K., Kumar, A., Dubey, S. (2024). Artificial intelligence and IoT driven system architecture for municipality waste management in smart cities: A review. Measurement: Sensors, 36: 101395. https://doi.org/10.1016/j.measen.2024.101395
[2] Henaien, A., Elhadj, H.B., Fourati, L.C. (2024). A sustainable smart IoT-based solid waste management system. Future Generation Computer Systems, 157: 587-602. https://doi.org/10.1016/j.future.2024.03.056
[3] Lakhouit, A. (2025). Revolutionizing urban solid waste management with AI and IoT: A review of smart solutions for waste collection, sorting, and recycling. Results in Engineering, 25: 104018. https://doi.org/10.1016/j.rineng.2025.104018
[4] Vamsi, T.M.N., Chakravarthi, G.K., Lanka, P., Divakar, B. (2021). An IoT based smart garbage monitoring and disposal support system. In 2021 5th International Conference on Computing Methodologies and Communication (ICCMC), Erode, India, pp. 438-442. https://doi.org/10.1109/ICCMC51019.2021.9418289
[5] Yadav, A., Khan, A. (2019). Internet of things based wireless garbage monitoring system. In 2019 Third International Conference on I-SMAC (IoT in Social, Mobile, Analytics and Cloud) (I-SMAC), Palladam, India, pp. 103-107. https://doi.org/10.1109/I-SMAC47947.2019.9032540
[6] Sundas, A., Panda, S.N. (2020). IoT based integrated technologies for garbage monitoring system. In 2020 8th International Conference on Reliability, Infocom Technologies and Optimization (Trends and Future Directions) (ICRITO), Noida, India, pp. 57-62. https://doi.org/10.1109/ICRITO48877.2020.9197846
[7] Saha, H.N., Gon, S., Nayak, A., Moitra, S. (2018). IoT based garbage monitoring and clearance alert system. In 2018 IEEE 9th Annual Information Technology, Electronics and Mobile Communication Conference (IEMCON), Vancouver, BC, Canada, pp. 204-208. https://doi.org/10.1109/IEMCON.2018.8614840
[8] Kanta, S., Jash, S., Saha, H.N. (2017). Internet of Things based garbage monitoring system. In 2017 8th Annual Industrial Automation and Electromechanical Engineering Conference (IEMECON), Bangkok, Thailand, pp. 127-130. https://doi.org/10.1109/IEMECON.2017.8079575
[9] Anitha, A. (2017). Garbage monitoring system using IoT. IOP Conference Series: Materials Science and Engineering, 263(4): 042027. https://doi.org/10.1088/1757-899X/263/4/042027
[10] Kothari, J.D. (2018). Garbage level monitoring device using Internet of Things with ESP8266. International Journal of Innovative Research in Computer and Communication Engineering, 7(6): 2995-2998.
[11] Chowdhury, P., Sen, R., Ray, D., Roy, P., Sarkar, S. (2018, August). Garbage monitoring and disposal system for smart city using IoT. In 2018 Second International Conference on Green Computing and Internet of Things (ICGCIoT), Bangalore, India, pp. 455-460. https://doi.org/10.1109/ICGCIoT.2018.8753060
[12] Paavan, L.C.S., Sai, T.G., Naga, M.K. (2019). An IoT based smart garbage alert system. In 2019 3rd International Conference on Trends in Electronics and Informatics (ICOEI), Tirunelveli, India, pp. 425-430. https://doi.org/10.1109/ICOEI.2019.8862518
[13] Kanade, P., Alva, P., Prasad, J.P., Kanade, S. (2021). Smart garbage monitoring system using Internet of Things (IoT). In 2021 5th International Conference on Computing Methodologies and Communication (ICCMC), Erode, India, pp. 330-335. https://doi.org/10.1109/ICCMC51019.2021.9418359
[14] Kumar, S.V., Kumaran, T.S., Kumar, A.K., Mathapati, M. (2017). Smart garbage monitoring and clearance system using Internet of Things. In 2017 IEEE International Conference on Smart Technologies and Management for Computing, Communication, Controls, Energy and Materials (ICSTM), Chennai, India, pp. 184-189. https://doi.org/10.1109/ICSTM.2017.8089148
[15] Priyadarshi, M., Maratha, M., Anish, M., Kumar, V. (2023). Dynamic routing for efficient waste collection in resource constrained societies. Scientific Reports, 13(1): 2365. https://doi.org/10.1038/s41598-023-29593-x
[16] Medehal, A., Annaluru, A., Bandyopadhyay, S., Chandar, T.S. (2020). Automated smart garbage monitoring system with optimal route generation for collection. In 2020 IEEE International Smart Cities Conference (ISC2), Piscataway, NJ, USA, pp. 1-7. https://doi.org/10.1109/ISC251055.2020.9239002
[17] Palagan, C.A., Joe, S.S.A., Mary, S.J., Jijo, E.E. (2025). Predictive analysis-based sustainable waste management in smart cities using IoT edge computing and blockchain technology. Computers in Industry, 166: 104234. https://doi.org/10.1016/j.compind.2024.104234
[18] Chavhan, N., Bhattad, R., Khot, S., Patil, S., Pawar, A., Pawar, T., Gawli, P. (2025). APAH: An autonomous IoT driven real-time monitoring system for Industrial wastewater. Digital Chemical Engineering, 14: 100217. https://doi.org/10.1016/j.dche.2025.100217
[19] Raaju, V.A., Meeran, J.M., Sasidharan, M., Premkumar, K. (2019). IOT based smart garbage monitoring system using ZigBee. In 2019 IEEE International Conference on System, Computation, Automation and Networking ICSCAN), Pondicherry, India, pp. 1-7. https://doi.org/10.1109/ICSCAN.2019.8878742
[20] Ishu, K., Bangar, G., Naik, V. (2021). Smart waste monitoring system using IoT. Journal of Emerging Technologies and Innovative Research, 8(5): D992-D998. http://doi.one/10.1729/Journal.27000
[21] Khan, M.N., Naseer, F. (2020). IoT based university garbage monitoring system for healthy environment for students. In 2020 IEEE 14th International Conference on Semantic Computing (ICSC), San Diego, CA, USA, pp. 354-358. https://doi.org/10.1109/ICSC.2020.00071
[22] Memon, S.K., Karim Shaikh, F., Mahoto, N.A., Aziz Memon, A. (2019). IoT-based smart garbage monitoring and collection system. In 2019 2nd International Conference on Computing, Mathematics and Engineering Technologies (iCoMET), Sukkur, Pakistan, pp. 1-6. https://doi.org/10.1109/ICOMET.2019.8673526
[23] Paul, S., Banerjee, S., Biswas, S. (2018). Smart garbage monitoring using IoT. In 2018 IEEE 9th Annual Information Technology, Electronics and Mobile Communication Conference (IEMCON), Vancouver, BC, Canada, pp. 1181-1185. https://doi.org/10.1109/IEMCON.2018.8614896